#NVDA
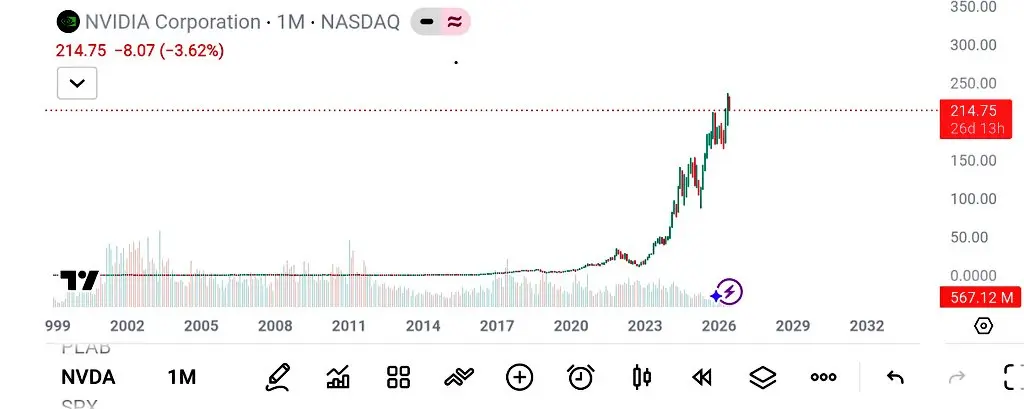
NVIDIA stands as the world's leading AI chip manufacturer, commanding a dominant position in GPU and data center solutions. Currently trading at 196.74 US dollars, NVDA has experienced an 18 percent correction from its mid-May peak. Major technology companies including Amazon, Microsoft, Alphabet, and Meta Platforms collectively project spending 725 billion dollars on capital projects during 2026, representing a 77 percent increase, with majority directed toward AI infrastructure requiring NVIDIA hardware.
Current Market Position
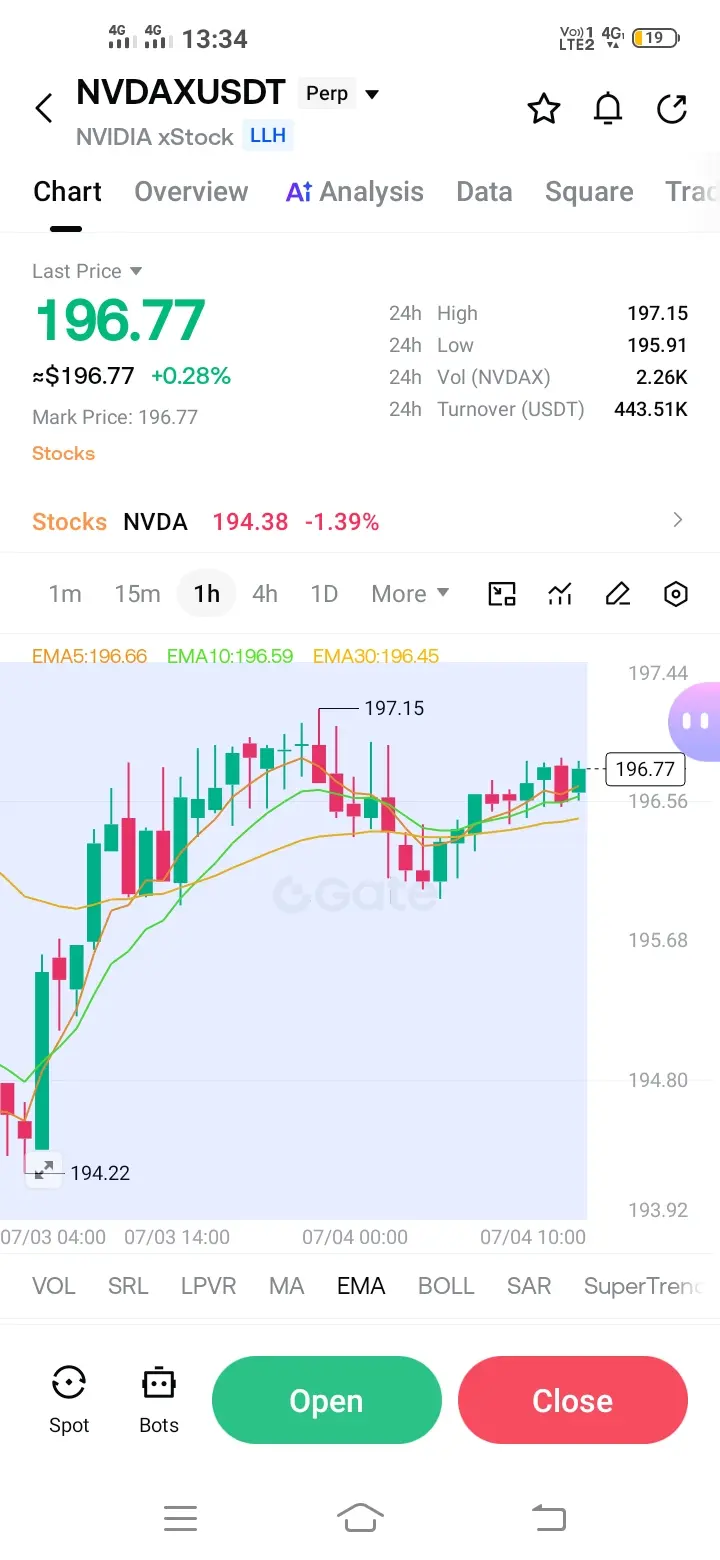
The current price of 196.74 US dollars positions NVDA within a consolidation zone between 192.49 US dollars as the recent low and 200.85 US dollars as the recent high. Over the past 24 hours, the stock demonstrates modest positive momentum with a 0.23 percent gain. Trading volume has declined 85.99 percent compared to daily averages, suggesting diminished market participation and potential indecision among participants.
Technical Support Levels
Support Level One represents immediate floor at 192.50 US dollars to 193.50 US dollars, where recent price action demonstrates buying interest. Support Level Two establishes psychological barrier at 190.00 US dollars to 191.00 US dollars, coinciding with 200-day moving average near 188 US dollars to 194 US dollars. Support Level Three represents major structural support at 183.00 US dollars to 185.00 US dollars. A confirmed break below this threshold signals bearish trend continuation targeting 170 US dollars to 178 US dollars, representing an additional 8.5 percent decline.
Technical Resistance Levels
Resistance Level One marks immediate ceiling at 200.00 US dollars to 201.00 US dollars, representing psychological round number and site of recent rejections. Resistance Level Two identifies moving average cluster at 203.00 US dollars to 206.00 US dollars. Resistance Level Three establishes major structural resistance at 214.00 US dollars to 220.00 US dollars, aligning with previous swing highs and representing 10.8 percent advance from current levels.
RSI Technical Indicator
The Relative Strength Index currently registers approximately 45.0, positioning the stock within neutral territory. This reading indicates NVDA is neither oversold nor overbought. A cross above 50 generates bullish momentum signal, while deterioration below 40 indicates strengthening bearish pressure.
Strategic Price Targets
Take Profit Level One targets 203.00 US dollars to 206.00 US dollars, representing 3.2 percent upside potential. Take Profit Level Two extends to 214.00 US dollars to 220.00 US dollars, capturing 11.8 percent advance. Take Profit Level Three reaches 236.00 US dollars to 240.00 US dollars, representing previous all-time high and offering approximately 22 percent upside potential.
Trading Strategies
Bullish scenario requires NVDA to reclaim and sustain above 200.00 US dollars, triggering momentum toward 203 US dollars to 206 US dollars initially. Long positions become attractive with stop losses positioned below 190.00 US dollars. Bearish scenario activates upon breakdown below 192.50 US dollars, targeting 190.00 US dollars initially and potentially extending to 183.00 US dollars. Range trading strategies capitalize on current 192.50 US dollars to 200.00 US dollars consolidation zone.
Market Sentiment
Social media sentiment reveals predominantly bullish long-term perspectives, with 85 percent of Wall Street analysts maintaining Buy ratings. Consensus 12-month price target exceeds 300 US dollars, implying 52 percent upside potential. China Renaissance recently initiated coverage with Buy rating and 319 US dollars price target, representing 62 percent appreciation potential. However, Michael Burry of Scion Asset Management disclosed short positions against NVDA, arguing AI chip stocks face 30 percent correction potential after extreme 86 percent year-to-date sector gains.
Risk Factors
China energy rule enforcement concerns potentially impact sales. Semiconductor sector's 86 percent year-to-date rally suggests potential mean reversion. Retail trading in Magnificent Seven stocks declined to four-year lows according to Citigroup data. Anthropic AI chip development reports pressured semiconductor stocks broadly.
Conclusion
NVDA at 196.74 US dollars presents technically compelling setup with clearly defined risk parameters. The 192.50 US dollars to 200.00 US dollars trading range offers identifiable entry and exit points. Conservative traders await range breaks before committing capital. Recommended stop loss levels at 190.00 US dollars for long positions, 185.00 US dollars for medium-term protection, and 183.00 US dollars for maximum risk tolerance. Profit targets of 203.00 US dollars, 214.00 US dollars, and 236.00 US dollars provide staged exit opportunities.
@Gate_Square
NVIDIA stands as the world's leading AI chip manufacturer, commanding a dominant position in GPU and data center solutions. Currently trading at 196.74 US dollars, NVDA has experienced an 18 percent correction from its mid-May peak. Major technology companies including Amazon, Microsoft, Alphabet, and Meta Platforms collectively project spending 725 billion dollars on capital projects during 2026, representing a 77 percent increase, with majority directed toward AI infrastructure requiring NVIDIA hardware.
Current Market Position
The current price of 196.74 US dollars positions NVDA within a consolidation zone between 192.49 US dollars as the recent low and 200.85 US dollars as the recent high. Over the past 24 hours, the stock demonstrates modest positive momentum with a 0.23 percent gain. Trading volume has declined 85.99 percent compared to daily averages, suggesting diminished market participation and potential indecision among participants.
Technical Support Levels
Support Level One represents immediate floor at 192.50 US dollars to 193.50 US dollars, where recent price action demonstrates buying interest. Support Level Two establishes psychological barrier at 190.00 US dollars to 191.00 US dollars, coinciding with 200-day moving average near 188 US dollars to 194 US dollars. Support Level Three represents major structural support at 183.00 US dollars to 185.00 US dollars. A confirmed break below this threshold signals bearish trend continuation targeting 170 US dollars to 178 US dollars, representing an additional 8.5 percent decline.
Technical Resistance Levels
Resistance Level One marks immediate ceiling at 200.00 US dollars to 201.00 US dollars, representing psychological round number and site of recent rejections. Resistance Level Two identifies moving average cluster at 203.00 US dollars to 206.00 US dollars. Resistance Level Three establishes major structural resistance at 214.00 US dollars to 220.00 US dollars, aligning with previous swing highs and representing 10.8 percent advance from current levels.
RSI Technical Indicator
The Relative Strength Index currently registers approximately 45.0, positioning the stock within neutral territory. This reading indicates NVDA is neither oversold nor overbought. A cross above 50 generates bullish momentum signal, while deterioration below 40 indicates strengthening bearish pressure.
Strategic Price Targets
Take Profit Level One targets 203.00 US dollars to 206.00 US dollars, representing 3.2 percent upside potential. Take Profit Level Two extends to 214.00 US dollars to 220.00 US dollars, capturing 11.8 percent advance. Take Profit Level Three reaches 236.00 US dollars to 240.00 US dollars, representing previous all-time high and offering approximately 22 percent upside potential.
Trading Strategies
Bullish scenario requires NVDA to reclaim and sustain above 200.00 US dollars, triggering momentum toward 203 US dollars to 206 US dollars initially. Long positions become attractive with stop losses positioned below 190.00 US dollars. Bearish scenario activates upon breakdown below 192.50 US dollars, targeting 190.00 US dollars initially and potentially extending to 183.00 US dollars. Range trading strategies capitalize on current 192.50 US dollars to 200.00 US dollars consolidation zone.
Market Sentiment
Social media sentiment reveals predominantly bullish long-term perspectives, with 85 percent of Wall Street analysts maintaining Buy ratings. Consensus 12-month price target exceeds 300 US dollars, implying 52 percent upside potential. China Renaissance recently initiated coverage with Buy rating and 319 US dollars price target, representing 62 percent appreciation potential. However, Michael Burry of Scion Asset Management disclosed short positions against NVDA, arguing AI chip stocks face 30 percent correction potential after extreme 86 percent year-to-date sector gains.
Risk Factors
China energy rule enforcement concerns potentially impact sales. Semiconductor sector's 86 percent year-to-date rally suggests potential mean reversion. Retail trading in Magnificent Seven stocks declined to four-year lows according to Citigroup data. Anthropic AI chip development reports pressured semiconductor stocks broadly.
Conclusion
NVDA at 196.74 US dollars presents technically compelling setup with clearly defined risk parameters. The 192.50 US dollars to 200.00 US dollars trading range offers identifiable entry and exit points. Conservative traders await range breaks before committing capital. Recommended stop loss levels at 190.00 US dollars for long positions, 185.00 US dollars for medium-term protection, and 183.00 US dollars for maximum risk tolerance. Profit targets of 203.00 US dollars, 214.00 US dollars, and 236.00 US dollars provide staged exit opportunities.
@Gate_Square