Square
Following
Hot
News
Notifications
Profile
Share your thoughts
placeholder
Article
elysium day 1 in numbers, not vibes.
the real sell the news is $KNTQ. down about 26% on the day, and about 5% since the live post.
meanwhile $HYPE went from about $73.80 at that post to near $76.50, while $ETH is down about 5% on the day. the L2 did not drag HYPE down.
the trenches did what launchpad day ones do.
- $HELIOS about -93% in an hour
- $STOCKIUM about -77% on 24h
- a $BLOB/KNTQ pair about -71% on 24h
and the bridge did not empty. it holds about 285K HYPE, roughly $21.9M, up from 280K an hour after go-live.
so the problem is not a dying chain. week one is still the version without Hy
post-image
HYPE+0.24%
ETH-1.26%
#CPI数据前瞻 #WCTCS9 CPI Preview: How One Inflation Report Simultaneously Prices the Fed's Path and the WCTC S9 Leaderboard Race

This week's upcoming US CPI release is the highest-weight economic indicator on the current macro calendar. The reason is straightforward: with AI capex pushing up memory and compute costs while consumer electronics margins come under pressure, the composition of inflation is shifting — and the Fed's tolerance for "last-mile" inflation will directly determine the slope of the rate path. For traders participating in this data isn't just a macro event; it's a volatility w
AMD+11.79%
ARM+7.97%
AAPL+2.30%
QCOM+5.92%
Trenches
牛逼
牛
bade
b
牛逼
0x96...7777
Market Cap
$.
Change
.
24h Vol
$.
Holders
.
BTC
B
bade
b
BTC
C5xp...pump
Market Cap
$.
Change
.
24h Vol
$.
Holders
.
STONK
S
bade
b
STONK
6GmA...UNgx
Market Cap
$.
Change
.
24h Vol
$.
Holders
.
ANSEM
A
bade
b
ANSEM
9cRC...pump
Market Cap
$.
Change
.
24h Vol
$.
Holders
.
PUSSY
P
bade
b
PUSSY
FZxH...Loat
Market Cap
$.
Change
.
24h Vol
$.
Holders
.
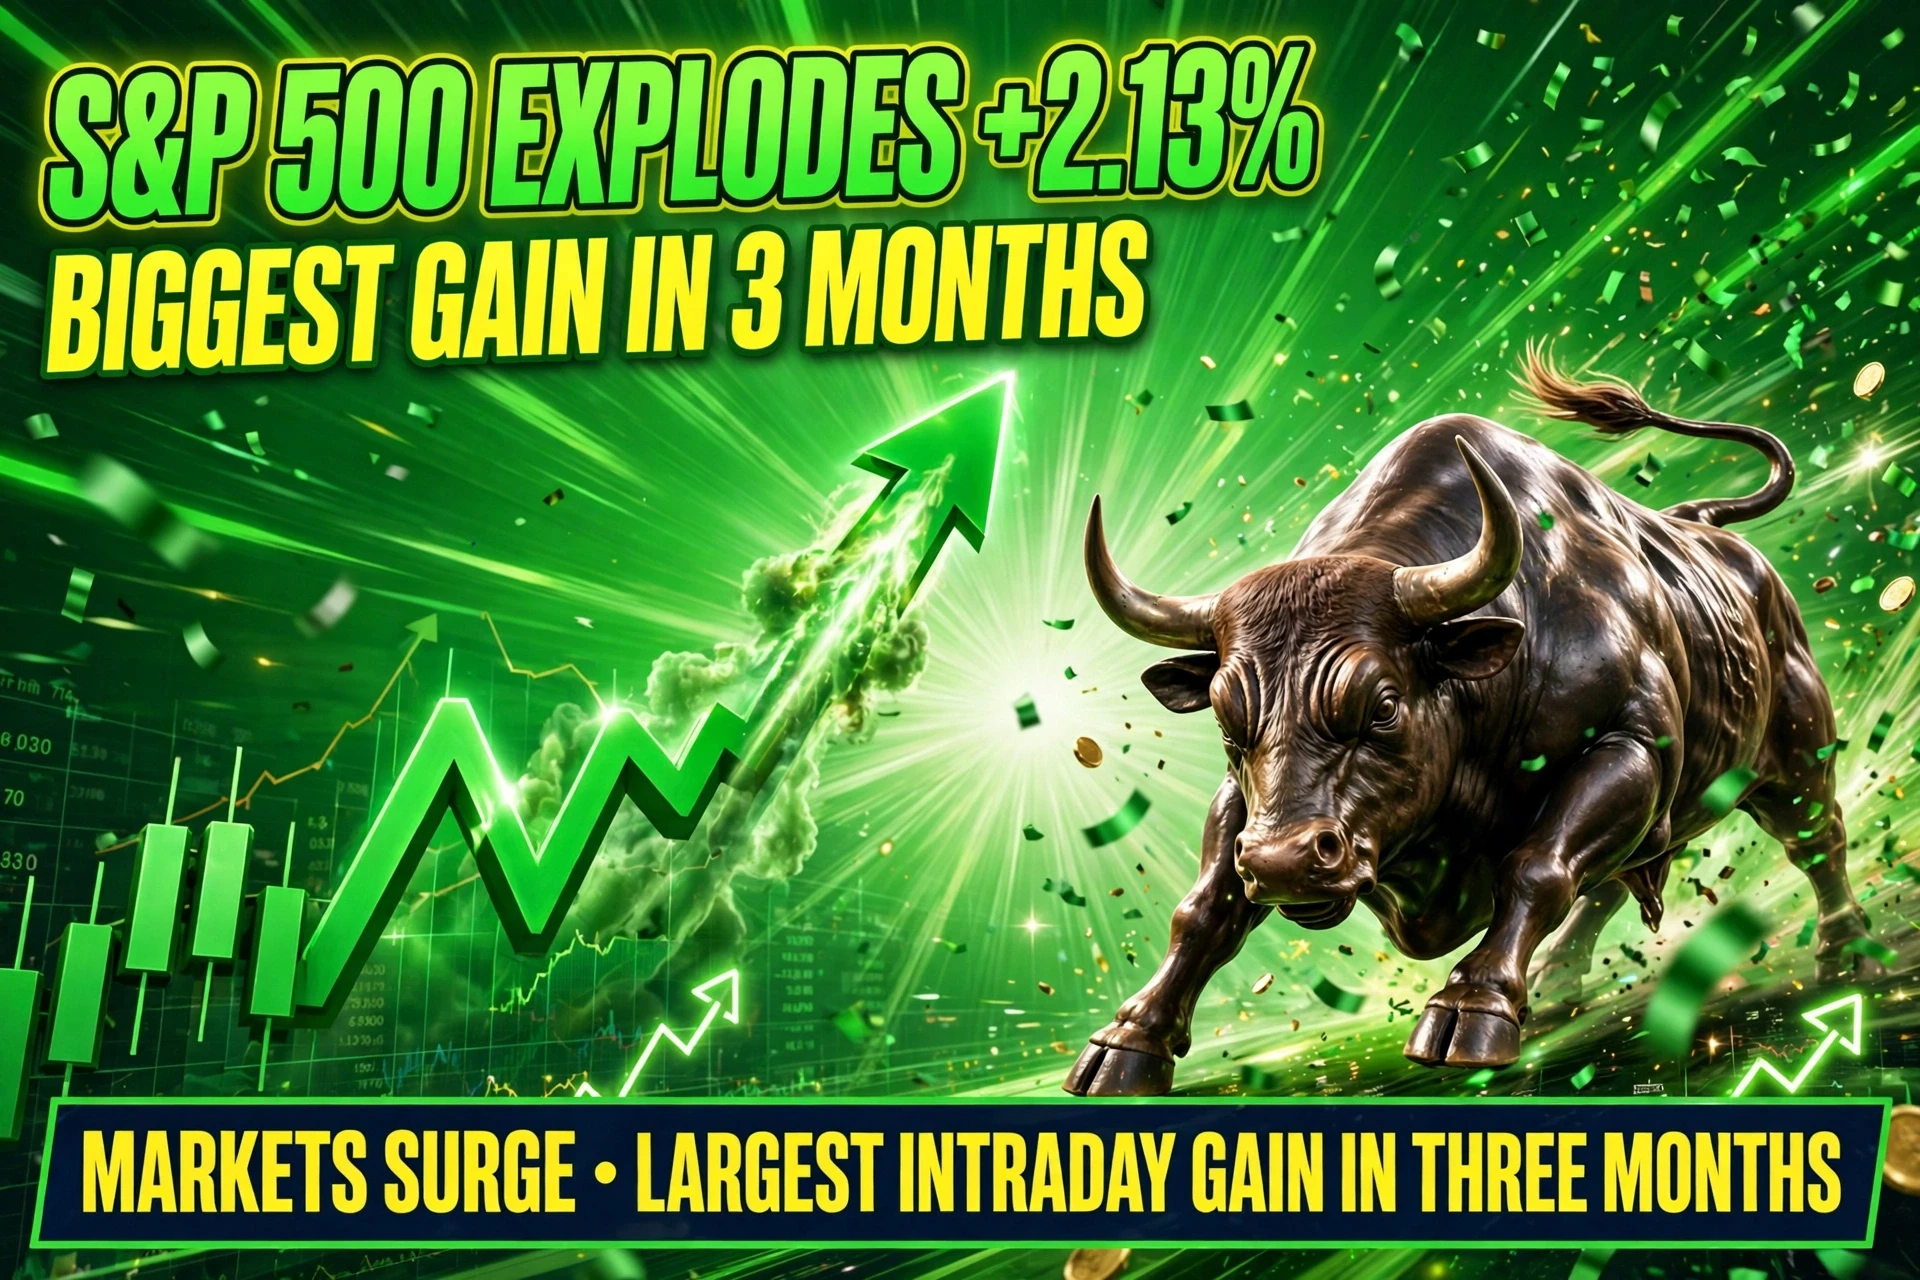
S&P 500 Rises 2.13%, Largest Intraday Gain in Three Months
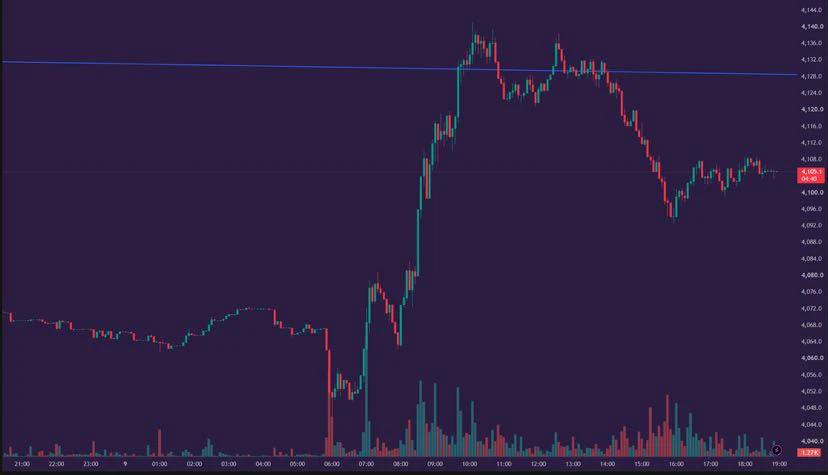
Marked as "Important," the S&P 500 posted a 2.13% rise on November 9, marking its largest intraday gain in three months.
This is the culminating market event of the feed, providing a massive contrast to the negative regulatory news surrounding Nvidia and the volatility in commodities. A 2.13% daily gain for the S&P 500 is a powerful, broad-based rally, suggesting a massive shift in market sentiment.

This surge is likely the result of a confluence of factors. The breaking of the US Dollar below 101 suggests investors are pricing in a
post-image
SPX500+0.19%
NVDA-4.93%
AI Stocks Plunge, but Tech Giants Say Demand Hasn’t Disappeared! Is This AI Sell-Off an Overreacti
live-cover
LIVE1,438
#BTC Flash Crash and Wick
live-cover
LIVE2,128
Bitcoin vs some stuff
post-image
BTC-0.67%
Even swords, guns, and cannons have their moments of failure—what is this little storm you’ve weathered?

#美股AI板块遭遇重挫 ‌ ‌
  • 4
#美股财报季 #Gate股票畅聊季 CoreWeave’s high-leverage predicament

After the U.S. market closes on Nov 10, CoreWeave will release its third-quarter earnings. The importance of this report lies not in how good it is, but in revealing the conditions under which a business model can fail. As of June 30, CoreWeave had $104 billion in remaining performance obligations, up 246% year over year. In the same 10-Q: second-quarter revenue was $2.575 billion, up 112% year over year; capital expenditures in the first half totaled $14.117 billion, while operating cash flow was only $3.663 billion—a gap of $10.454 bil
Gold $XAU has had a pretty interesting run lately 👀

Last week, U.S. stocks and crypto markets were hit by successive sell-offs, while gold climbed back above $4,000 and rose further above $4,100 today.

More notably, U.S. nonfarm payrolls released last Friday came in stronger than expected, further boosting market bets on a Fed rate hike in December.

In theory, this environment isn't favorable for gold, but with oil prices retreating, the dollar weakening, and Treasury yields falling, gold has still received significant support.

I'm still personally bullish on gold, but U.S. October CPI i
post-image
XAU+0.38%
First trade, back-to-back wins—two wins on the day!
BTC 75500 short closed for a 1,700-point gain, banking 8k USDT; reversed into a long at 74078 and took another 1,400 points, banking 6.8k USDT! Nailed both moves and banked profits back to back!
Profits right on plan, switching between long and short with ease and staying in rhythm—two wins right out of the gate!#美国10月CPI即将公布 $BTC
BTC-0.65%
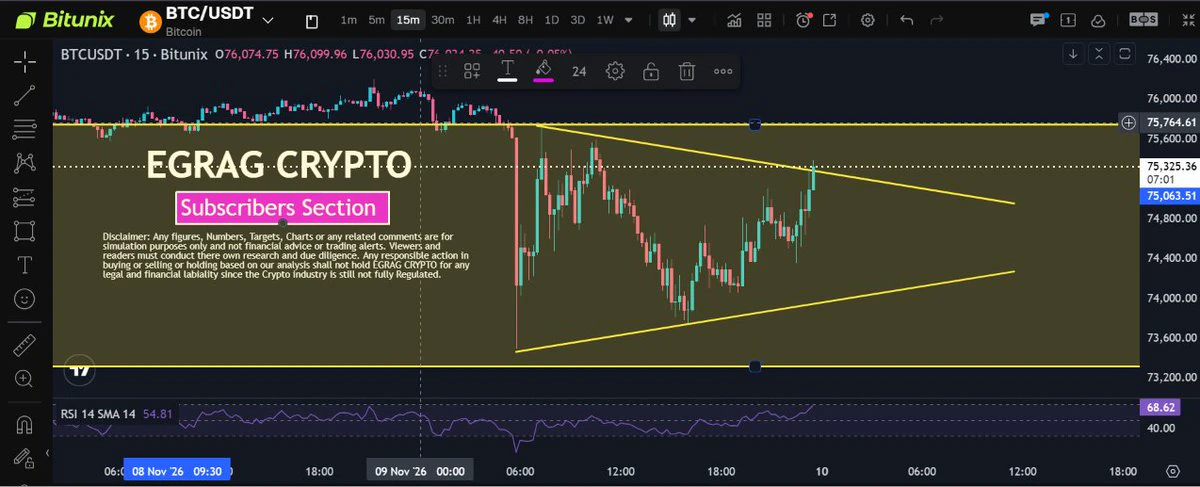
#BTC - 15 Mins Chart:
Close Daily above $76,100 We are Bullish... Other than That NADA
post-image
BTC-0.67%
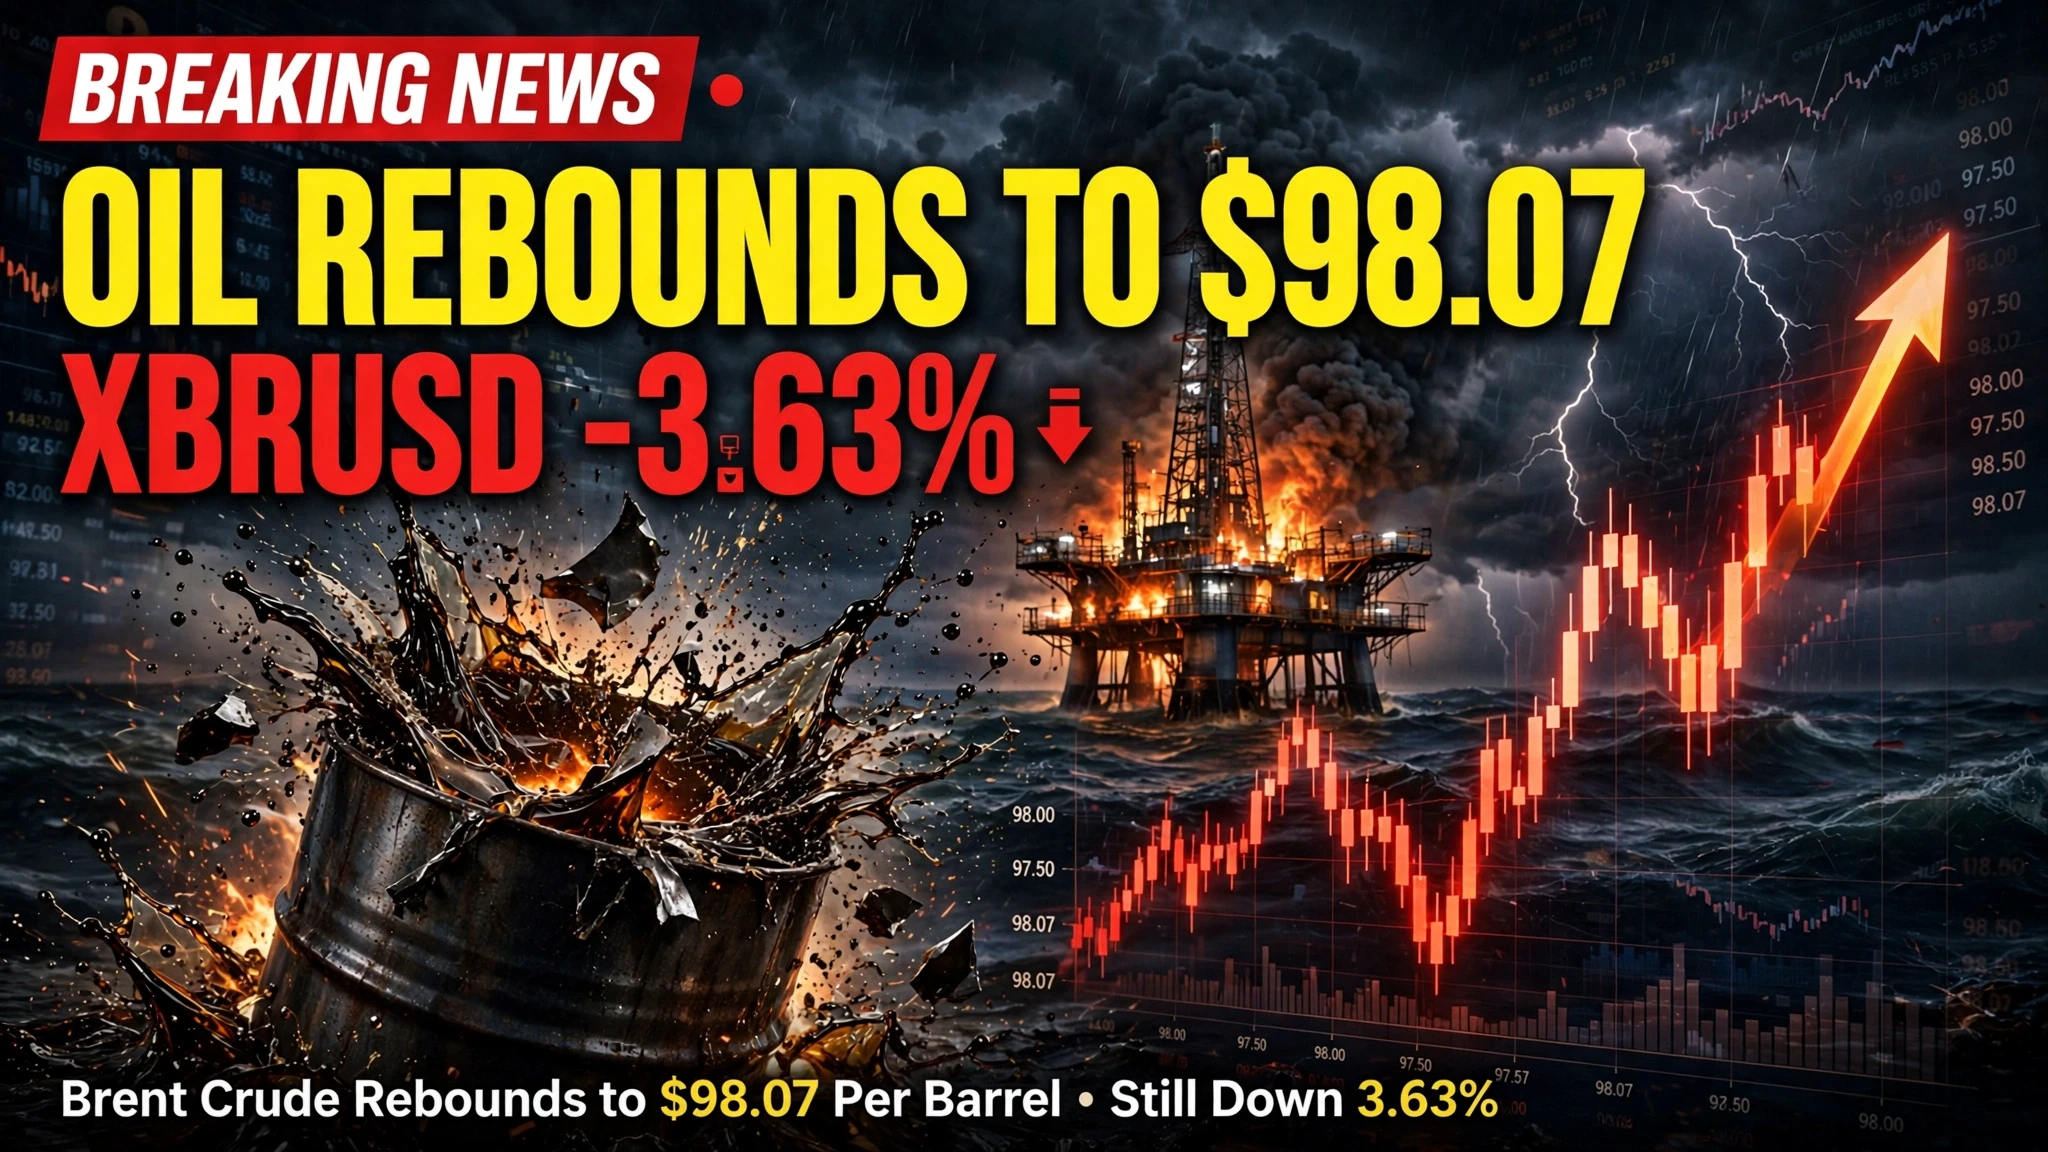
Brent Crude Rebounds to $98.07 Per Barrel

Brent Crude rebounded intraday to $98.07 per barrel but remains down 3.1% from the previous close. The ticker (XBRUSD) shows it down 3.63%.
The phrasing of this headline is critical: it highlights a "rebound" while simultaneously acknowledging a significant daily drop of 3.1%. This indicates a highly volatile trading session for oil. The intraday bounce toward $98 suggests that there is strong underlying demand or supply-side anxiety (perhaps from geopolitical tensions) that is preventing oil prices from falling too far.

However, the overall downward
post-image
XBRUSD-4.25%
#美股财报季 The core conclusion is clear: CoreWeave’s latest earnings report is essentially a public stress test of the “cash-generating ability” of the entire asset-heavy computing services sector, amid an unprecedented global frenzy in AI infrastructure spending.

📈 Business growth: The key to turning orders into revenue is a complete delivery cycle

Global tech giants’ AI capex expectations have now risen from $920 billion to $1.1 trillion–$1.4 trillion, while global AI server revenue surged 52% year over year in Q2 2026. Demand has long been firmly established.
But CoreWeave’s ability to fulfi
CRWV+6.49%
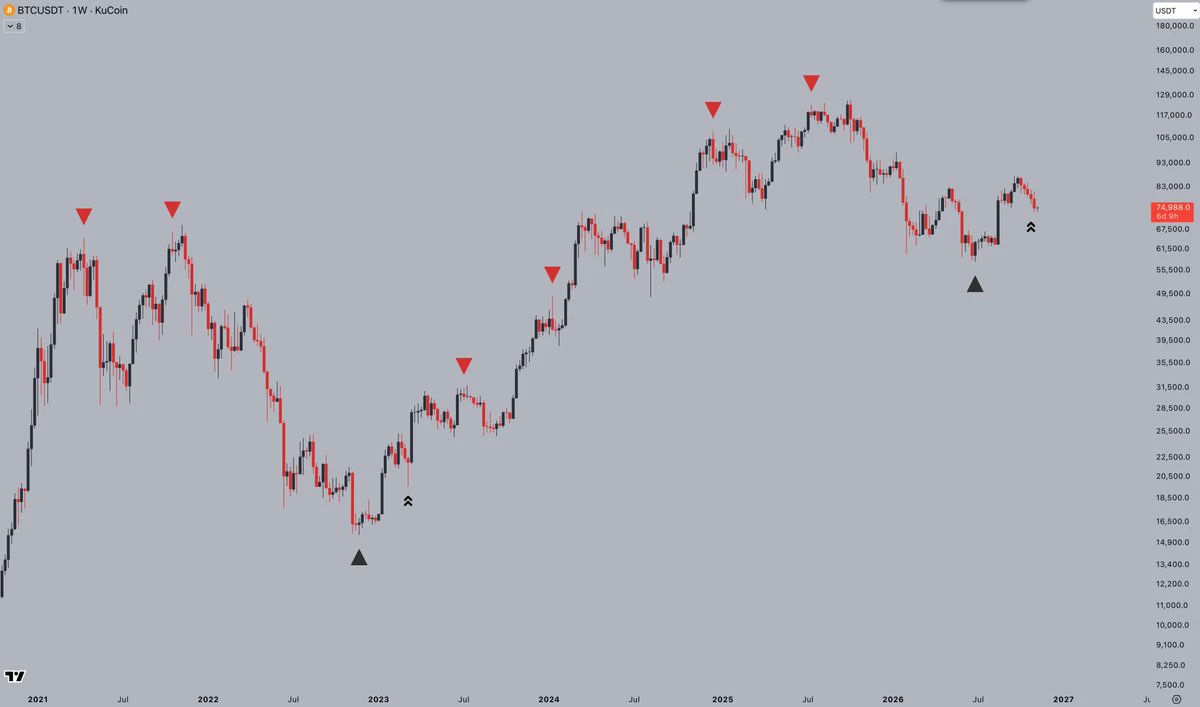
Current On-Chain Outlook:
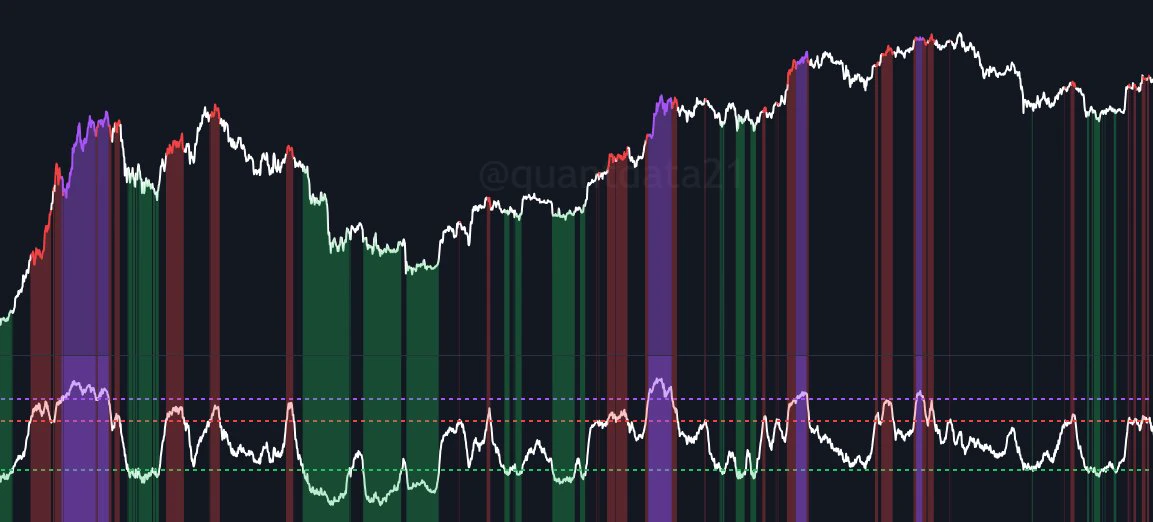
After this move, I reviewed all the on-chain data today. The on-chain models’ current macro-cycle view is that the market is weakening, but we can’t declare the early bull-market phase over just yet.
Here are the details:
-------
Figure 1 is a composite on-chain bull/bear model... It combines 10 on-chain and price indicators related to bull and bear markets...
Basically, a reading above 4 signals entry into the bull-market range, where you can go long.
A reading below 4 signals entry into the bear-market range, where you can stay in cash or go short.
------------
Figu
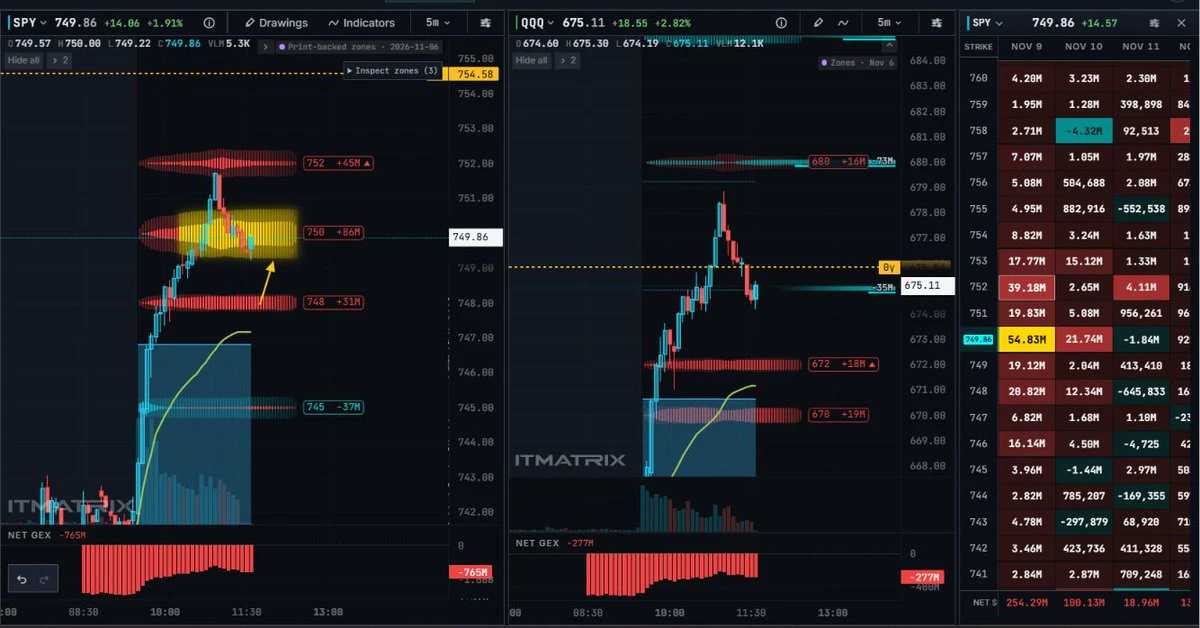
My levels for retracement on SPY @ITMatrixHQ @MyBankIsFat
post-image
SPY+0.06%
$SNXX Up 16.87% in a day to 3.81, with 24h trading volume hitting 417 million—retail investors alone couldn’t generate that kind of volume. But with an intraday low of 2.93 and a high of 3.82, that’s a 30% range, and anyone who chased the rally now has sweaty palms. What I’m unsure about isn’t whether it will rise, but whether this is the start of a major rally or the final handoff.
Bullish case: First, price and volume are moving together in a healthy way. A 16% gain on 417 million in trading volume isn’t a low-volume pump, suggesting real money is changing hands; second, the closing price of
SNXX-0.43%
Good morning 🌊 mentally I’m here lol
post-image
JUST IN: Apple $AAPL reportedly plans to turn Siri into an AI agent that can take actions and complete tasks on behalf of users.
AAPL+2.30%
The first higher low is the scariest.
It only gets easier from here.
$BTC
post-image
BTC-0.67%
#CPI数据前瞻 #WCTCS9 U.S. October CPI is expected to cool significantly, with the month-over-month increase roughly half that of September. The data will be released at 9:30 p.m. Beijing time on November 10.

Market expectations
Headline CPI: Up about 0.3% month over month, versus 0.6% in September.
Core CPI: Up about 0.2% month over month, the smallest increase in three months.
Year over year: Prices were not collected in the same month last year, so no year-over-year figure will be released this time; only the month-over-month figure will be available.

Why the outlook is relatively optimistic
P
  • 1
Load More

Join 40 M users in our growing community

⚡️ Join 40 M users in the crypto craze discussion

💬 Engage with your favorite top creators

👍 See what interests you

Trending Topics

USCPIDataIncoming

39.69k Views2.01k Discussing

The U.S. October CPI report will be released on November 10 at 8:30 a.m. ET. September CPI came in at 3.7% year over year, and markets will be watching closely for signs that inflation is cooling, especially in core CPI. A softer-than-expected reading could strengthen rate-cut expectations, while hotter inflation may pressure risk assets through higher Treasury yields and a stronger dollar. How do you think this CPI print will move $BTC, U.S. stocks and gold?

RedBullDoublePodiumInBrazil

7.3k Views30.58k Discussing

BTCFlashCrash

170.1k Views66.52k Discussing

View More