Share crypto content and earn up to 60% commissions through content mining.
placeholder
gatefun
#GateSquareMayTradingShare
🚀 PRICE PREDICTIONS — HIGH ENGAGEMENT MARKET OUTLOOK
The crypto market is currently in a highly volatile phase where Bitcoin and Ethereum are moving inside a decision zone. Price is not trending clearly in one direction, instead it is reacting sharply around key liquidity areas.
This is the type of environment where:
Fake breakouts appear frequently
Sharp reversals confuse traders
Liquidity is taken from both sides
The real trend is still building underneath
Right now, the market is not showing clarity — it is showing preparation.
₿ BITCOIN OUTLOOK — NEW HIGH OR DR
BTC-2.93%
ETH-3.37%
post-image
  • Reward
  • 1
  • Repost
  • Share
EagleEye:
Very informative and powerful trade breakdown 🔥
4 pictures 1 word!
These days have been writing Launchverse documentation, guides, and templates.
Deeep dive how preview container works in Launchverse
post-image
post-image
  • Reward
  • Comment
  • Repost
  • Share
Being able to pay myself no matter how big or small has been my biggest dreams
I guess I had to pay myself again this week gn guys.
Motion over Emotions.
  • Reward
  • Comment
  • Repost
  • Share
Completely different story when Saylor buys not 90 hundreds, but only 90 Bitcoins 😁
#crypto
post-image
  • Reward
  • Comment
  • Repost
  • Share
This chart should be in every $ONDO holder’s saved folder.
TVL: $3.778B as of May 14, 2026.
That curve started near zero in early 2024.
It is nearly vertical today.
Now look at the other line.
Daily fees on that same day: $27,310.
Not $27 million. Not $2.7 million.
$27,310.
A protocol that grew from zero to $3.778B in 18 months is generating less in daily fees than a mid-size restaurant makes in a week.
The TVL curve went parabolic.
The fee line did not follow.
That gap is the most important chart in RWA right now.
It does not mean $ONDO is broken.
It means the value capture layer has not caug
ONDO-6.68%
RWA-0.76%
post-image
  • Reward
  • Comment
  • Repost
  • Share
$MET | 1h | Rejection Short
Bias: Short
Entry Zone: 0.1532 to 0.1540
Stop Loss: 0.1562
Targets:
TP1: 0.1510
TP2: 0.1499
TP3: 0.1482
Invalidation:
Close above 0.1562
Why This Setup:
I see a clear intraday downtrend with lower highs, and price is struggling to reclaim the 0.1540 area after the sharp breakdown. I’m fading the rebound into resistance, looking for continuation back toward the prior liquidity lows.
#GateSquareMayTradingShare:
MET-5.85%
post-image
  • Reward
  • Comment
  • Repost
  • Share
GN if you’re ready to be rich 🌙🍷
post-image
  • Reward
  • Comment
  • Repost
  • Share
Live analysis of btc
gate liveLIVE
1,240
  • Reward
  • Comment
  • Repost
  • Share
Everything Is Red. Where Did The Money Go?
Bitcoin cracked below $79,000. Ethereum slid under $2,200. Gold shed 2.5%. Silver tumbled. The S&P 500 and Nasdaq dropped together. Even oil slipped from its highs. When every screen flashes red, a single question echoes: Where is the capital actually flowing?
🔹 The Short Answer
The money did not vanish. It sprinted toward safety, chasing the one asset that suddenly pays real yield: the US Dollar.
Money market funds just absorbed a staggering $136 billion, the largest weekly inflow since January . Bond funds pulled in another $25.9 billion, extending
BTC-2.93%
ETH-3.37%
US500-1.39%
USIDX0.44%
post-image
  • Reward
  • Comment
  • Repost
  • Share
#Bitcoin HY Credit Cycles signal macro risk-off 🔻
📝 The HY Credit BTC Cycles indicator shows macro conditions driving wider credit spreads, signaling increasing risk aversion.
📍 The chart's Halving 4 cycle (purple line) indicates the HY Rank descending towards 40% (spreads widening), with $BTC at ~$79K reacting to this macro pressure.
💡 This trend aligns with institutional selling and suggests capital outflows from higher-risk assets, necessitating caution amid broader market uncertainty.
BTC-2.93%
post-image
  • Reward
  • Comment
  • Repost
  • Share
🔴 KW QUANT Signal Alert
SELL #XAUUSD
SL: 4583.48 | TP: 4513.71
Score: ko-20260515155553-Call-4630
Barrier Option Magnetic Field Theory × Kyle (1985)
05/15 15:56 UTC
#Gold #XAUUSD #SystemTrading
View Original
post-image
  • Reward
  • Comment
  • Repost
  • Share
#GateSquareMayTradingShare
CRYPTO MARKET UPDATE — BITCOIN & ETHEREUM PRICE PREDICTIONS
🚀 PRICE PREDICTIONS — MARKET IS AT A DECISION ZONE
The crypto market is currently showing strong volatility, fast reversals, and liquidity-driven moves. Bitcoin and Ethereum are both sitting in a phase where direction is not fully confirmed, but pressure is building for a major move.
This is the type of market where:
Breakouts fail before they succeed
Fake moves appear on both sides
Emotional traders get trapped
Smart money collects liquidity quietly
Right now, the market is preparing — not fully trendin
BTC-2.93%
ETH-3.37%
post-image
post-image
  • Reward
  • 1
  • Repost
  • Share
EagleEye:
Very informative and powerful trade breakdown 🔥
Japan's 30 year bond just crossed 4% for the first time in history and it could collapse the biggest free money trade on the planet
For 25 years, Japan has been the world's ATM, you borrow yen at near zero, convert it to dollars, buy US Treasuries, US stocks, EM bonds, real estate or crypto, then pocket the spread between them
Morgan Stanley estimates there's currently $500 billion in active yen carry positions and this single trade has funded global asset prices for an entire generation
The math is now breaking, at 0.25% borrowing cost the trade still prints money, but at 0.75% short term and
MS-1.18%
BTC-2.93%
ETH-3.37%
post-image
  • Reward
  • Comment
  • Repost
  • Share
Jane Street Didn't Abandon Bitcoin
The 71% cut in Bitcoin ETF exposure grabbed every headline. But the 13F filing tells a different story. This is not a retreat. This is a market maker doing exactly what market makers do.
🔹 The Numbers That Scared Everyone
Jane Street cut IBIT by 71% to 5.9 million shares worth roughly $225 million. FBTC dropped 60% to 2 million shares valued near $115 million. The MSTR stake collapsed 78% from $146 million to $27 million .
On the surface, this reads like a giant running from Bitcoin. The surface reading is wrong.
🔹 What A 13F Actually Reveals
A 13F filing c
BTC-2.95%
IBIT-2.92%
MSTR-5.23%
post-image
User_any
#JaneStreetReducesBitcoinETFHoldings
Jane Street Cashes Out Bitcoin Chips
A Wall Street titan just reshuffled the deck. The latest 13F filing shows Jane Street slashed Bitcoin exposure and rotated capital into Ether and crypto equities. The signal is unmistakable.
🔹 Bitcoin ETFs Got Dismantled
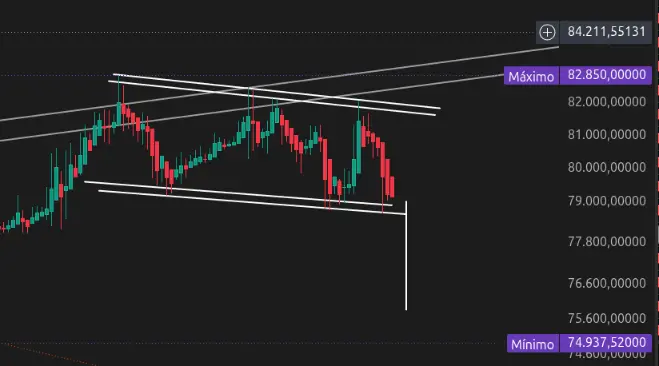
Jane Street cut BlackRock's IBIT by roughly 71%, leaving about 5.9 million shares worth approximately $225 million . Fidelity's FBTC dropped about 60% to around 2 million shares valued near $115 million . This was not a trim. This was a strategic exit from core Bitcoin ETF positions built up in late 2025.
🔹 The MicroStrategy Exit
The Strategy stake collapsed from about 968,000 shares to roughly 210,000 shares. Reported value plunged from nearly $146 million to about $27 million, a 78% quarter-over-quarter decline . The same firm that boosted MSTR exposure by 473% in Q4 2025 reversed course hard . Bitcoin miners also took hits. IREN, Cipher Mining, TeraWulf, and Core Scientific positions all got reduced .
🔹 Ether ETFs Got The Capital
The money did not leave crypto. It rotated. Jane Street added approximately $82 million combined across BlackRock's ETHA and Fidelity's FETH . The ETHA position nearly doubled during the quarter . This mirrors moves at Wells Fargo and signals early institutional accumulation in Ether products.
🔹 The Surprise Winners
Riot Platforms holdings jumped from about 5 million shares to 7.4 million shares, valued at roughly $91 million . Coinbase exposure rose to approximately 888,000 shares .
The biggest move was Galaxy Digital. Holdings skyrocketed from roughly 17,000 shares to about 1.5 million shares. Reported value exploded from around $380,000 to approximately $28 million .
🔹 Context Matters
Jane Street posted a record $16.1 billion in trading revenue in Q1 2026 . This firm is one of the largest ETF market makers globally. Its quarterly filings are closely watched by institutional investors. The 13F reflects reportable long positions as of March 31 only. It excludes derivatives, short positions, and the broader trading book .
The Bottom Line
Bitcoin ETFs got chopped 60% to 71%. MicroStrategy shed 78%. Bitcoin miners trimmed. Ether ETFs added $82 million. Galaxy Digital multiplied nearly 88 times. The smart money is rotating, not retreating. One of Wall Street's sharpest trading desks is betting the next leg runs through Ethereum and crypto equities.
Friends, is this a warning sign for Bitcoin dominance or just one firm taking profits after a massive run?
repost-content-media
  • Reward
  • 1
  • Repost
  • Share
EagleEye:
Small profits consistently become big success
$BTC The chartist figure suggests a continuation of the decline.
BTC-2.93%
View Original
post-image
  • Reward
  • Comment
  • Repost
  • Share
I'm betting on $XRP & $FLR for generational wealth.
XRP-4.97%
FLR1.9%
post-image
  • Reward
  • Comment
  • Repost
  • Share
Fuck! This $ANTA chart is really incredible! Purely a capital game, the market makers are calling each other idiots, and the retail investors just can't hold on! The candlestick chart is jumping around like crazy, shaking out the stops and making me dizzy!
Entry point around 9.645, brothers, this time the market makers deliberately dumped the price, we need to follow and run. Don’t fight the market, this kind of situation is all about quick reflexes; if you’re too slow, the market makers will harvest you!
Don’t fucking ask why it’s falling, this is just a pure market game, the market makers a
View Original
post-image
  • Reward
  • Comment
  • Repost
  • Share
Analysis crypto market
gate liveLIVE
169
live-coin
  • Reward
  • Comment
  • Repost
  • Share
THORChain suspends trading after a suspected $10 million exploit affecting multiple chains - #sec
View Original
post-image
  • Reward
  • Comment
  • Repost
  • Share
$SKY Slips as Protocol Chooses Safety Over Hype
A 3.23% drop. Volume missing by 94%. SKY is not crashing, it is simply not participating in the broader recovery while its own protocol prioritizes fortress-building over price pumps .
🔹 The Numbers Paint a Quiet Picture
SKY oscillated between $0.0707 and $0.07382 over 24 hours. The 3.23% decline came on volume of roughly 77K, a ghost town compared to the 7-day average of 1.16M. Classic contraction pullback. No panic, but no bid either.
The 90-day view stays positive at +6.69%, but the 7-day clock shows -10.66%. SKY underperformed Bitcoin durin
SKY-3.25%
BTC-2.93%
USDS-0.03%
post-image
  • Reward
  • 1
  • Repost
  • Share
EagleEye:
Small profits consistently become big success
Load More