Share your thoughts
placeholder
Article
$The bull is coming. Stay calm and don’t get carried away; losses will only be temporary.
post-image
牛来+39.94%
Everyone’s staring at XLM’s 0.18517—but the 4h chart is screaming something they refuse to hear.

$XLM /USDT - SHORT

Trade Plan:
Entry: 0.18481 – 0.18553
SL: 0.18865
TP1: 0.18256
TP2: 0.18082
TP3: 0.17821

Why this setup?
Why now? The 1D trend is range-bound, yet momentum is fading.
- RSI (15m) at 61.37 shows a weak bounce—not a breakout.
- ATR (1h) at 0.001449 confirms tight, indecisive moves.
- With a SHORT bias (55% confidence), the path of least resistance is down toward TP1 (0.18256) and TP2 (0.18082).
- Entry window 0.18481–0.18553 is your trap zone—don’t chase green here.

XLM+3.63%
$4 Signal: 1H pullback holding, buy-the-dip long setup
$4 1H pullback to the Bollinger middle band, with the current price of 0.030874 entering the support zone. Funding rate is 0.0351%, and OI is flat. Order book imbalance is -20.76%, with slightly heavier sell orders; the 1H MACD histogram has compressed back toward the zero line, and downside momentum has been exhausted. 4H RSI is 72.48, 1H RSI is 58.79, and the trend structure remains intact.
🎯Direction: Long
⚡Entry/limit order: 0.03078138 - 0.03087400
🛑Stop-loss: 0.02933030
🚀Target 1: 0.03318955
🚀Target 2: 0.03434732
🛡️Trade manageme
post-image
4+17.33%
BTC+0.51%
ETH+2.13%
SOL+2.10%
1 BTC to whoever can tell me how to survive this
post-image
BTC+0.51%
Many people are focused on the key levels above, while overlooking the key levels below slowly moving higher. $BULLA After this move was pushed up from around 0.028584, the floating profit on my long position once reached +1949.58%, but I never chose to exit everything at once.
Because in trading, taking profits and letting profits run are inherently contradictory. My approach is simple: first turn 70% into real cash, move the take-profit level for the remaining 20% above the entry price, give the market some room, and leave myself a way out.
The price is currently consolidating repeatedly aro
post-image
BULLA+195.66%
XRP+1.63%
BNB+5.97%
Stop scrolling if you think ZEC is dead—this 95% confidence signal says otherwise.

$ZEC /USDT - LONG

Trade Plan:
Entry: 1027.77 – 1035.19
SL: 995.83
TP1: 1058.22
TP2: 1076.04
TP3: 1102.78

Why this setup?
- 4h timeframe is **Armed LONG** with 95% confidence—that’s rare.
- 1D trend is bullish, and 1h RSI (66.37) shows momentum building, not overheated.
- Entry zone: 1031.48 (low 1027.77–high 1035.19). TP1 1058, TP2 1076, TP3 1102.
- Why now? Price is squeezing above recent ATR (14.85) volatility—breakout fuel is loaded.

Debate:
Is ZEC front-running a privacy narrative revival, or w
ZEC+4.99%
Everyone’s staring at the 2.19 support while the 4H quietly prints a 95% long setup—are you late or early?

NEAR/USDT - LONG

Trade Plan:
Entry: 2.1819 – 2.2029
SL: 2.0917
TP1: 2.2679
TP2: 2.3182
TP3: 2.3937

Why this setup?
- The 1D trend is bullish, and price is coiling right at the 2.1924 reference—this is the “calm before expansion” zone.
- RSI on 15m sits at 49.61—neutral, meaning no overbought friction to block a push toward TP1 (2.2679) or TP2 (2.3182).
- ATR (0.0419) shows volatility is compressed—when it breaks, the move is fast. Entry window: 2.1819–2.2029. Invalidation only b
The hand that set the stop-loss a few days ago trembled slightly; this morning, I realized that overprotective gesture had been unnecessary. The final $DOT rebound before bed reached around 1.193. It looked strong, but the more it pushed, the more hollow it felt—the volume failed to keep up, and it clearly could not hold. The short position was already open, so I placed the stop-loss outside the key level and went to sleep, thinking I would accept it if I got stopped out. When I woke up, the price had not tested higher; instead, it slid to 0.922, delivering a paper return of +1611.81%. Staying
post-image
DOT+2.53%
ETH+2.14%
SNDK+1.87%
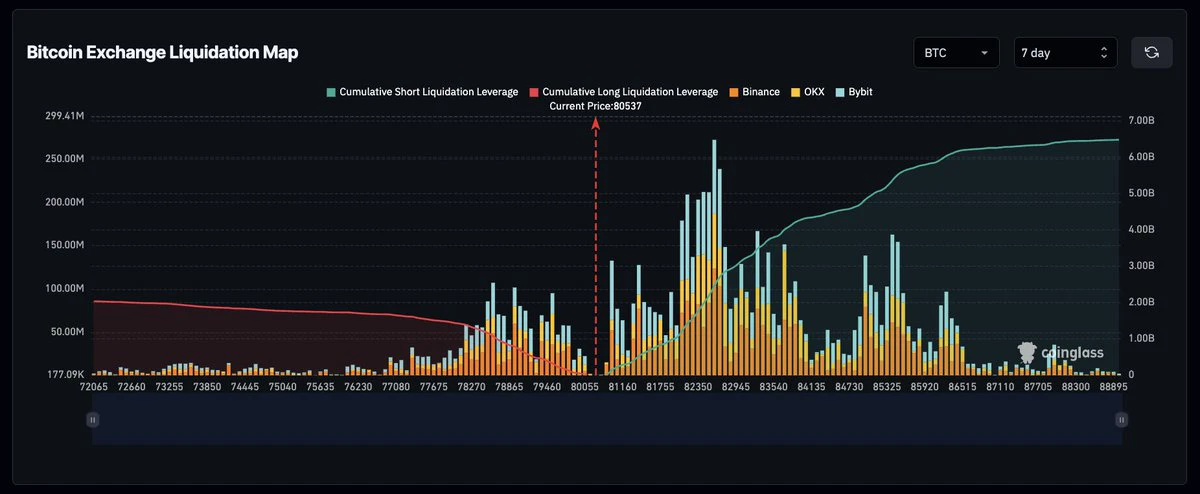
After the previous rebound peaked at 80200, it failed to break above the 80800‑81200 resistance zone and formed a top fractal on the lower timeframe, triggering a pullback;
2. The market has now returned to the previous consolidation center (79700‑80000), and the 30-minute timeframe has shifted from a “strong rebound” to a consolidation mode;
3. Structural assessment: The pullback from 82000 has not truly ended yet; this is merely an extension of the consolidation center, and two possible paths remain.
Path 1 (relatively strong)
This consolidation does not break down; a new bottom fractal form
post-image
BTC+0.51%
Take profit or significantly reduce the position around 2495–97 (you can try a small short at 2497–95, with a stop-loss at 2510)
post-image
Repeated rebounds have been thwarted, and the short-term outlook for $ZAMA has completely weakened.
After multiple failed attempts to hold above the upper price levels, incremental capital has stopped entering, and the market has entered a stock-based game. High-level holders are gradually taking profits and exiting, selling pressure on the order book continues to be released, and indicators reflect weakening bullish momentum, leaving room for a pullback.
Prices continue to probe lower, remaining in a weak range in the short term with intense volatility, and a rebound recovery may occur at an
post-image
ZAMA-3.28%
DOGE+7.24%
Four signals 🔥 to understand current crypto market changes!
A roundup of four industry trends worth watching closely recently 👇
✅ Morgan Stanley continues increasing its BTC holdings
It has accumulated a total of 355 BTC over the past 4 days, while spot BTC-ETF net inflows continue. The single-day increase is not explosive, but the consistency is what matters. Traditional institutions are steadily entering the market in batches. Short-term inflows do not yet mean the trend has completely reversed.
✅ Fierce competition for USDH issuance rights
Several major players, including Paxos, Frax, and
post-image
BTC+0.52%
HYPE+1.48%
SNDK+11.88%
#Airdrop Event
Starting today, simply download the 2140 app to get a chance to receive an airdrop of 2140 tokens! Limited quantity! Ends September 30, 2026!
I only wanted to hitch a ride for breakfast, but the market ended up serving me six months’ worth of dumplings. How many people were scared into closing everything with one tap during that sharp plunge in the early hours a few days ago? $AR It only touched 2.158 at the key level, volume didn’t shrink, and the key level held. I watched the chart for quite a while and judged it to be nothing more than a scare tactic.

Sure enough, each subsequent candlestick was steadier than the last, gradually grinding up to 3.086, with +2072.42% secured. Those already on board should have woken up laughing.
post-image
AR+14.57%
SOL+2.18%
ZEC+4.99%
Omg $ZEC broke out again!🤯🚀 currently 1078!
post-image
ZEC+4.92%
ASTER long-term spot analysis and the actions I will take:
From the weekly timeframe, after undergoing initial expansion and retracement, ASTER is consolidating within a macro bottoming structure.
📊 Buy zone (primarily limit orders): 0.5346
📊 Secondary support: 0.2265 (if 0.5346 fails to hold)
🎯 Macro long-term target: 5.4441
The main accumulation zone around 0.5346 remains valid for a long-term spot position.
The current price is trading above the accumulation zone. If the price retests 0.5346, it will provide a high-risk-reward entry opportunity to build a long-term position, with the tar
post-image
ASTER+7.04%
Everyone’s staring at ETH’s range—but the 4h tape is quietly building a trapdoor at 2495.

$ETH /USDT - SHORT

Trade Plan:
Entry: 2492.72 – 2497.90
SL: 2520.16
TP1: 2476.68
TP2: 2464.25
TP3: 2445.62

Why this setup?
Why now?
- RSI 15m at 65.87: local exhaustion, not breakout fuel.
- 1D trend is *range*, meaning mean-reversion rules—so 2495 is the ceiling, not the floor.
- ATR 1h at 10.35: volatility is thin, so the SHORT bias (Conf 55) targets a fast fade to TP1 2476 before the weekend liquidity vacuum.
- Entry zone 2492–2497 is the *only* logical sell wall; SL at 2520 keeps risk ti
ETH+2.14%
I’m LONG dogecoin:native
The market is barely pricing DogeOS
It brings an EVM compatible app layer to Dogecoin with DOGE as gas, opening the door for an entire onchain economy to form around it (yes memecoins on doge)
At the same time: DOGE1 targets launch this month, DOGE payments are live across 6,000+ merchants, DOGE Pay is coming, House of Doge is now public and ETF access is live
DOGE already had the liquidity and distribution and without utility it peaked near $90 BN
It's gonna get really silly from here and chart giving generational entries
post-image
DOGE+7.23%
$907,000 A certain trader made two FOMO trades i, resulting in a total loss of $907,000
live-cover
LIVE2,143
Load More

Join 40 M users in our growing community

⚡️ Join 40 M users in the crypto craze discussion

💬 Engage with your favorite top creators

👍 See what interests you

View More