Share your thoughts
placeholder
Article
$JTO has rebounded strongly from the $0.40 region and is currently testing the $0.50 area with strong bullish momentum. The latest candlesticks show sustained buying pressure, keeping the upward structure active.
Long trade setup Entry: $0.4920 – $0.4990TP1: $0.5080TP2: $0.5200TP3: $0.5320Stop-loss: $0.4780Buy and trade $AK
ONE
post-image
JTO+4.73%
🚨 $CELR
— Price has risen to a very high level! 💢👊 Now is the best time to open a short position!🎯 Target: 0.00275-0.0029 → 0.00305 → 0.0032🔴 Short now: $BR 🔴 Short now: $AKE
.
post-image
CELR+49.07%
BR+38.95%
AKE+38.04%
Many people rush to buy the dip when they see the price hugging the lower Bollinger Band and RSI falling to around 40, but overlook the moving-average structure and the MACD histogram still declining—oversold is never a reason to buy; a stabilized structure is.
$SYN The current price is 0.21726. MA5=0.238052 remains below MA20=0.239215, with the short- and medium-term moving averages maintaining a bearish alignment. The price is also trading near the lower Bollinger Band, with the band range [0.211864, 0.266566] indicating that the 0.2119 area below is a key support level for this move. The M
post-image
SYN-1.11%
STRK+3.92%
SHIB+0.56%
Up 37.975% with the funding rate still negative: SKL shorts are taking a beating this round
Damn, $SKL pumped 37.975% in one day, with volume reaching 10.052 times the 30-day average—the crazy part is that the funding rate is still negative. I’m bullish here and would buy the dip on a pullback.

First, leverage hasn’t chased it. The funding rate is -0.00066861, with shorts paying to stubbornly hold on; the long-short ratio is 1.9586—a move driven by spot buying.

Second, the technicals have just turned. Daily RSI is 60.6 and not overbought, while the MACD golden cross is expanding its red
SKL+13.75%
$SOL LONG SETUP | 1H
A pullback aligned with the current trend is entering the planned entry zone. Entry zone: 111.2–111.37 Stop loss: 110.51 Targets: TP1 112.45 (1.52R) / TP2 113.85 (3.34R) / TP3 114.32 (3.95R) Partial exits: 20% / 30% / 50% Note: Expected EV is -0.29R, below the current threshold. Status: Watchlist only—wait for confirmation before considering this setup.
post-image
SOL-1.46%
Nobody is talking about the short setup forming inside SKHYNIX right now.

$SKHYNIX /USDT - SHORT

Trade Plan:
Entry: 1343.81 – 1346.15
SL: 1356.19
TP1: 1336.57
TP2: 1330.97
TP3: 1322.56

Why this setup?
Why now? The daily trend is range-bound, which often sets up a sharp move once a key level breaks. The 1h ATR of 4.671151 shows volatility is compressed enough for a sudden drop. The 15m RSI at 63.31 means momentum is still leaning bearish but has not yet exhausted itself. The entry zone between 1343.81 and 1346.15 aligns perfectly with the 1h price of 1345.02, giving a clean trigger. A bre
SKHYNIX-0.85%
This move—I honestly didn’t understand it, but it understood me.

When the screen was filled with green, $LAB lacked sufficient buying support, and volume failed to keep up, so the rebound was hollow. Entered at 0.08529 and watched it fall all the way down.

At 0.05658, +662.56%—it really feels great. Those still on board must have woken up laughing. Take 80% off first, with the remaining +662.20% protected at the cost basis; if it rebounds, don’t give the profits back.

The market specializes in humbling all kinds of people, especially those who think they’re the smartest. The prerequisit
post-image
LAB+8.08%
SNDK-0.77%
XRP+0.74%
The first rate hike in more than three years did not send Bitcoin lower; instead, it moved upward.
A rate hike should drain liquidity, but this time it seems to have been priced in early. The market adjusted its positions before the news became official. Those who could sell had already done so, leaving only position covering. The buying pressure came from shorts, not from fresh money entering the market.
What needs watching with this trend is the next rate meeting. If there are further rate hikes and the price continues moving upward, it means the market is treating interest rates as a known
post-image
BTC+0.42%
A drop of over $4 in 24 hours has pushed $SOL right down to test its daily support zones! Are the bears taking over or are bulls gearing up for a quick bounce back? Here are the facts you need right now: ⚡ Current Price: $110.28 (-2.82% 24h) ⚡ 24h Range: $110.08 - $114.09 ⚡ Illustrative Long Setup: Entry ~$110.28, SL ~$106.97 (-3%), TP ~$115.79 (+5%) ⚡ Illustrative Short Setup: Entry ~$110.28, SL ~$113.59 (+3%), TP ~$104.77 (-5%). This is just an illustrative risk management framework and not a price prediction or financial advice. Always DYOR! How are you playing this level today? #Solana #Cr
post-image
SOL-1.46%
#GateSquareMidAutumnReunion #SKHynix
SK Hynix is currently trading around 1,344, putting the stock directly inside one of the most important semiconductor narratives of 2026: the accelerating demand for AI memory, HBM, advanced DRAM and data-center infrastructure. The current setup combines strong fundamental momentum with exceptionally high semiconductor volatility, making price, percentage movement, volume and liquidity extremely important for understanding the next phase.
The first major point is the price structure around 1,344. This level should be treated as an immediate market referenc
  • 2
$ARGUS ARC innovatively uses USDC as GAS. The benefit is that it’s genuinely convenient, since you no longer need ETH—just bridge USDC over and enjoy seamless transactions. But the drawbacks are also obvious: once you approve USDC through a phishing scam, your funds are gone immediately. There are also security issues: I’ve found that many projects directly copy ETH’s code without realizing at all that USDC is the underlying GAS.
The ARC chain has had a truly disastrous launch.
I bought $ARGUS , feeling that I could take a punt on ARC rebounding from the bottom.
post-image
ARGUS+14.08%
Most traders are about to get blindsided by SYMBOL right now.

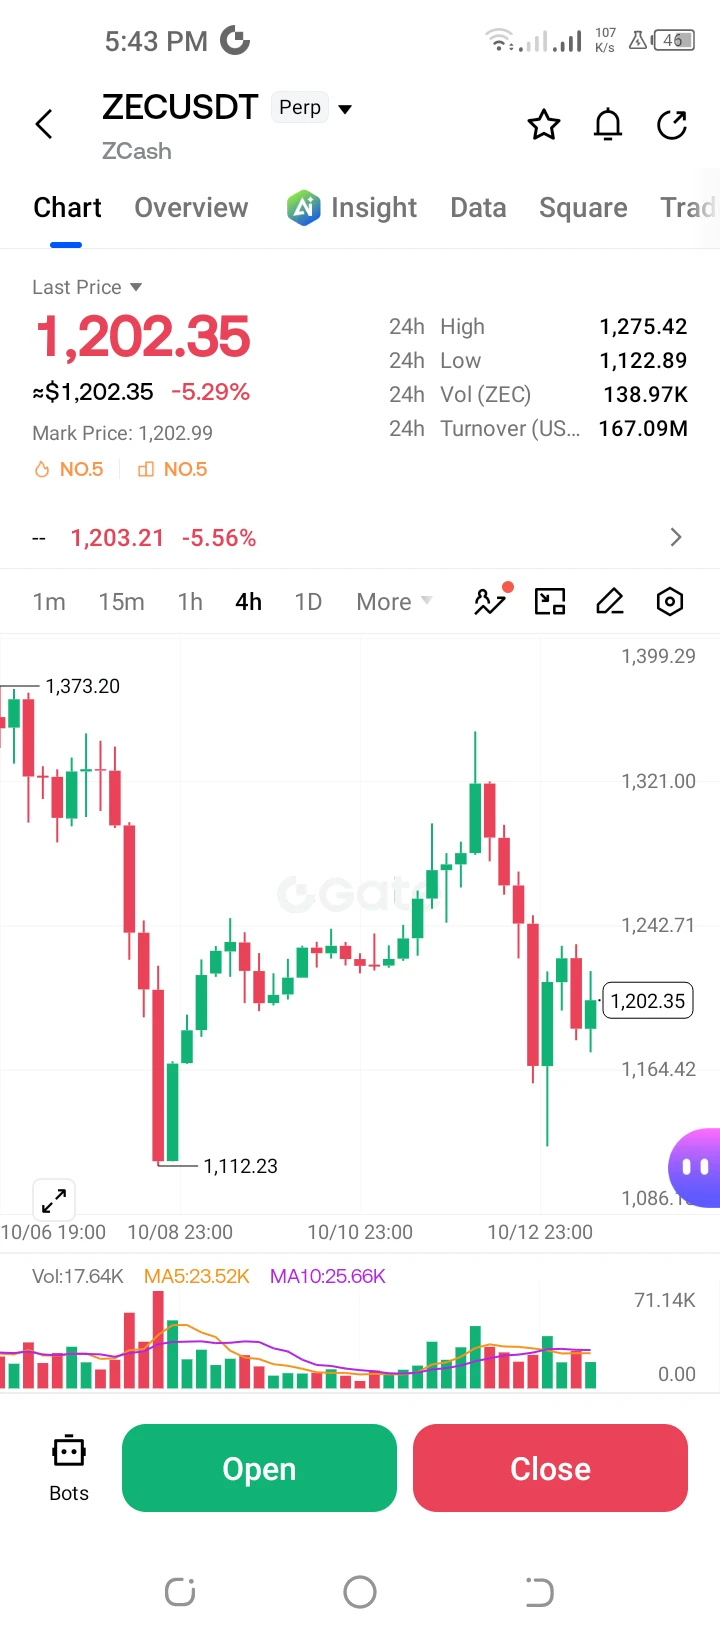
$ZEC /USDT - LONG

Trade Plan:
Entry: 1468.35 – 1481.27
SL: 1412.84
TP1: 1521.29
TP2: 1552.28
TP3: 1598.76

Why this setup?
Why now? The daily trend is bullish, the 1h price sits at 1474.81, and the 15m RSI is 46.96, meaning momentum is neutral but leaning long. The 1h ATR of 25.82232 shows volatility is compressed enough for a sharp expansion once the entry zone around 1474.81 triggers. The target TP1 at 1521.29 and TP2 at 1552.28 align with the bullish structure, while the invalidation level at 1281.45 is the absolute line in
ZEC-5.31%
Which Stage of Trading Are You In?
Stage One: Relying on Courage to Gamble
Blindly taking oversized positions, chasing rallies and selling into declines, and focusing solely on getting rich quickly without understanding that “haste makes waste.” The account swings wildly, with risk always lurking.
Stage Two: Obsessing Over Techniques
Studying all kinds of technical indicators and fixating on finding a foolproof way to profit. Eventually realizing that nothing in the market is absolute, and that technical analysis is merely a tool for improving probabilities.
Stage Three: Establishing a Framewo
Why everyone calling SUI a range-bound failure might be about to get proven wrong.

$SUI /USDT - SHORT

Trade Plan:
Entry: 0.8627 – 0.8705
SL: 0.9154
TP1: 0.8300
TP2: 0.8056
TP3: 0.7689

Why this setup?
Why now? The 1D trend has been a range, but the 1h price sitting at 0.8666 is already inside the entry zone of 0.8627 to 0.8705, which means the short setup is live immediately. The 15m RSI reading of 54.65 shows neutral momentum, not a strong reversal, so the 1h ATR of 0.015652 gives enough room for the first TP1 target of 0.8300 without a wild squeeze. If that leg completes, the measured m
SUI+4.71%
The official npm registry is down just as I was preparing to register with the official npm registry and publish a package 😤
morning update 🥰🌹
live-cover
LIVE1,719
Financial News, Crypto Market Updates, Real-World Strategies
live-cover
LIVE993

This move surged from around 2480 all the way to 2672, setting sentiment ablaze,
but it has clearly started to lose steam after the spike.
Now around 2631, the price is stuck below the Bollinger midline at 2638,
with 2652 as the first resistance above and 2672 as strong resistance at the previous high.
I’m not in a rush to chase longs.
2623 is the key defense line. As long as it holds, a pullback looks more like a shakeout,
and only a reclaim of 2638 would create an opportunity to continue toward 2652 or even 2672.
But if 2623 breaks on heavy volume, don’t stubbornly hold on; focus on 2610 and
ETH+0.72%
would never dare to call a top on ZEC because the homies are all making money
just noting the log 1.618 and muting the thread.
post-image
ZEC-5.18%
9. Intraday strategy for the 20th: Repeated price pumps, whale distribution, turning point reached, grid shorting at high levels
The bullish thesis has now been priced in. Technically, a high-level upper wick has appeared, and the 60-period 15-minute intraday moving average has been broken below—the turning point from bullish to bearish has arrived!
Why hasn’t the market fallen yet? Because the market is currently in a high-level, low-volume consolidation. Institutions and whales need time to cash out their holdings, and the 19th was also a weekend day with low trading volume, so the entire da
ETH+0.72%
  • 1
Load More

Join 40 M users in our growing community

⚡️ Join 40 M users in the crypto craze discussion

💬 Engage with your favorite top creators

👍 See what interests you

Trending Topics

JapanRealEstatePowerChipStocksRise

59.83k Views4.55k Discussing

Japan's Nikkei extended gains on Sept 18, with real estate, power, and semiconductor sectors leading. Gate covers over 12,800 global stocks and ETFs, offering one-stop USDT trading across US, HK, Korean, and Japanese markets. [👉 Read more](https://www.odaily.news/en/newsflash/518749)

USAIConceptStocksRally

34.51k Views1.01k Discussing

GateTopsStockPerpetualCoverage

38.91k Views2.61k Discussing

View More