Share your thoughts
placeholder
Article
U.S. stocks, gold, the U.S. dollar, U.S. Treasuries, and assets such as BTC and ETH
live-cover
LIVE1,242
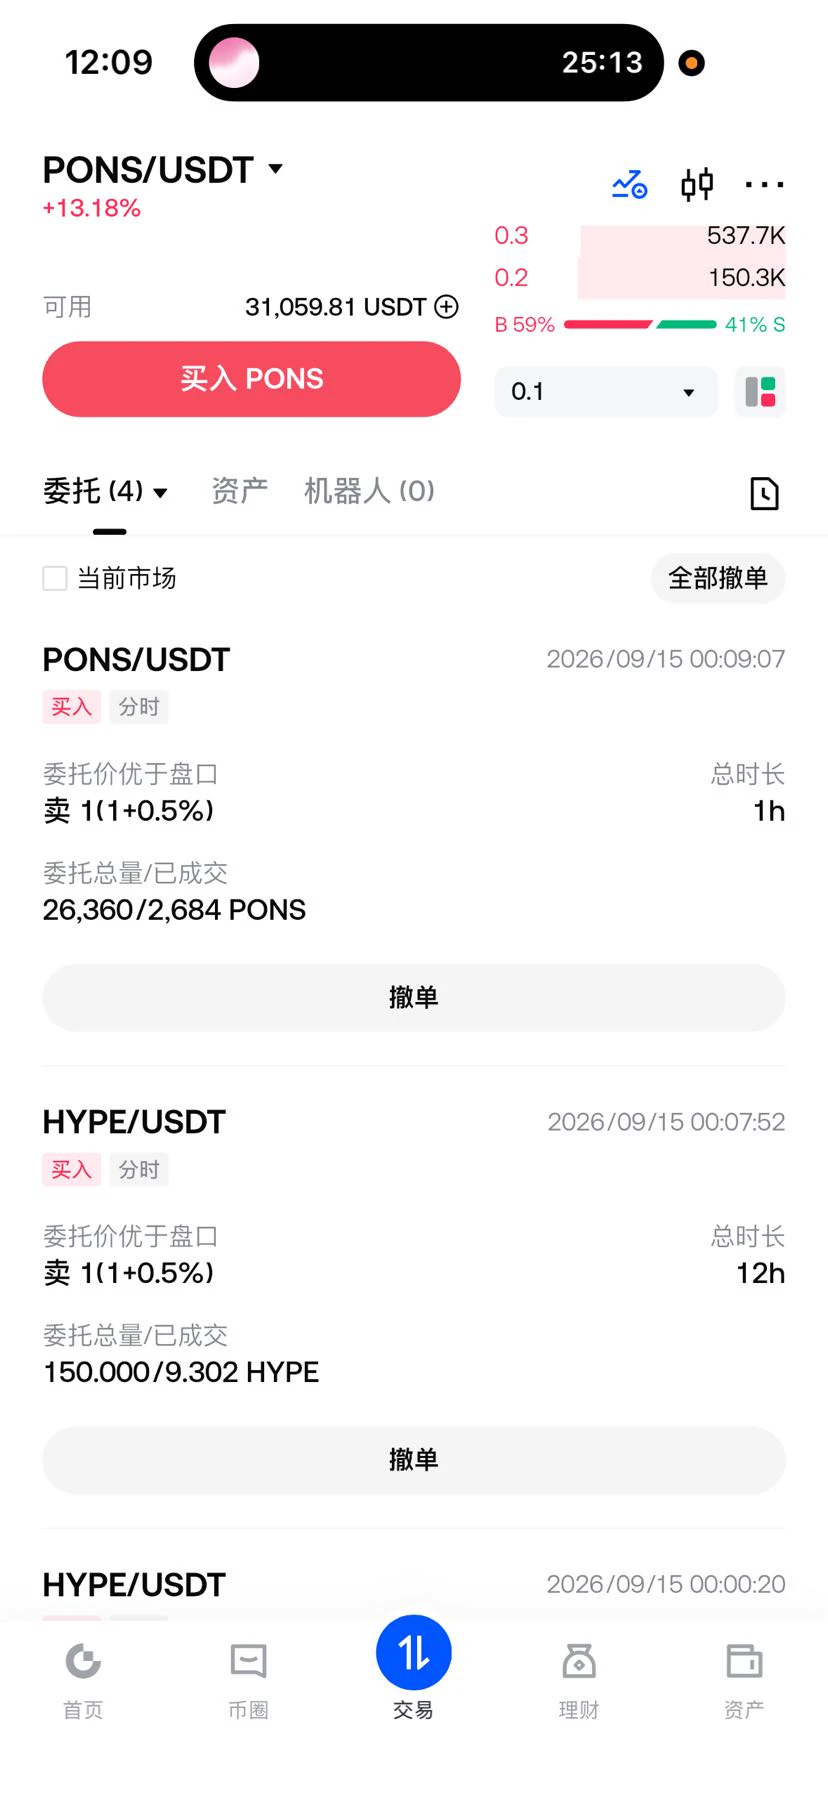
$PONS entered at a pretty good time and has started making money.
SleepScientist
Betting on the Clarity Act passing, I entered a little first $HYPE . Feels like the $PONS pullback sentiment is almost over, so I bought a bit more. Kept one-third of my funds to wait and see whether the rate hike causes any volatility.
repost-content-media
PONS+8.45%
  • 3
  • 1
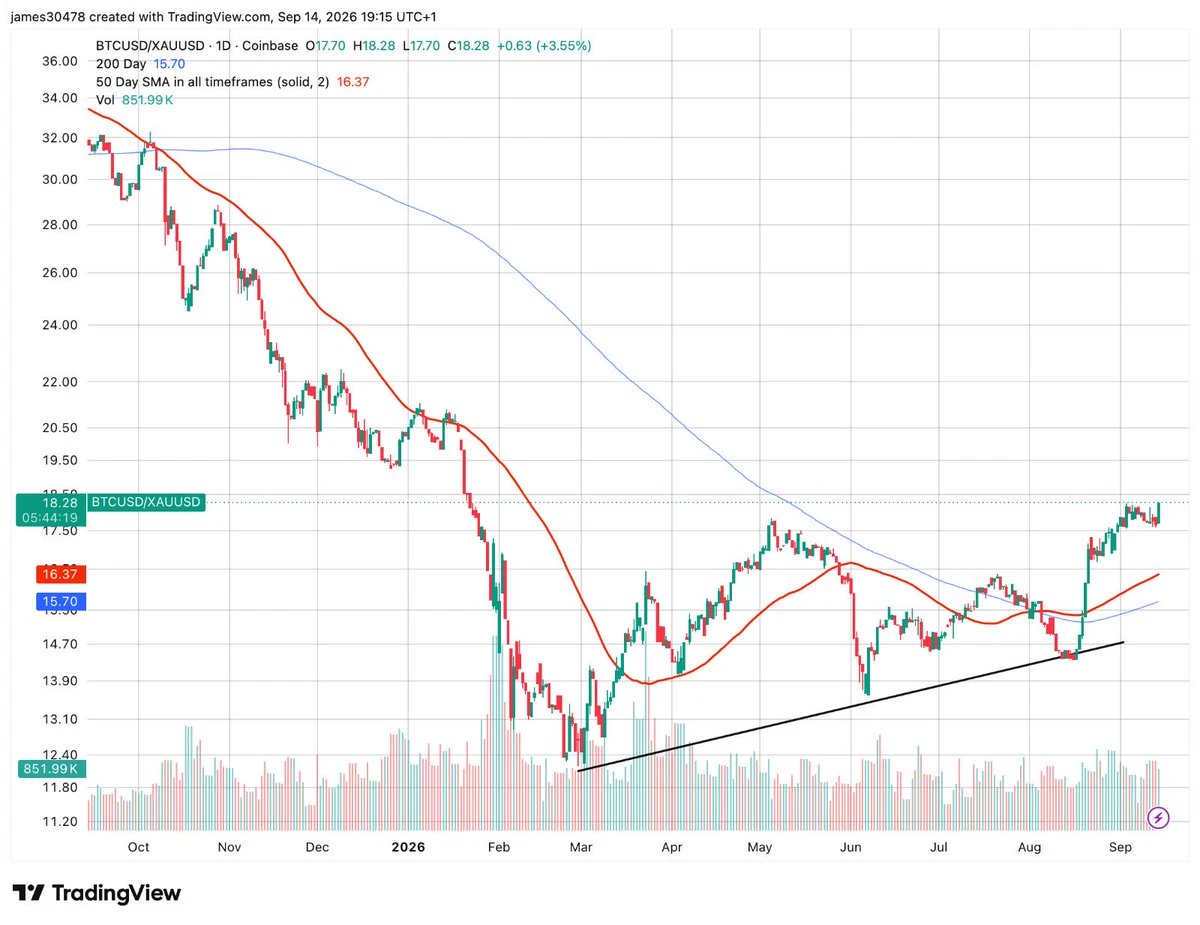
Bitcoin making 8 month highs against gold on a risk-off day
post-image
BTC+2.40%
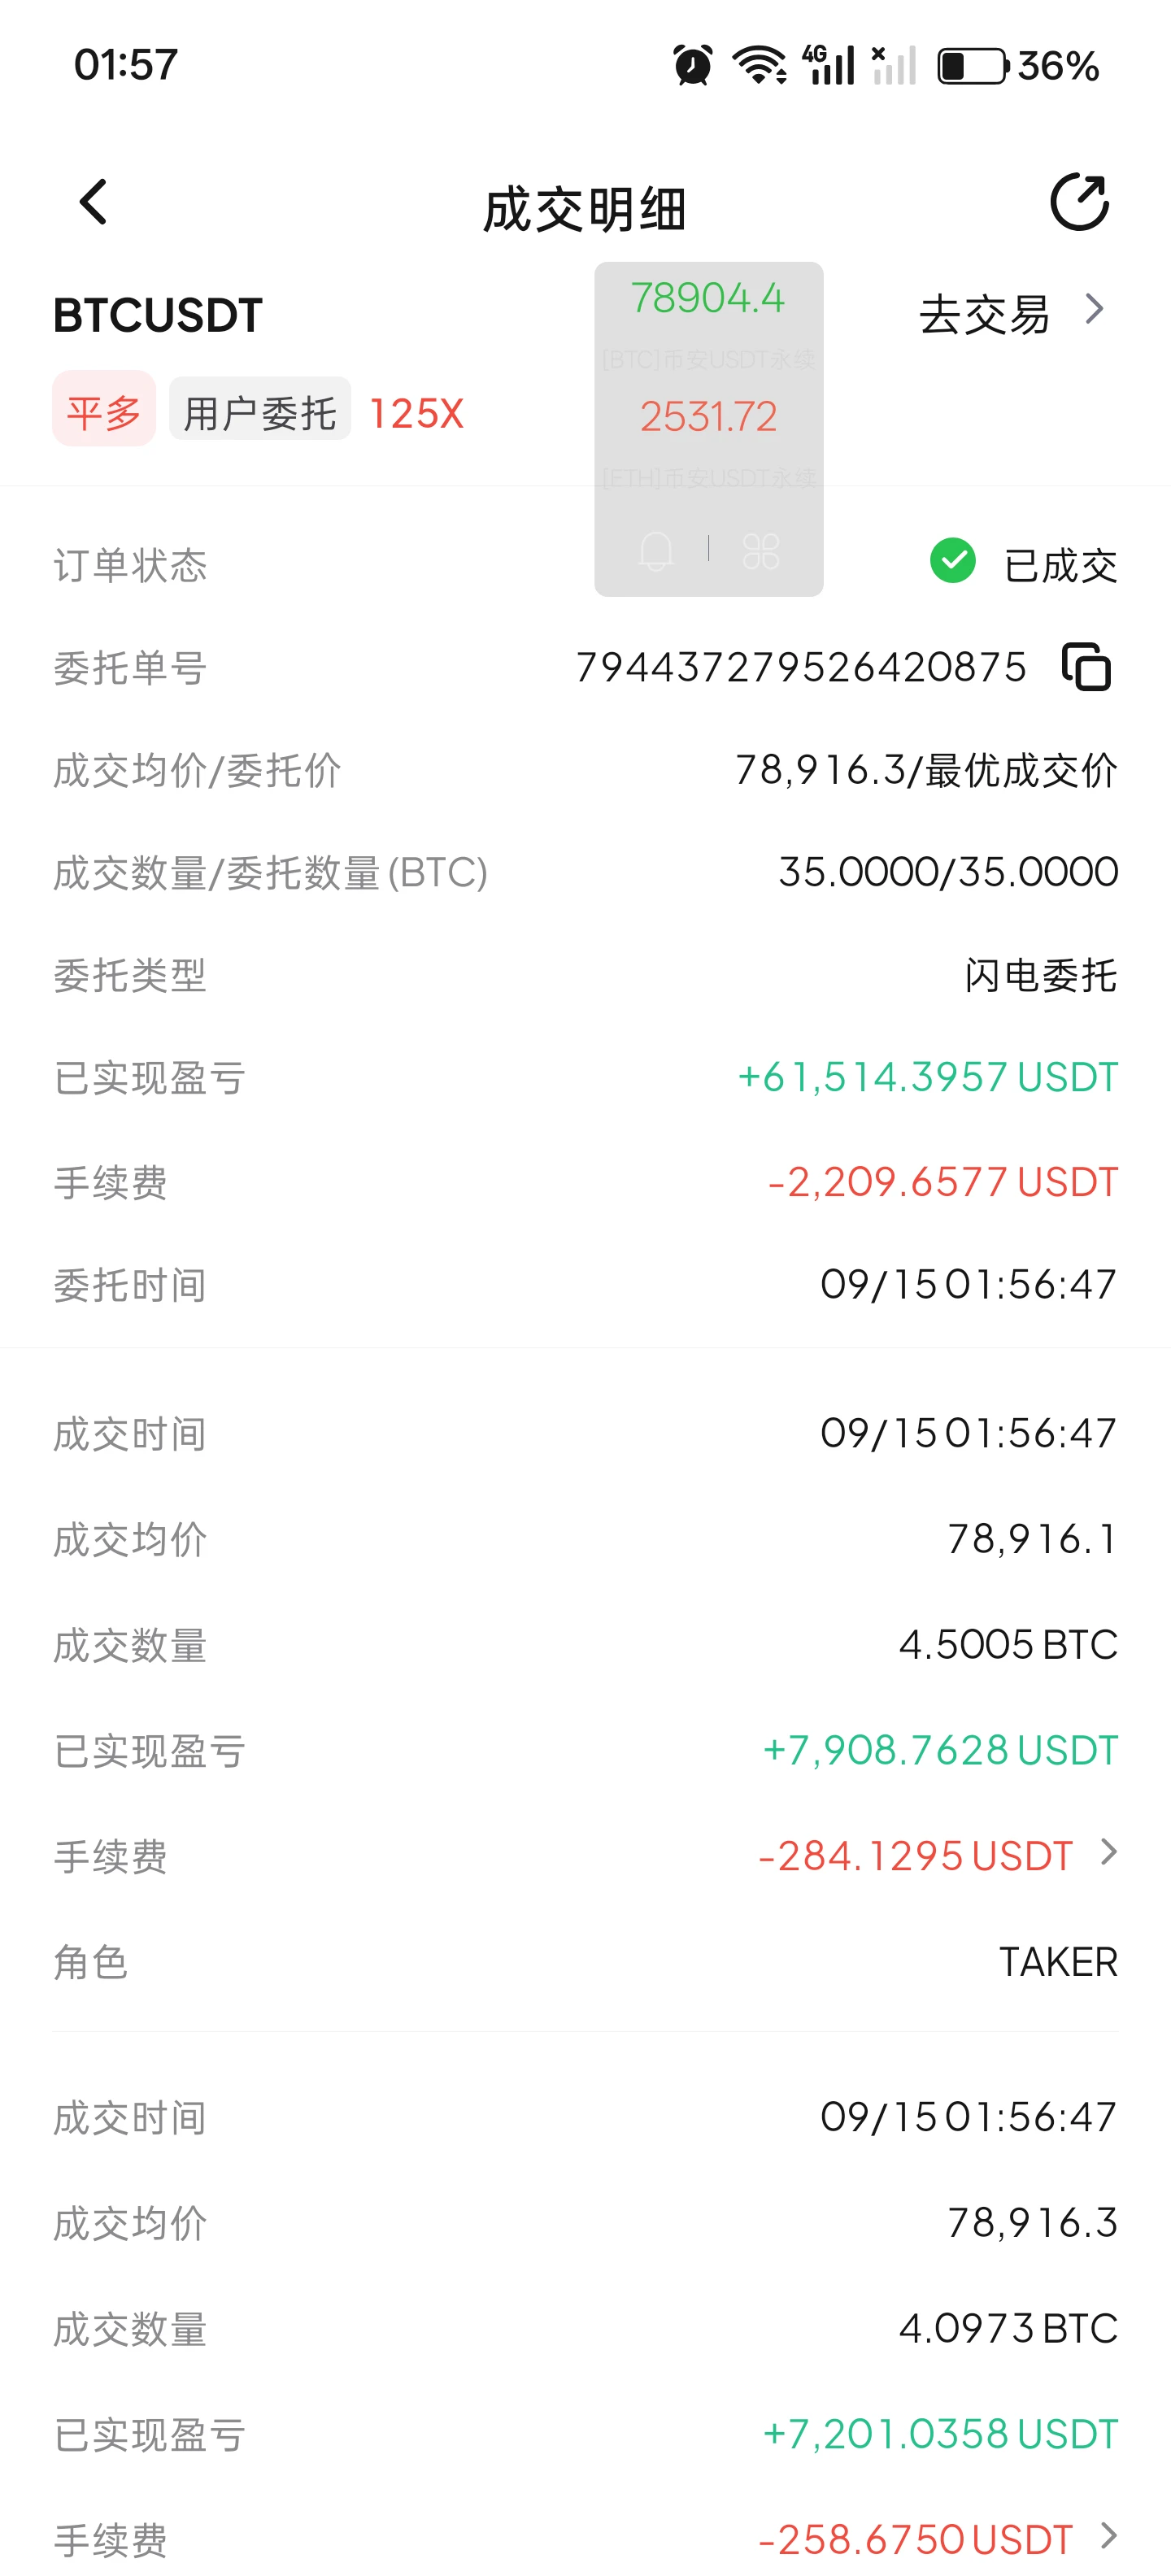
I’ll take a small position first, prioritizing stability! You can continue watching for short opportunities at 79300 and 80800.
post-image
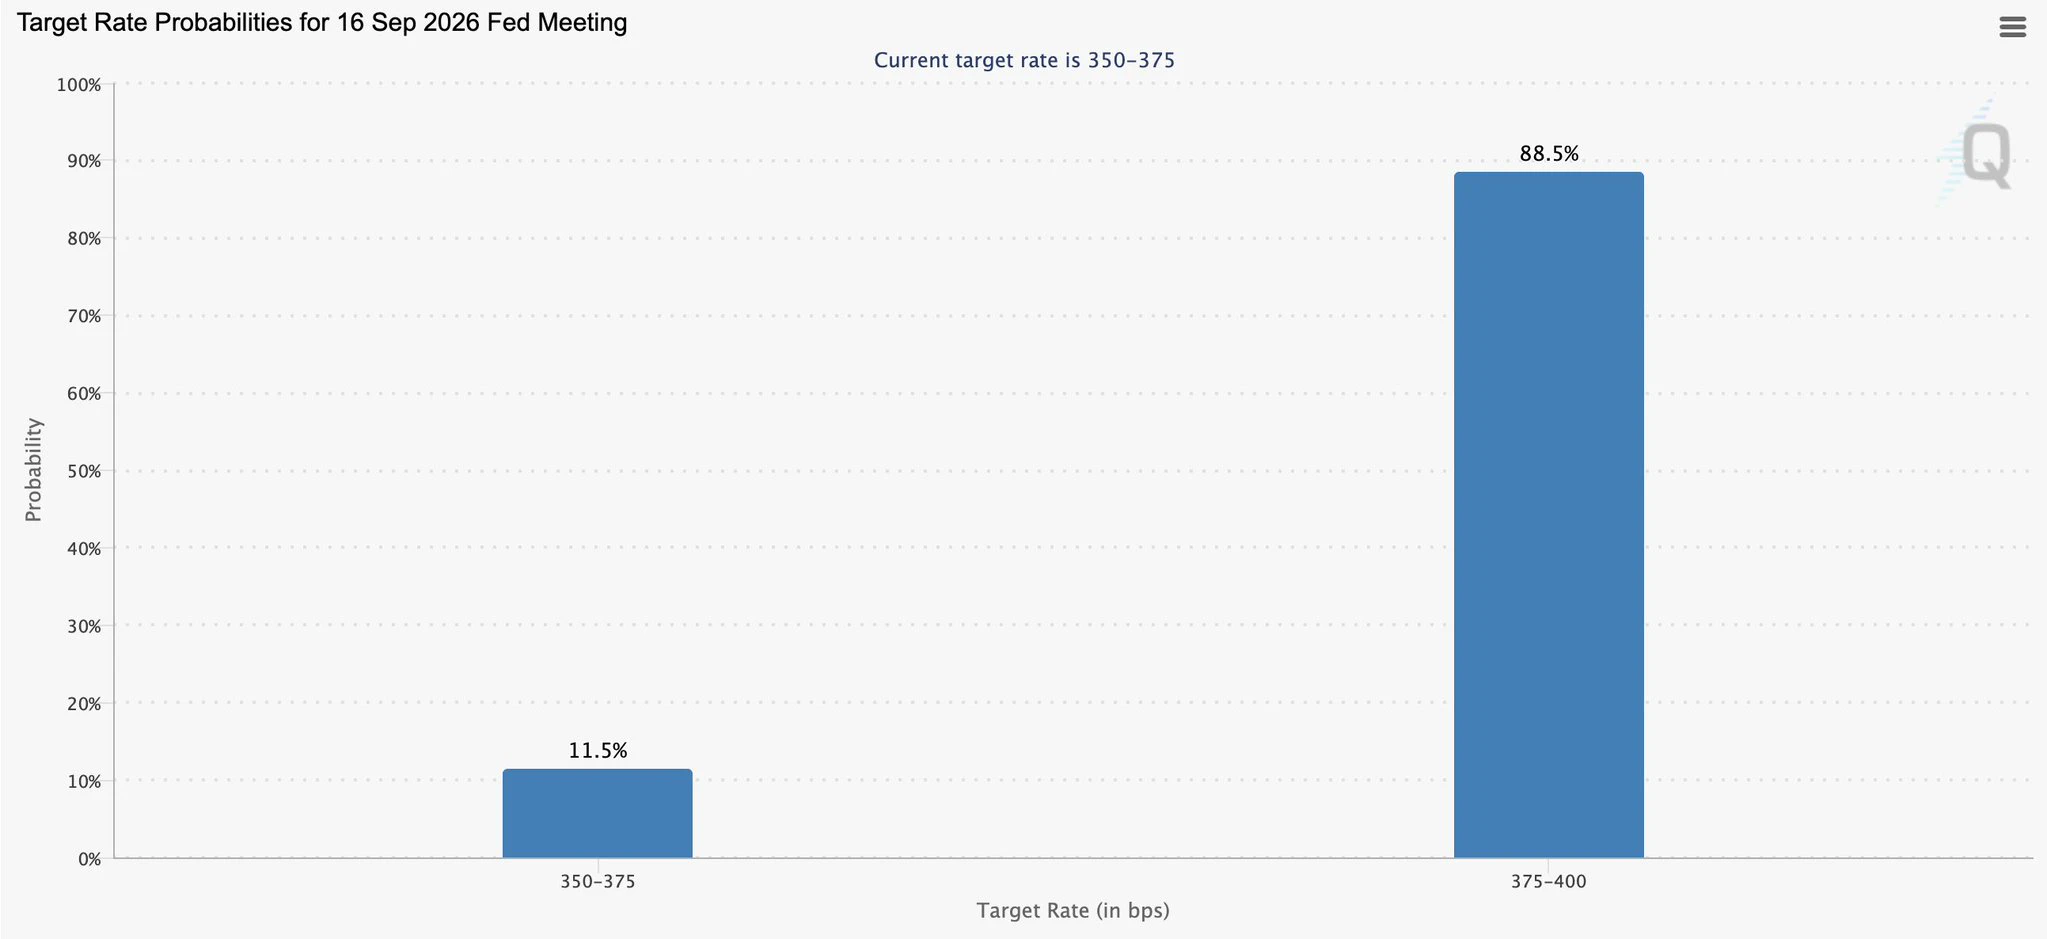
Market pricing 88.5% chance the Fed CUTS rates in 2 days.
First cut after a long pause = liquidity coming back.
Good for Bitcoin & risk assets.
Send it. $BTC
#GateTopsGlobalGrowth #GateUSExpandsTo37StateLicenses #GateTopsGlobalGrowth
post-image
BTC+2.40%
  • 3
  • 1
[New Streamer] Market Prediction
live-cover
LIVE41
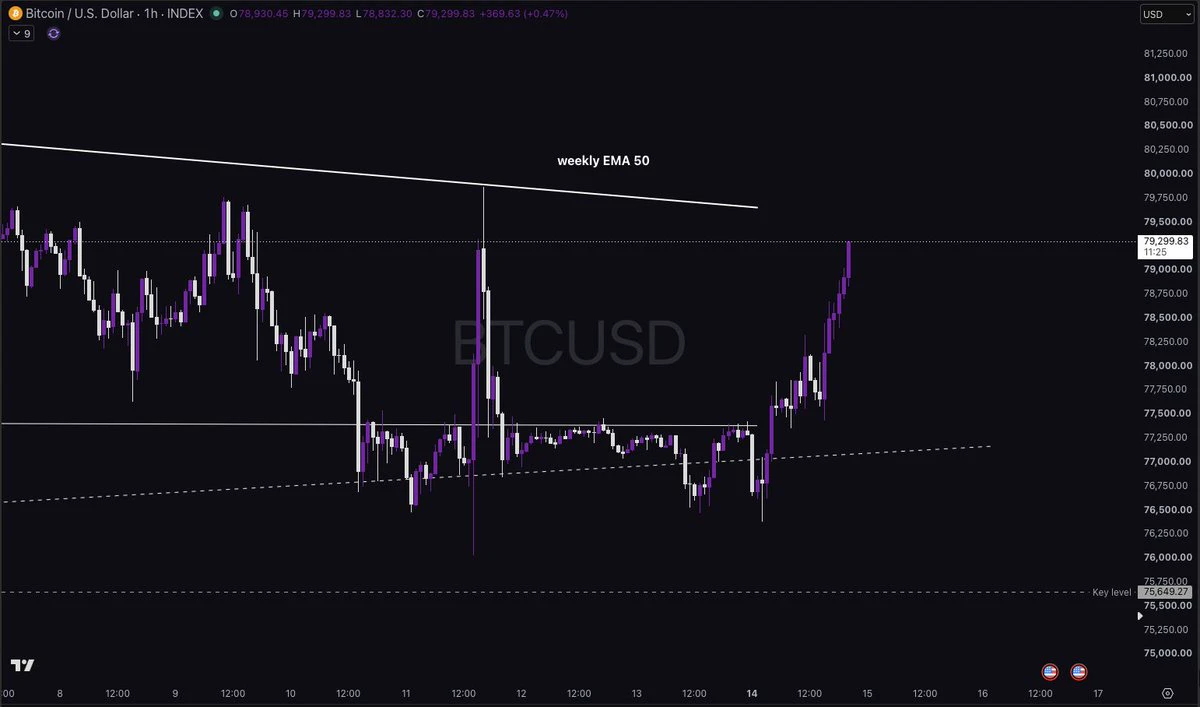
Bitcoin going for another test of the weekly EMA 50 👀
post-image
BTC+2.40%
“You can’t be unlucky for 365 days.”
Crypto traders: “Watch me.” 💀😂
One day you’re up 30%, the next day the market takes it all back.
Stop loss hit. Liquidation avoided. Trade reversed.
But somehow… we’re still here. 😭📉📈
The real skill in crypto isn’t winning every trade — it’s surviving long enough to catch the next one.
Who else can relate? 😂👇
#CryptoTraders #CryptoTrading #TraderLife
post-image
#RobinhoodChainRevenueFallsFor5ConsecutiveDays
I’m watching this Robinhood Chain number closely — because at first glance, it looks much worse than the underlying activity actually is.
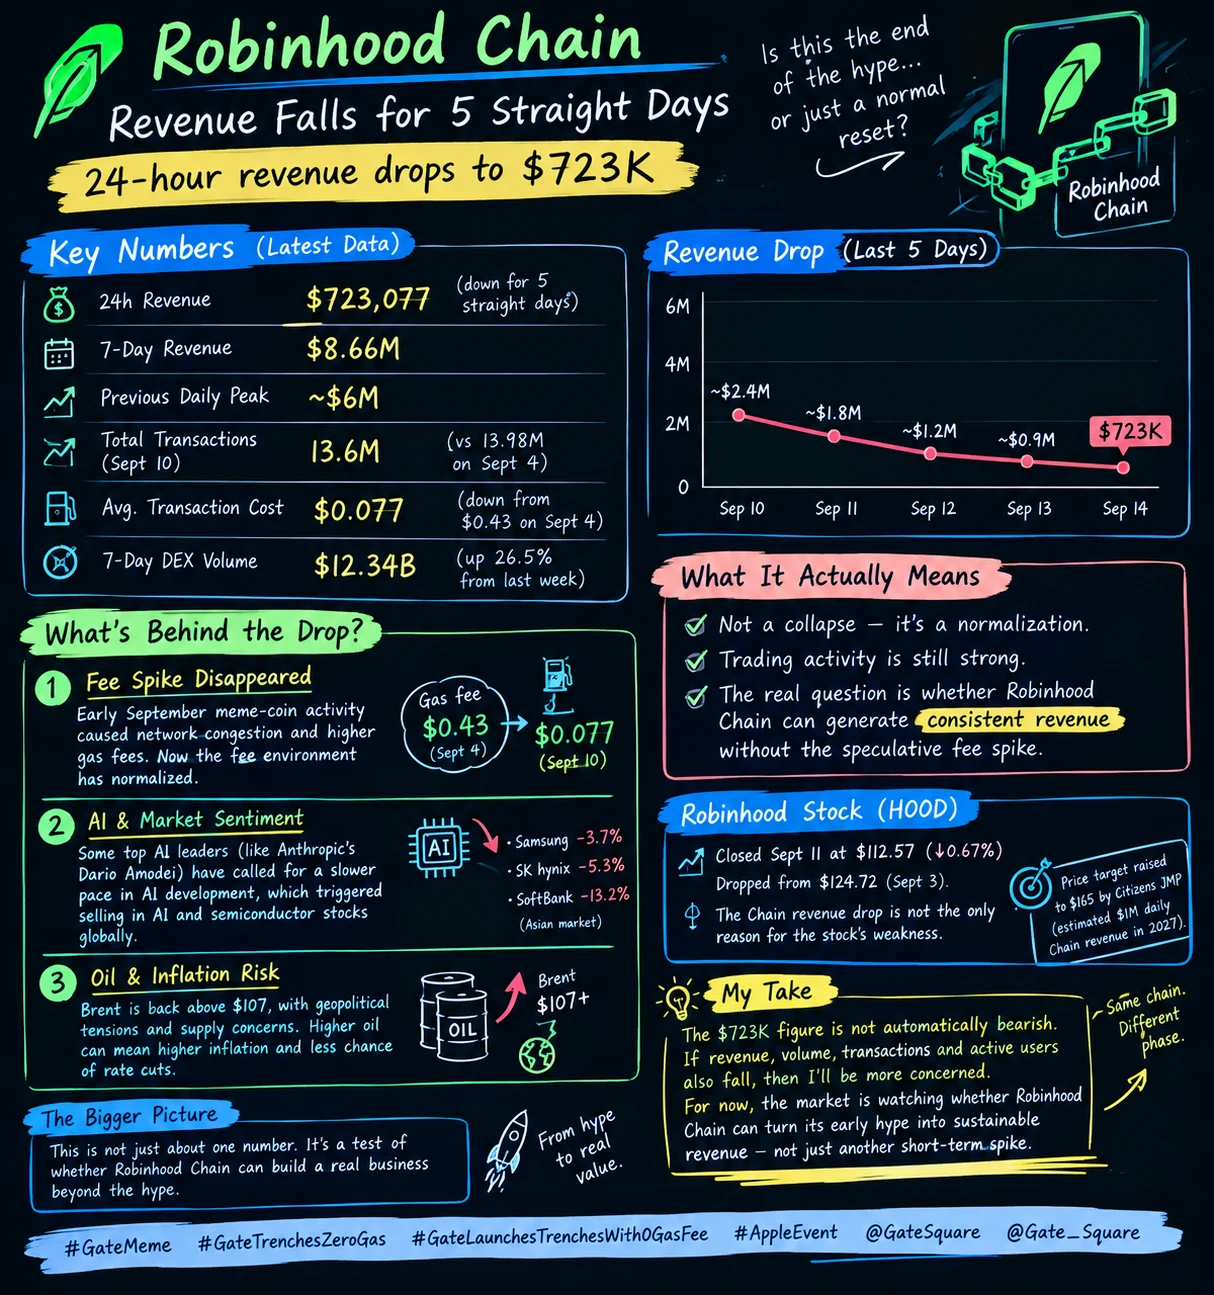
Robinhood Chain revenue has now fallen for five consecutive days, reaching just $723,077 over the latest 24-hour period. That puts revenue below $1 million for the fourth consecutive day. Over the last seven days, the chain generated about $8.66 million, while its previous daily peak was around $6 million.
That is a massive change from the beginning of September.
But here is the part I think traders should
MrFlower_XingChen
#RobinhoodChainRevenueFallsFor5ConsecutiveDays
I’m watching this Robinhood Chain number closely — because at first glance, it looks much worse than the underlying activity actually is.
Robinhood Chain revenue has now fallen for five consecutive days, reaching just $723,077 over the latest 24-hour period. That puts revenue below $1 million for the fourth consecutive day. Over the last seven days, the chain generated about $8.66 million, while its previous daily peak was around $6 million.
That is a massive change from the beginning of September.
But here is the part I think traders should not miss:
Revenue is falling much faster than network activity.
Earlier data showed Robinhood Chain generating about $5.44 million in gas revenue on September 4. By September 10, that had fallen to $943,728 — an 82.6% decline from the peak. Yet the network processed roughly 13.6 million transactions on September 10 versus 13.98 million on September 4, only around a 3% difference.
So what actually happened?
The fee spike disappeared.
Robinhood Chain is an Ethereum Layer-2 network built using Arbitrum technology, and its revenue is strongly influenced by the amount users pay for blockspace.
During the early-September meme-coin activity, the network became much more congested and transaction costs increased dramatically.
The average transaction cost reached around $0.43 at the September 4 peak.
By September 10, it had dropped to approximately $0.077.
That means the chain can still process millions of transactions while generating considerably less revenue from each transaction.
And there is another number that makes the situation even more interesting.
Despite the revenue decline, seven-day DEX volume reached approximately $12.34 billion through September 10, up 26.5% from the previous week.
So I don't read the current data as:
“Nobody is using Robinhood Chain anymore.”
I read it as:
“The extraordinary fee environment has cooled down.”
That is a very different story.
But there is still a risk
Robinhood Chain launched its mainnet on July 1, and the network has attracted huge attention because of tokenized stocks, DeFi and meme-coin activity.
According to company operating data, Robinhood's broader crypto trading volume also increased 61% month-over-month in August to $17.5 billion, although that was still 38% below August 2025's $28.1 billion.
Robinhood's own August operating report also says Chain revenue is shared with launch partners, with Robinhood retaining 50% of sequencer revenue until approximately $50 million, then 70% until approximately $150 million, and 85% above that level.
That matters because the market is not just watching whether Robinhood Chain can generate huge headline revenue for a few days.
Investors ultimately want to know:
Can the network generate durable revenue when the speculative fee spike disappears?
What about Robinhood's stock price?
This is where I would be careful.
HOOD closed September 11 at $112.57, down 0.67% that day, after falling from $124.72 on September 3.
But I would not say the $723K Chain-revenue figure directly caused HOOD to fall.
There are too many moving parts in Robinhood's valuation.
In fact, the market has recently received positive news around the Chain as well. Citizens JMP raised its Robinhood price target to $165 from $155, estimating the Chain could eventually contribute around $1 million of net revenue per day in its 2027 forecasts.
So the current price weakness looks more complicated than one revenue number.
My opinion
Personally, I don't think the $723K figure is automatically bearish for Robinhood Chain.
What would concern me is something different:
If revenue keeps falling and DEX volume, transactions, active users and liquidity start falling together, then I would consider that a much stronger warning.
Right now, the data doesn't show that.
Revenue has collapsed from the September peak, but trading activity has remained surprisingly strong.
That tells me the first question is not:
“Why did Robinhood Chain revenue crash?”
It is:
“Can Robinhood Chain maintain meaningful economic activity after the fee market normalizes?”
That is the real test.
The September spike proved that the network can generate enormous revenue when activity and gas demand explode.
Now the market gets to see whether it can build something more important:
consistent revenue without needing another speculative frenzy.
For me, that's the metric worth watching next.
Volume can attract attention.
Transactions can create activity.
But sustainable revenue is what ultimately builds a business.
And Robinhood Chain is entering that test right now.
Market analysis only — not financial advice.
#GateMeme #GateTrenchesZeroGas #AppleEvent @GateSquare @Gate_Square
repost-content-media
🚨 LATEST: BitFuFu led Bitcoin miner production growth in August, boosting output 55% to 174 $BTC.
CleanSpark edged higher to 593 BTC, while Canaan slipped again to 44 BTC.
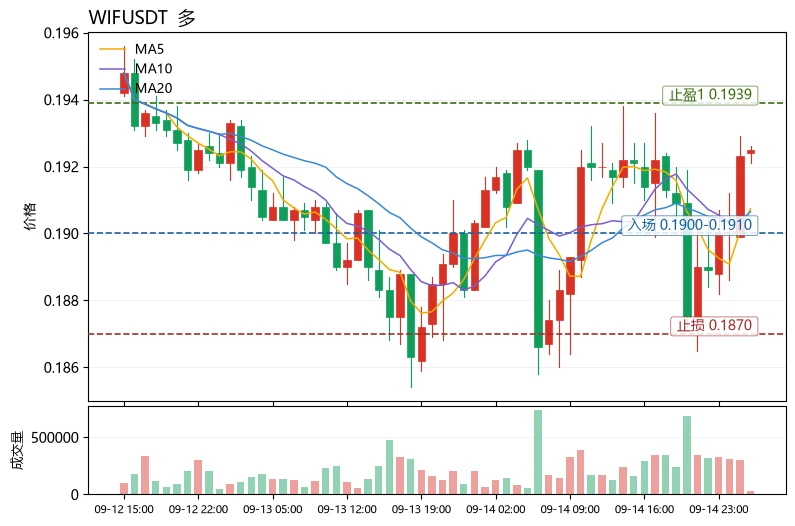
$WIF Current price 0.1925; resistance above at the Bollinger upper band 0.1939, and support below at the Bollinger lower band 0.1873.
The funding picture is bullish: the funding rate is +0.0050%, with longs paying, but sentiment is only Greed 57 and not overheated; MA5 has crossed above MA20, the MACD histogram has turned positive, and RSI 57.2 is neutral to bullish, indicating that short-term funds are on the long side. Liquidation and wick risk are concentrated above 0.1939, so chasing the rise could easily get swept.
Direction: bullish. Entry: 0.1900–0.1910 (near MA5 support); take-profit
post-image
WIF+0.94%
AMP-0.44%
Today, it feels like BTC should be able to break $80k. The upward trend is already very clear. I really don’t understand why some people are still so stubbornly shorting and recklessly holding losing positions. My 10+ years of experience tells you that holding a losing position has only one outcome: liquidation! Cutting losses in time and decisively turning around to go long is the right path! My goal of turning 10U into 100kU is not far ahead.
BTC+2.38%
#GateSquareMidAutumnReunion
🍎 One of the world’s most powerful brands is about to put its newest products into customers’ hands — and for me, the real story starts on Friday.
Apple’s iPhone 18 Pro and iPhone 18 Pro Max officially go on sale on September 18. Pre-orders have already started, and this product cycle also brings new Apple Watch and AirPods models.
But honestly, I’m not interested in Apple simply because another iPhone is launching. Apple does this every year.
What makes this launch interesting to me is the question behind it:
How strong is the real demand?
The iPhone 18 Pro start
MrFlower_XingChen
#GateSquareMidAutumnReunion
🍎 One of the world’s most powerful brands is about to put its newest products into customers’ hands — and for me, the real story starts on Friday.
Apple’s iPhone 18 Pro and iPhone 18 Pro Max officially go on sale on September 18. Pre-orders have already started, and this product cycle also brings new Apple Watch and AirPods models.
But honestly, I’m not interested in Apple simply because another iPhone is launching. Apple does this every year.
What makes this launch interesting to me is the question behind it:
How strong is the real demand?
The iPhone 18 Pro starts at $1,199, while the Pro Max starts at $1,299. Apple has upgraded the lineup with its A20 Pro chip, a new camera system, variable-aperture main camera technology and battery improvements.
But as a trader, I don't make a decision just because the specifications look impressive.
I want to see whether people are actually willing to pay the higher price and upgrade.
That is where the real market signal will come from.
If demand remains strong after launch, delivery times stay tight, early sales beat expectations and investors start raising their estimates for Apple's future revenue, then the story becomes much bigger than a successful product launch.
It could become a fresh reason for the market to reprice AAPL.
But there is another side to this.
Apple is already one of the most heavily followed companies in the world, which means expectations are high before the first customer even walks into a store.
And this is something I’ve learned from trading:
Good news does not automatically mean a good trade.
If the market has already priced in excellent sales, even strong numbers can produce a disappointing reaction.
That is why I will be watching the market’s reaction more closely than the headlines.
Apple has also made a much bigger strategic move this time by introducing its first foldable iPhone, the iPhone Duo.
The device starts at $1,999 and is scheduled to go on sale October 23.
For me, this is more important than it might look at first.
Apple is entering a category where other manufacturers have already spent years experimenting with foldable hardware.
But Apple has a huge ecosystem and an enormous installed customer base.
If the company can make foldables feel practical enough for mainstream consumers, this could eventually create another premium upgrade cycle.
At the same time, I’m paying attention to Apple's AI strategy.
Smartphones are no longer competing only on cameras, processors and battery life.
AI is becoming part of the reason consumers consider upgrading.
Apple is pushing new AI capabilities into its latest hardware, and if those features become genuinely useful in everyday use, they could help Apple convince existing users that upgrading is worth the money.
But again, I don't want to confuse a good product with a guaranteed stock rally.
Those are two completely different things.
My approach is simple.
I want to watch price action, volume, demand and expectations together.
If AAPL breaks an important resistance level with strong volume after the launch and the market receives the sales data positively, that would give me more confidence in a continuation move.
If the stock spikes on launch excitement but volume fades and price falls back below resistance, I would rather wait than chase it.
And if Apple reports strong demand but the stock still sells off, I would pay even more attention.
Why?
Because that could mean investors were expecting even more.
This is one of the biggest lessons I’ve learned from markets:
The market doesn't trade what happened. It trades the difference between what happened and what was expected.
That is why Friday matters.
I'm not just watching how many people talk about the new iPhone.
I'm watching whether actual demand can justify the expectations already built into Apple's valuation.
There is also another layer to this launch.
This is the first major product cycle under John Ternus as Apple CEO, following Tim Cook's departure from the CEO role earlier this month. The company is simultaneously pushing its iPhone business, expanding into foldables and trying to make AI a more important part of its hardware strategy.
So I don't see this as just another annual iPhone refresh.
I see it as an early test of Apple's next chapter.
My personal strategy is therefore not to buy Apple simply because the launch looks impressive.
I want confirmation.
Strong demand + positive market reaction + expanding volume would make me more interested in the bullish side.
Weak demand + disappointing expectations + heavy selling would tell me to stay cautious.
And if the stock stays stuck in a range, I have no problem waiting.
There is no reward for forcing a trade when the market hasn't shown its direction yet.
For me, the most important numbers over the next few weeks won't be the number of launch-day posts on social media.
I'll be watching actual sales, delivery times, customer demand, analyst estimates, margins and Apple's forward guidance.
Those numbers will tell us much more about the future than the launch event itself.
Apple has the brand.
Apple has the ecosystem.
Apple has millions of loyal customers.
Now the question is whether this new product cycle can turn that strength into another meaningful growth phase.
**The product launch is Friday.
The market test comes after.**
And personally, I would rather follow the data than trade the hype.
#GateMeme #GateTrenchesZeroGas #GateLaunchesTrenchesWith0GasFee #AppleEvent @GateSquare @Gate_Square
$AAPL
repost-content-media
AAPL+0.65%
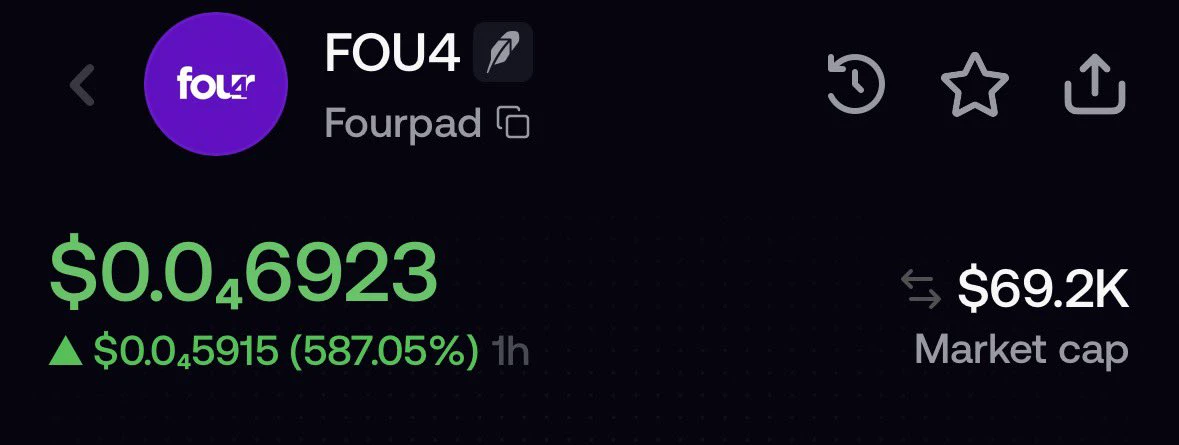
What a narrative.
$FOU4
bidded a lil send to $1M
post-image
SEND+4.65%
Smart money is already fading $H /USDT while retail still chases the highs.

$H /USDT - SHORT

Trade Plan:
Entry: 0.08175 – 0.08267
SL: 0.08660
TP1: 0.07892
TP2: 0.07672
TP3: 0.07343

Why this setup?
Why now? The daily trend is bearish, the 1h price sits at 0.08221, and the 15m RSI is 31.24, meaning momentum has already collapsed into oversold territory on a shorter timeframe. The 1h ATR of 0.00183 shows that a single hour can move nearly 0.002, so the entry zone between 0.08175 and 0.08267 is tight enough to catch a sharp continuation. The first target at 0.07892 and the second at 0.07672
H-4.50%
  • 1
#Gate24HFuturesOpenInterestTops$11.479B
Gate’s Futures Market Shows Strong Momentum as 24H Open Interest Reaches a Major Level
The crypto derivatives market continues to evolve rapidly, and the latest attention around #Gate24HFuturesOpenInterestTops highlights the growing importance of Gate’s futures ecosystem. A strong level of 24-hour Futures Open Interest signals that a significant amount of capital remains committed to active derivatives positions, reflecting substantial participation from traders.
For the crypto community, this is an important market indicator because Open Interest provi
Over the past year, I've kept the idea that Bitcoin won't enter a new bull market until BTC.D goes back under 40% to 30%, hovering and bouncing in this area from 100k extending towards a shallow ATH, down to 50k, up and down for several years while altcoins go through their altcoin season phases, as everyone is too focused on catching a bottom for Bitcoin, we can see the same playbook we saw back then with gold when gold remained relatively neutral to bearish, not breaking down but not breaking out either and software assets outperformed gold. Then, when gold made its new ATH, we entered anoth
BTC+2.40%
ETH+1.21%
XAUUSD-1.20%
Load More

Join 40 M users in our growing community

⚡️ Join 40 M users in the crypto craze discussion

💬 Engage with your favorite top creators

👍 See what interests you

Trending Topics

GateTopsGlobalGrowth

24.17k Views528 Discussing

According to the latest CryptoQuant data, Gate's spot trading volume ranks top 3 globally, with the fastest growth worldwide, while futures trading volume growth also ranks top 3 globally. Market activity is accelerating back, and Gate's growth momentum continues to lead. Market heat is back — are you mainly trading spot or futures these days? [👉 Full report:](https://cryptoquant.com/insights/research/6aa7aaca26ed15760f9ca834)

GateUSExpandsTo37StateLicenses

22.31k Views326 Discussing

AnthropicPicksNasdaqForIPO

72.41k Views794 Discussing

View More