
Square
Following
Hot
News
Notifications
Profile
Share your thoughts
placeholder
Article
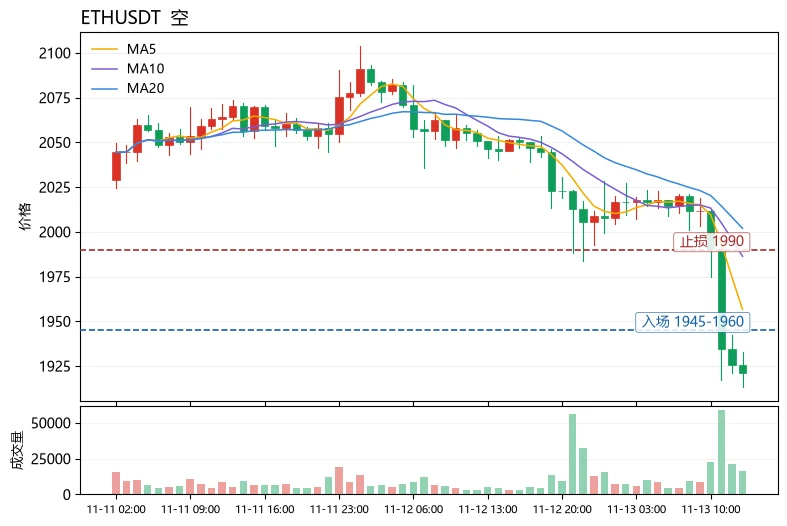
$ETH Current price: 1921.29, down 6.16% in 24h, with a trading volume of 689.3M USDT. The moving averages are bearishly aligned: MA5=1956.67 is below MA20=2001.91, and the price is trading below MA5; the MACD histogram at -9.05 maintains bearish momentum; RSI=14.0 has entered the extreme oversold zone; the lower Bollinger Band at 1935.99 has been broken, with the current price below it, indicating an oversold deviation; the funding rate remains positive at +0.0026%, keeping the cost of long positions high and creating pressure for forced liquidations; the Fear and Greed Index is 20, indicatin
post-image
ETH-1.26%
PEPE+0.97%
ERA+24.21%
Extremely intense$BTC $GT ‌$ETH ‌$NVDA ‌$AMD ‌ ‌
post-image
BTC-0.65%
GT-2.24%
ETH-1.23%
NVDA-4.49%
AMD+5.86%
  • 6
Trenches
mihao
m
bade
b
mihao
4Cxj...pump
Market Cap
$.
Change
.
24h Vol
$.
Holders
.
AGT
A
bade
b
AGT
0x5d...e274
Market Cap
$.
Change
.
24h Vol
$.
Holders
.
FOOD
F
bade
b
FOOD
FTu5...pump
Market Cap
$.
Change
.
24h Vol
$.
Holders
.
IDOL
I
bade
b
IDOL
0x3b...ab07
Market Cap
$.
Change
.
24h Vol
$.
Holders
.
AI
A
bade
b
AI
2T56...pump
Market Cap
$.
Change
.
24h Vol
$.
Holders
.
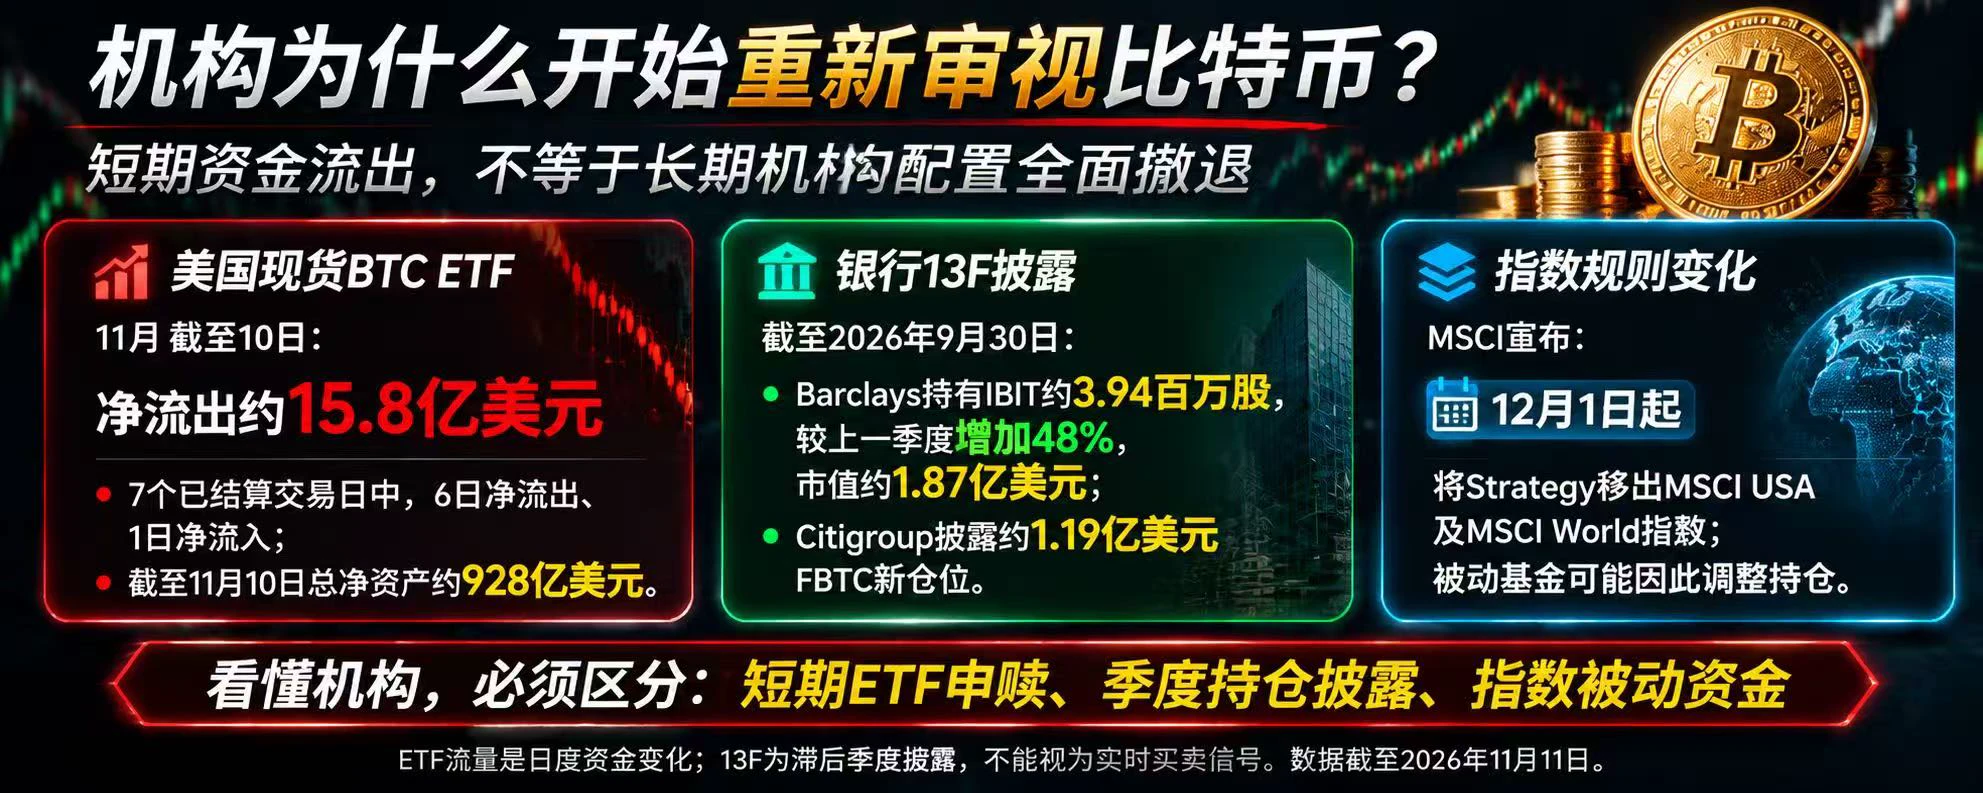
Why Are Institutions Starting to Reassess Bitcoin?

Recently, a contradiction in the Bitcoin market has emerged that merits closer examination: ETFs continue to see outflows, while large financial institutions have disclosed increases in Bitcoin-related holdings. What does this mean?

First, the flow data. As of November 10, 2026, U.S. spot Bitcoin ETFs had net outflows of about $1.58B so far this month, with net outflows on 6 of the 7 settled trading days. But this does not mean all institutions are retreating.

According to third-quarter 13F filings disclosed on November 11, Barclays increas
post-image
BTC-0.67%
BCS-1.33%
C-0.11%
MSCI-1.50%
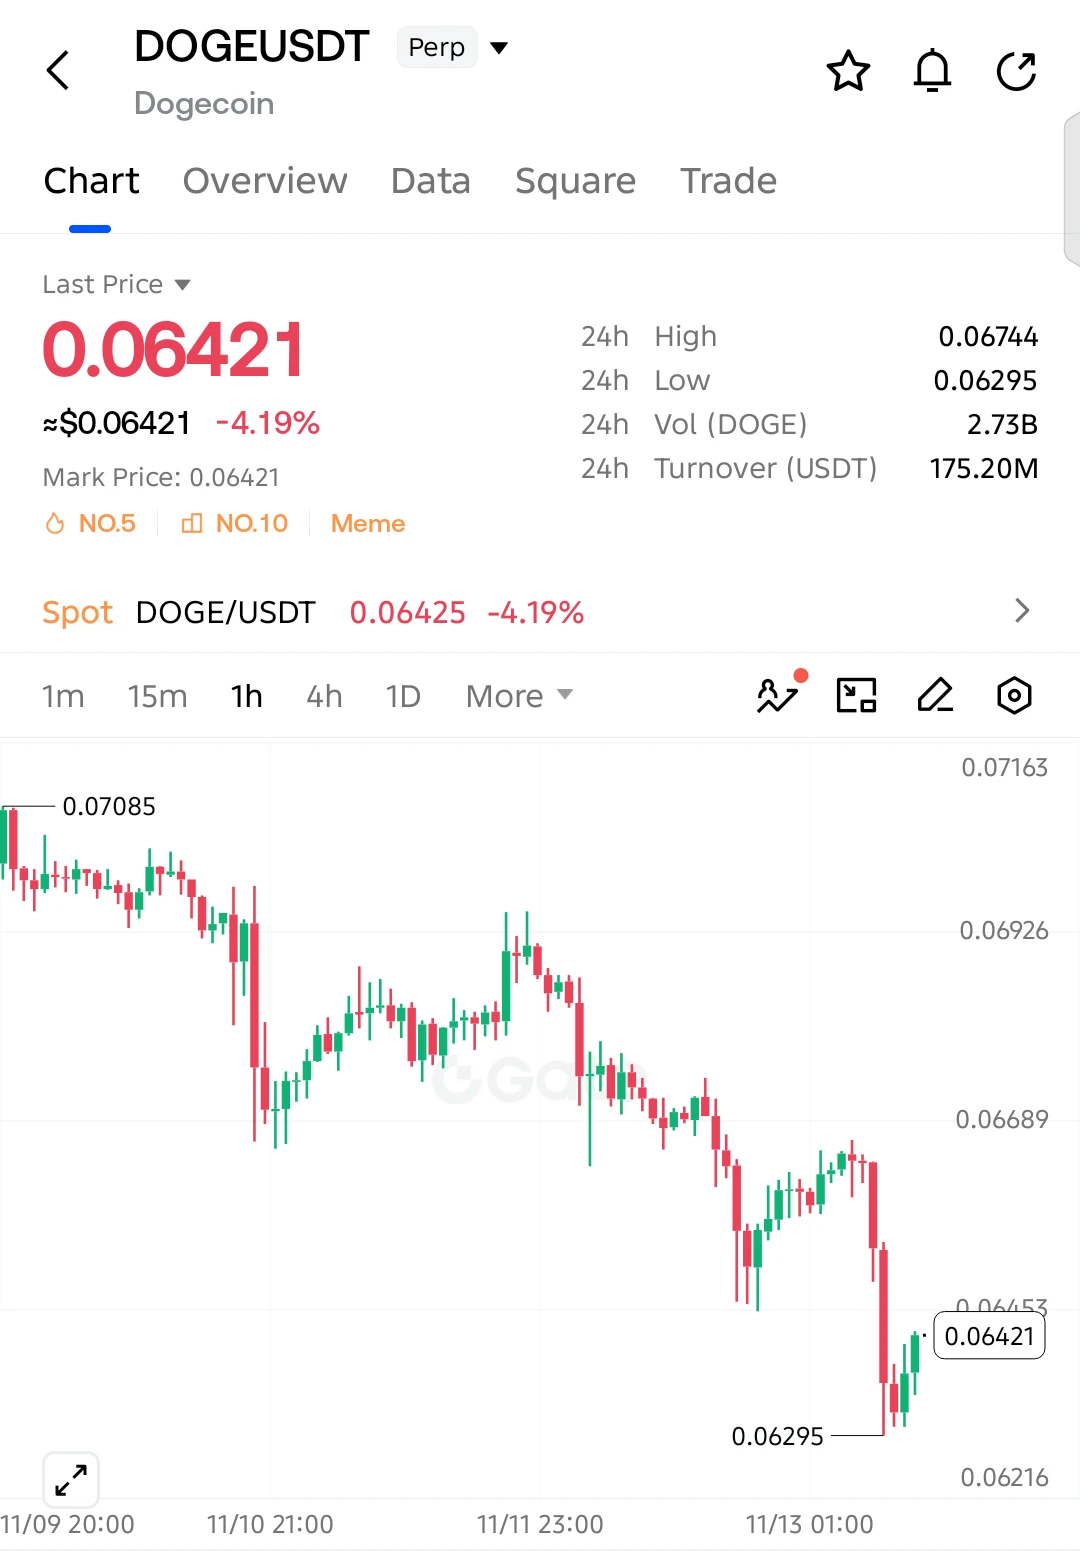
$DOGE SHORT ALERT — 0.06295 SUPPORT AT RISK, 0.06000 NEXT!

Entry: 0.06421
SL: 0.06620

TP1: 0.06295
TP2: 0.06150
TP3: 0.06000

$DOGE is down 4.19%, with sellers maintaining control through lower highs and lower lows. The latest bounce from 0.06295 remains weak and has yet to reverse the bearish structure. Another rejection below 0.06500 could push price back toward support, with a breakdown opening the way to 0.06000.

Invalidation: A sustained recovery above 0.06620 weakens the bearish setup.
post-image
DOGE-0.22%
  • 2
  • 1
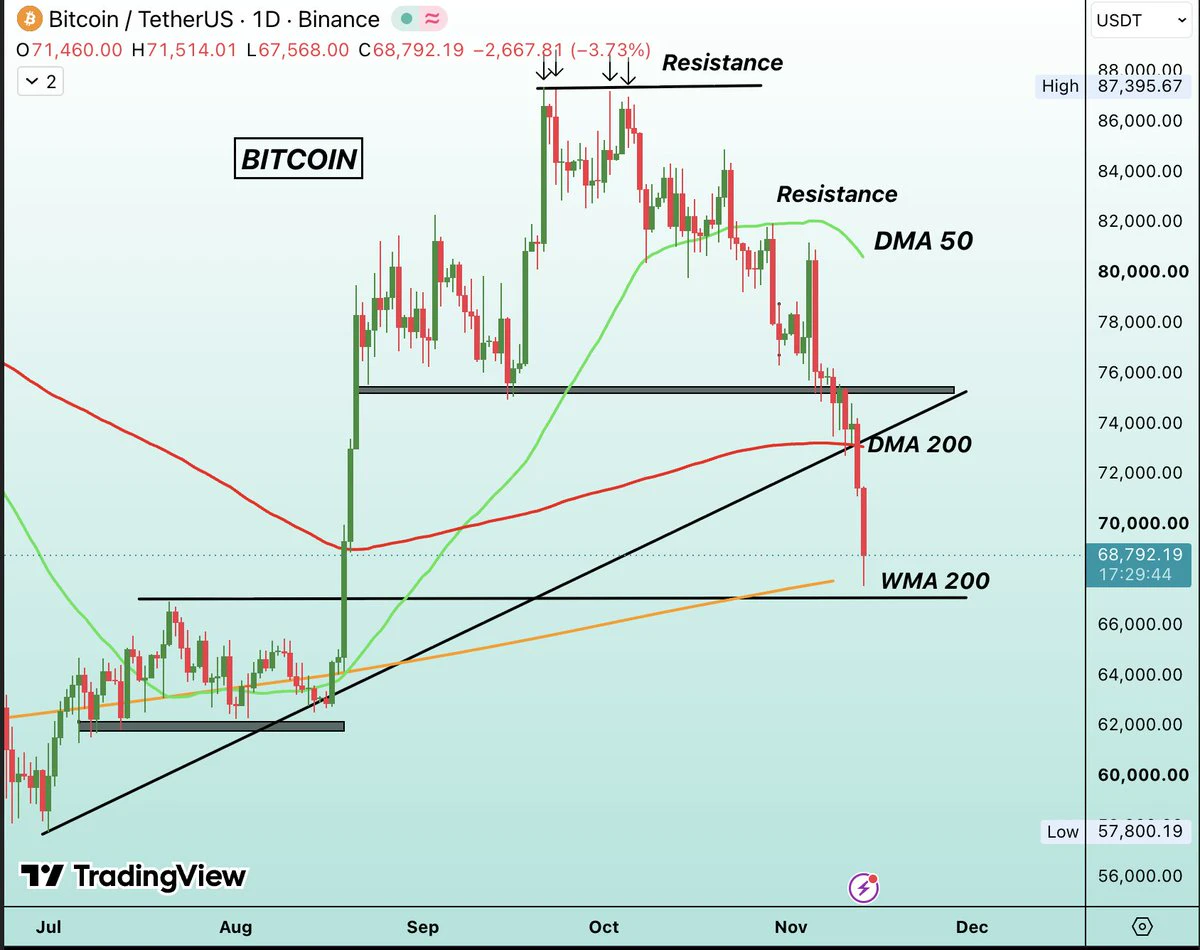
Bitcoin just retest WMA 200 at $68,000 after 85 days.
post-image
BTC-0.67%
#JensenHuangCouldFaceRemoval $NVDA WAIT / NEUTRAL
Neutral derivatives analysis: does not yet support a bias based on 12 signals.
daily trend down
up 2.2% in 24 hours
rose due to short covering (weak)
post-image
NVDA-0.35%
Does a sudden surge in trading volume signal a strengthening trend or a market reversal?

In crypto markets, a sudden increase in trading volume often catches traders’ attention. Some see it as a sign that capital is flowing in, while others worry that major players are exiting.

With the same surge in volume, why does the price sometimes keep rising, while at other times it suddenly reverses?

The key is that trading volume reflects changes in market activity, but on its own, it cannot show that buyers or sellers necessarily have the upper hand.

First, observe how the price behaves when volu
post-image
gate launches its third ipo access subscription for anthropic at an indicative $70–$78 per share, with subscriptions in usdt open until november 17. allocation is not guaranteed.

\#ANTHROPIC #IPO $GATE
post-image
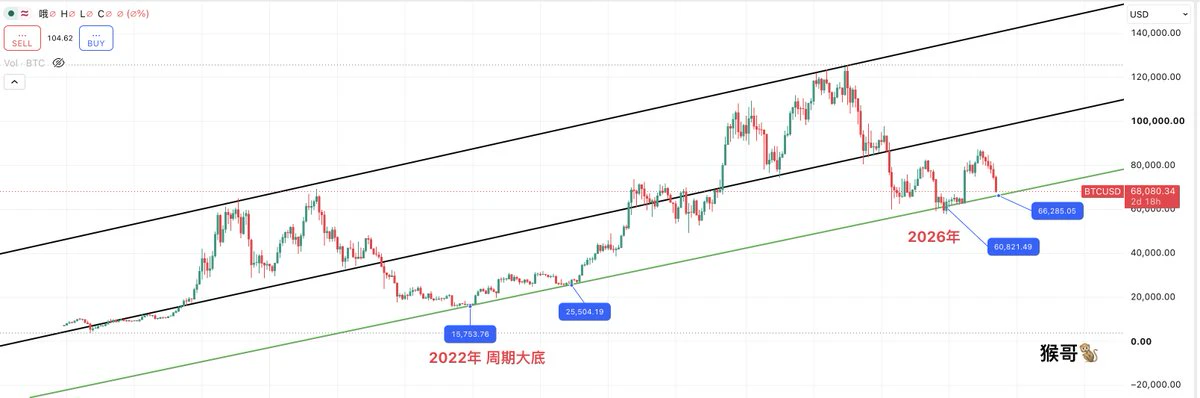
Don't give up; there's still hope for Bitcoin.
Since 2022, Bitcoin has touched the green line in the chart below only three times.
The first was during the bear market bottom in 2022.
The second was a retest before the bull market's main rally began.
The third was when it bottomed at 57,000 in 2026.
This is the fourth time, at 66,000.
The previous three touches all came during periods when Bitcoin was hit by one piece of bad news after another.
The situation facing this fourth touch is even more challenging than the previous three.
I think Bitcoin will most likely find a bottom at the green li
post-image
BTC-0.67%
gate layer completes its v2.0.1 mainnet upgrade, improving state-root accuracy, on-chain consistency, and node stability without changing external interfaces.

\#GATELAYER #MAINNET $GATE
post-image
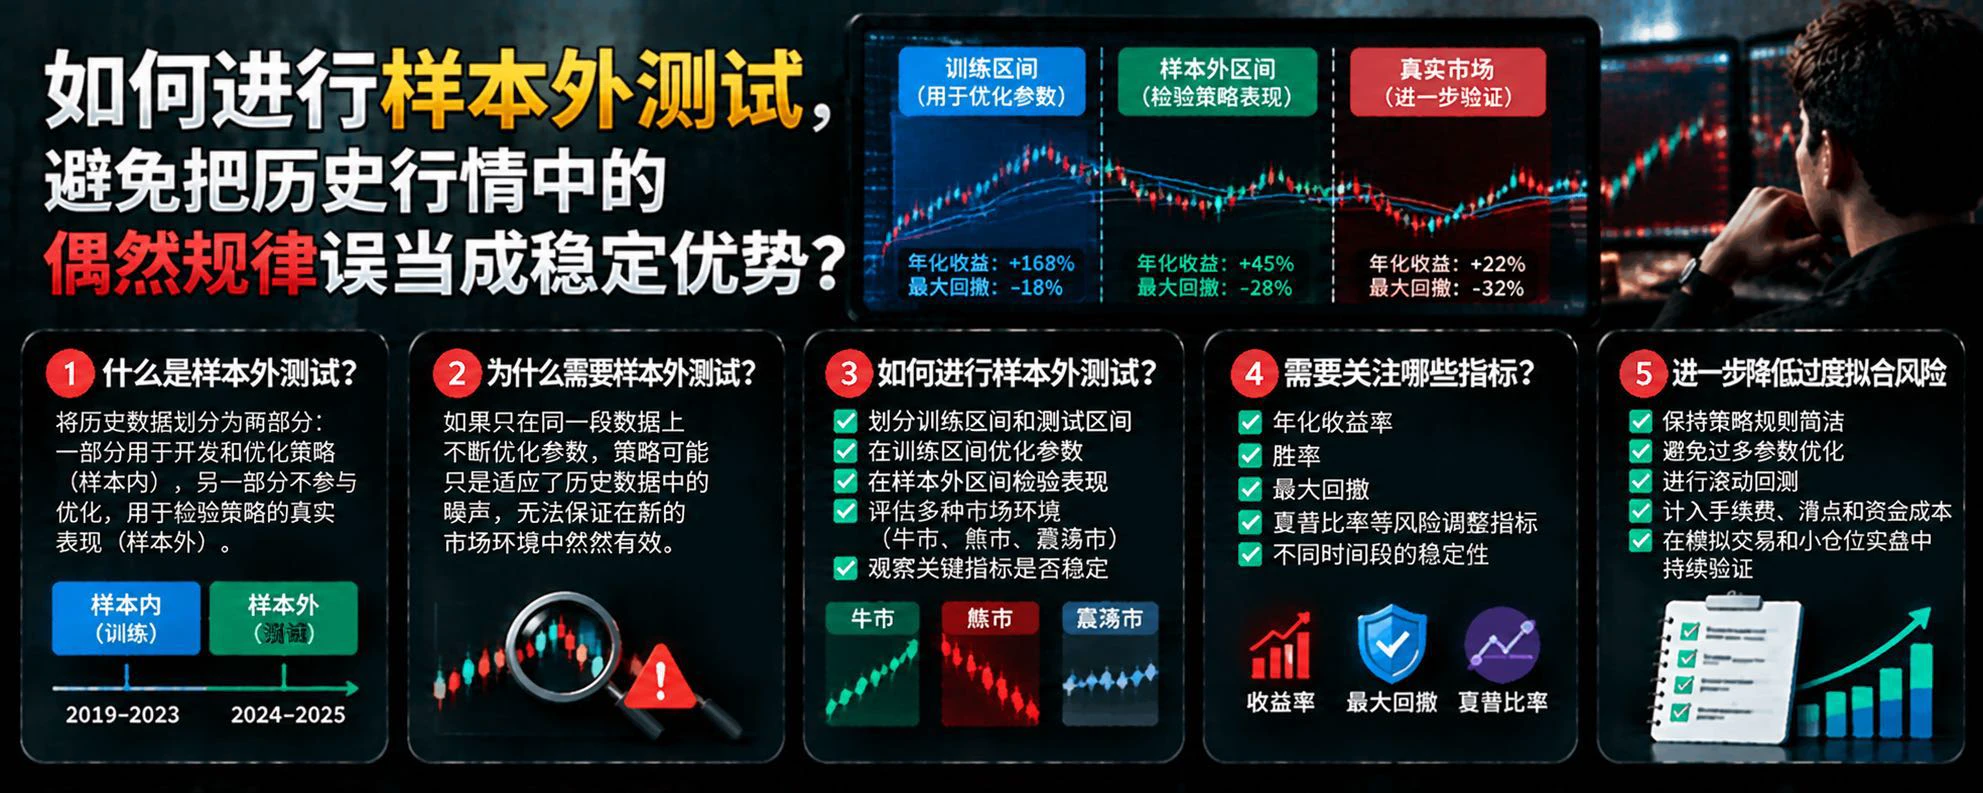
How can out-of-sample testing help avoid mistaking random patterns in historical market data for a lasting edge?

A trading strategy that performs well in historical backtests may not be able to adapt to future markets. To reduce the risk of overfitting, out-of-sample testing is a crucial step in validating a strategy.

First, what is out-of-sample testing?

Simply put, historical data is divided into different periods: one portion is used to develop the strategy and adjust its parameters, while another is excluded from optimization and reserved specifically for testing how the strategy perfor
post-image
🔹South Korean Chip Stocks Rebound Against the Trend! KOSPI Gains Over 2, While SK Hynix and Samsung
live-cover
LIVE3,992
$BTC Perpetuals are bearish. Today’s drop has been fast and smooth, with the bears giving the bulls no chance to catch their breath.
From yesterday’s high of 73708, it has fallen more than 5,400 points in less than a day, down 6.8% in 24 hours. Perpetuals trading volume is about $9.5 billion, the highest in the market. It’s now at 68550. The 13:00 hourly candle just hit a new low of 68243, and the 11:00 candle alone plunged nearly 1,800 points. Every hourly candle is making a lower high and a lower low.
After the round-number level of 70000 broke this morning, the rebound only reached 70286 a
BTC-0.65%
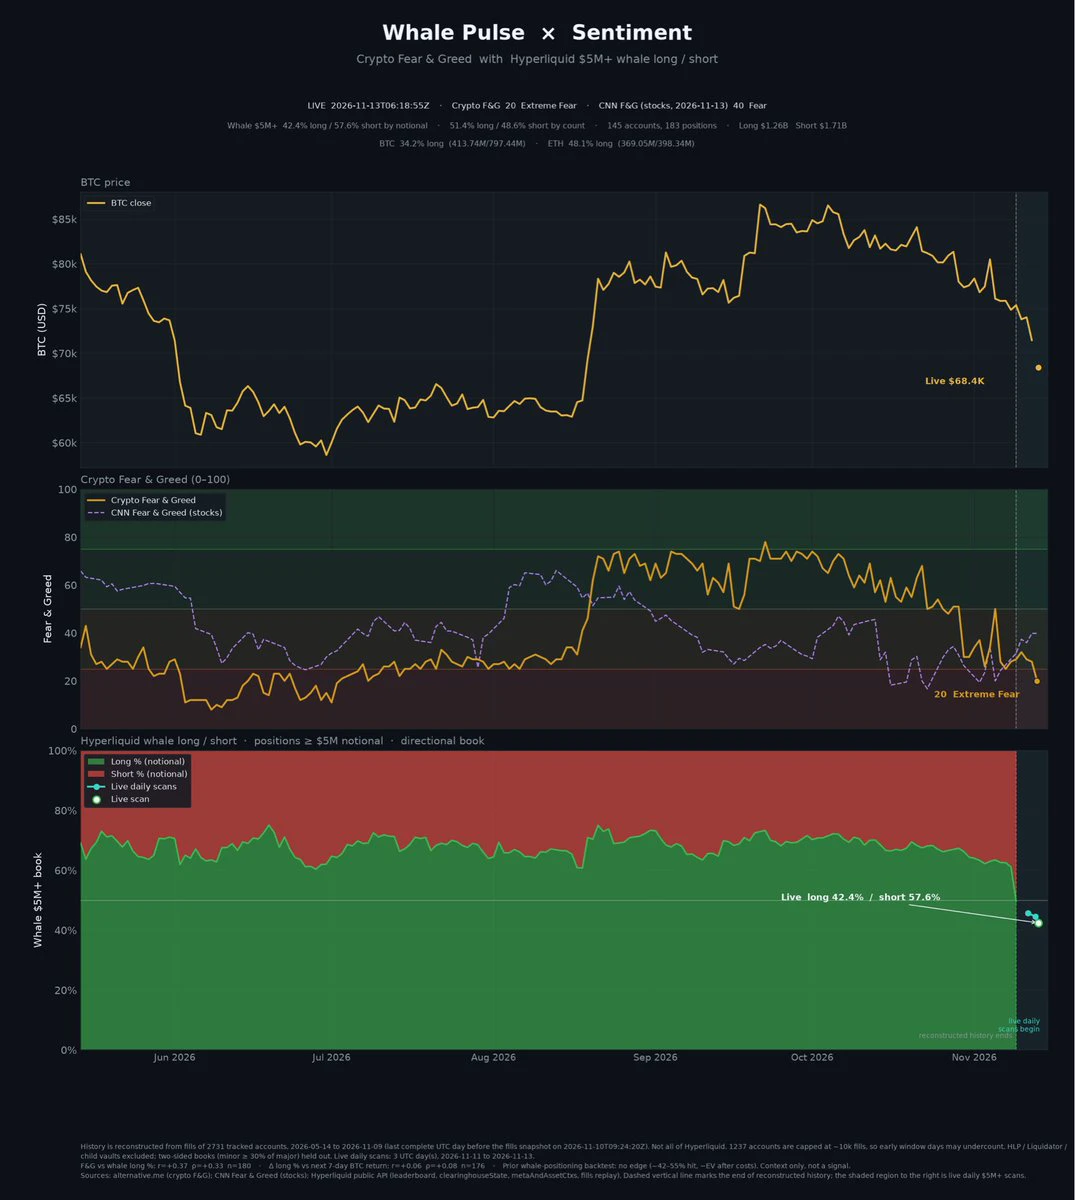
Whales 🐳 Shorts are still through the roof ..yikeeeesssssy
post-image
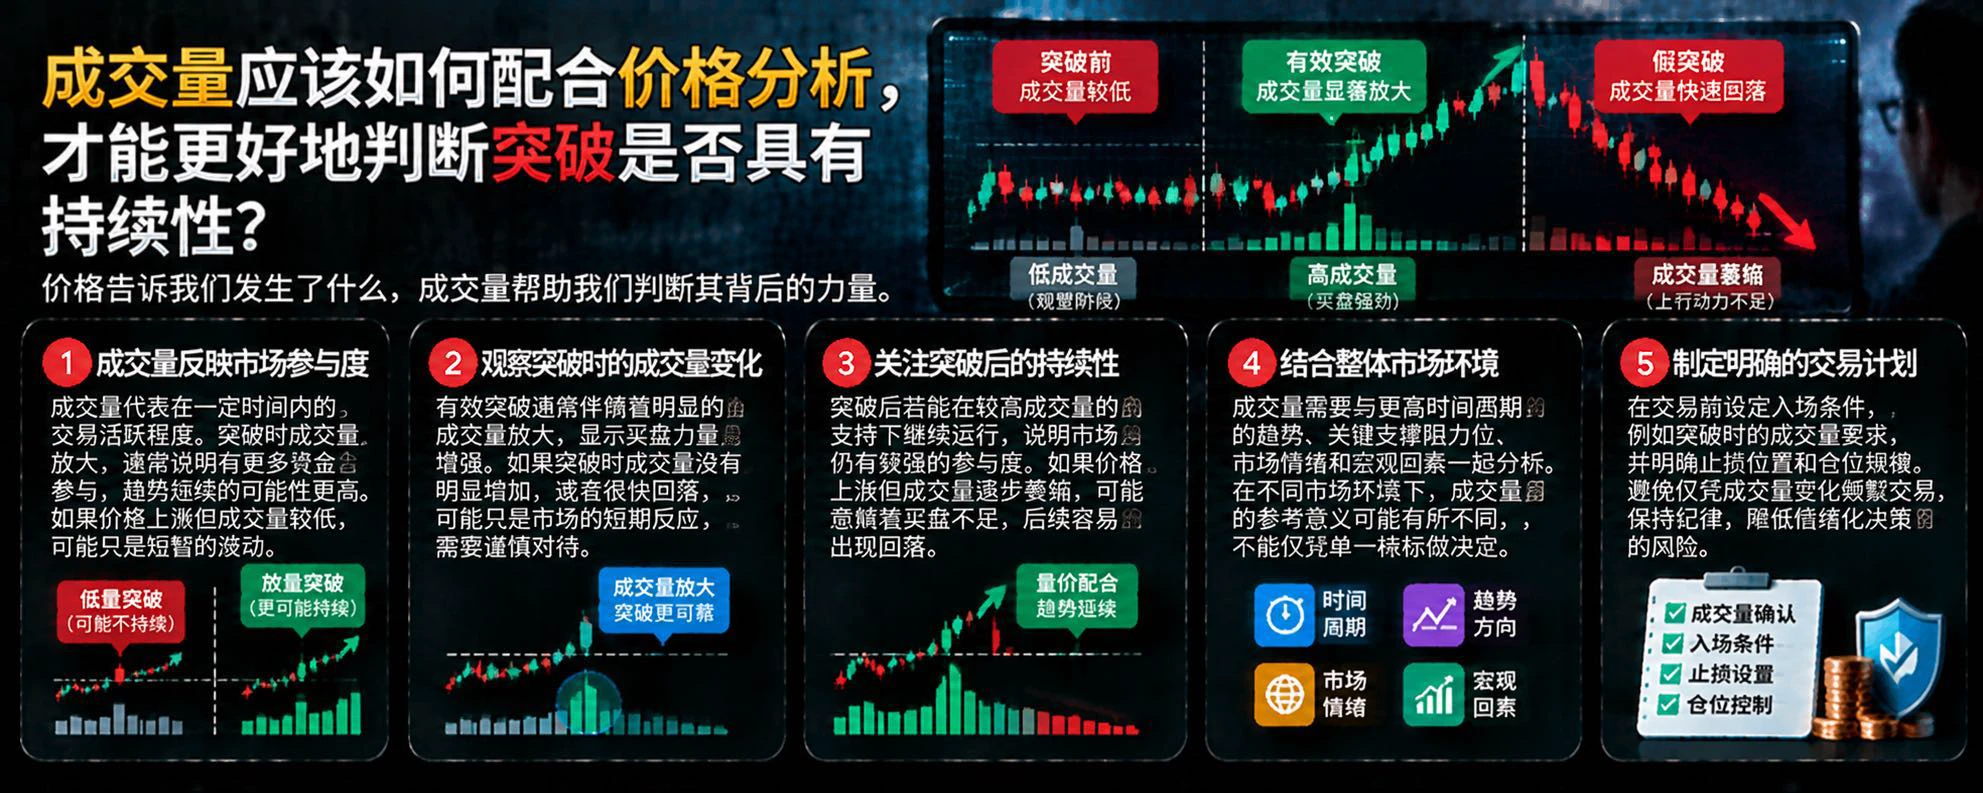
How should volume be used alongside price analysis to better assess whether a breakout is sustainable?

In crypto markets, price tells us where the market is moving, while volume helps us understand the level of trading participation behind that move. Together, they can provide more clues for assessing a breakout’s credibility, but they cannot guarantee an accurate prediction.

First, understand what volume means. Volume reflects trading activity over a given period. If a price breaks through a key resistance level and volume rises noticeably at the same time, it usually indicates greater mark
post-image
Nvidias Valuation Falls to a 14-Year Low as Shares Retreat Over 30 From Their Record High! Is This a
live-cover
LIVE2,757
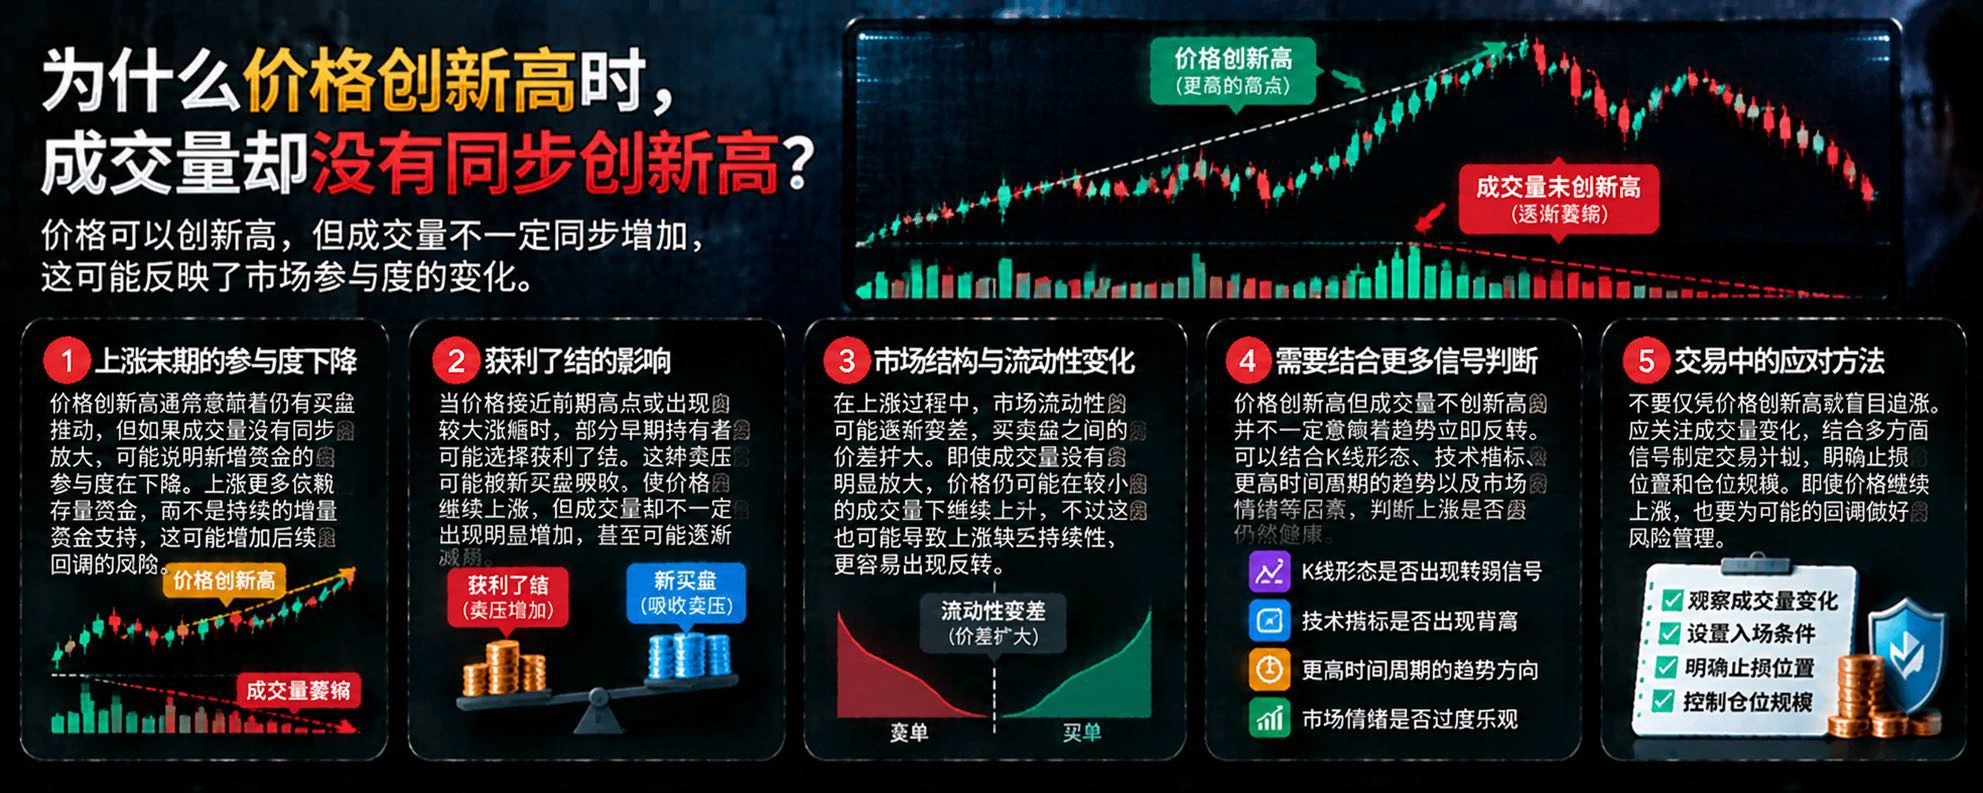
Why Is Trading Volume Not Hitting New Highs Alongside Price?

In the crypto market, prices keep reaching new highs, and the trend still looks strong, but trading volume is gradually shrinking. This phenomenon is worth watching because it may reflect a change in market participation. However, declining volume does not necessarily mean a reversal is imminent.

First, upward momentum may be weakening.

A new high indicates that buyers and sellers are transacting at higher prices under current conditions, but if volume is not rising in tandem, it may mean there are not enough new participants. If
post-image
The Higher the Funding Rate, the More You Should Short? Don’t Mistake Market Sentiment for a Trading Signal

In crypto perpetual futures markets, when funding rates continue to rise, some traders believe longs are overcrowded and the market could reverse at any moment, so they choose to go short.

But a high funding rate does not mean prices will fall immediately. It reflects the relationship between perpetual contract prices and market mechanisms such as mark prices, as well as the holding costs for longs and shorts at a given moment.

First, understand the role of funding rates.

Perpetual c
post-image
$PUMP made the trending list but got a cold reception; RSI 36.3, I'm bearish
$PUMP made CoinGecko's trending list, but the market immediately turned: now at 0.00331, 24h -4.3%. In a defensive market, trending status can't save a breakdown structure. I'm bearish.

The buzz hasn't turned into money—7d -15.98%, 30d -31.11%, 30-day range level at 0.02. Trending status is an emotional afterglow, not buying pressure.

Volume is also working against it—24h trading volume is 7165967 USDT, with a ratio of 0.408 versus the 30-day average. A low-volume decline, with nobody lifting the rebound.

The dail
PUMP-1.06%
When the Market Crashes, Why Can Forced Liquidations Further Intensify the Downtrend?

In crypto markets, prices sometimes just begin to fall, then the decline suddenly accelerates. Large numbers of positions are forcibly liquidated, more sell orders enter the market, and prices fall further, triggering a series of sharp fluctuations.

This may be due to a market mechanism known as a “liquidation cascade.”

First, leverage amplifies the impact of price changes on accounts.

When using leverage, traders only need to put up part of the margin to establish a larger position. Therefore, the same p
post-image
Load More

Join 40 M users in our growing community

⚡️ Join 40 M users in the crypto craze discussion

💬 Engage with your favorite top creators

👍 See what interests you

Trending Topics

JensenHuangResigns

507.1K Views7.7K Discussing

Jensen Huang has resigned as NVIDIA CEO and stepped down from the board. CFO Colette Kress will serve as interim CEO while NVIDIA considers internal and external successors. $NVDA fell more than 10% in premarket trading following the announcement. With one of AI’s most influential leaders stepping aside, markets are now reassessing NVIDIA’s leadership stability, AI strategy, and long-term valuation.

GateIPOAccessAnthropic

275.1K Views2.6K Discussing

Dr.HanOxfordUnionSpeech

143.5K Views413 Discussing

View More