




Square
Following
Hot
News
Profile

DuniaForexCrypto

vip
Peak Tier 4
Futures Trading Strategist
Crypto Market Researcher
$1000,000,000.00
7
Following
9k
Followers
13.2k
Liked
Pin
#babydoge
Calculating BabyDoge Scenarios, From the Habit of Buying One Dollar a Day to the Dream of a Billion Dollar Market Cap
BabyDoge is a meme token born in mid-2021 as a derivative of Dogecoin, built on the BNB Chain with an automatic deflation mechanism through token burning on every transaction. As of the end of June 2026, BabyDoge has a market cap of approximately $52.6 million, ranking around 370 to 414 among all crypto assets according to CoinMarketCap and CoinGecko data, with a circulating supply reaching 179.19 quadrillion tokens out of a total maximum of 420 quadrillion, where mo
  • 63
  • 3
AMPL’s movement is a reminder that price never stands alone.
A 31% drop in 15 minutes looks extreme, but thin liquidity can drastically amplify the movement. Therefore, traders need to look at depth, volume, open interest, funding, and liquidations—not just the percentage change in price.
The $1.27 area is the main focus, while $1.86–$1.88 is an important zone for assessing whether the recovery truly has strength.
Sometimes the most dangerous thing is not the volatility, but believing the market is sufficiently liquid when it actually isn’t.
#Gate月满交易节 #MidAutumnRedPacketRain
Falcon_Official
#Gate #Gate月满交易节 A 15-Minute Move That Exposes Liquidity Risk
AMPL delivered a sharp reminder that percentage moves alone can be misleading when market depth is extremely thin.
In a reported 15-minute window, AMPL dropped 31.18%, moving from approximately $1.86 to $1.28. The broader 24-hour range was around $1.27–$1.88, leaving the token close to the lower end of its session range.
The important part of this move is not simply the 31% decline. It is the relationship between price impact, available liquidity and trading activity.
The Liquidity Problem
A reported 24-hour trading volume of only around $3,938.53 would be exceptionally small for a token capable of moving more than 30% within minutes.
That creates a very different trading environment from a liquid large-cap asset. When order-book depth is limited, even relatively modest market orders can consume available bids and push price through multiple levels.
Historical market data also shows that AMPL's trading activity can vary significantly between sessions, reinforcing why the exact venue and timestamp matter when assessing a sudden move.
$1.27 Becomes the Immediate Line
The $1.27 area is now the key downside reference from the reported move.
If price continues to trade around this level without meaningful buying depth appearing, the market remains vulnerable to additional price dislocation.
A recovery back toward $1.86–$1.88 would tell a very different story. That zone represents the area from which the rapid sell-off began, so reclaiming it would indicate that buyers have absorbed a significant portion of the selling pressure.
Until then, a bounce alone should not automatically be interpreted as a complete recovery.
Was It Spot Selling or Leverage?
This is where derivatives data becomes critical.
A 31.18% move can be amplified by leveraged positions if long liquidations begin forcing additional market sells. To determine whether that happened, traders need to compare:
Open interest — Did positions disappear rapidly during the decline?
Liquidations — Were long positions forcibly closed as price moved lower?
Funding — Was positioning heavily long before the sell-off?
Volume — Did genuine spot activity increase, or was the move concentrated in a thin market?
Without those figures, it would be premature to label the entire move as a liquidation cascade.
Why AMPL Is Different
AMPL's own dashboard currently shows a market rate around $1.26, a price target around $1.27, and total supply of roughly 2,965,389 AMPL.
That makes AMPL particularly interesting from a market-structure perspective because its protocol design includes supply adjustments through rebasing. Consequently, traders should distinguish between token price, circulating supply and market capitalization rather than interpreting price alone.
This also means liquidity conditions deserve additional attention during abrupt moves.
The Recovery Test
There are now two levels that frame the short-term structure:
$1.27 — downside reference: Holding this area could provide the first base after the flash decline.
$1.86–$1.88 — recovery zone: Reclaiming this area would show that the market has absorbed the sharp sell-off and recovered the pre-crash range.
Between these levels, volatility can remain extremely high.
Gate Square Angle: Measure Market Depth, Not Just Price
The AMPL move is a useful case study for why traders should not treat every large percentage change as a normal market-wide event.
When liquidity is thin, the sequence can become:
Low order-book depth → aggressive order → rapid price displacement → liquidations → additional forced orders → wider volatility.
That structure can produce a dramatic candle without requiring billions of dollars of capital to enter or leave the market.
The most important data after a move like this is therefore not simply whether AMPL rebounds. It is whether real liquidity returns, order-book depth improves, open interest stabilizes and price can reclaim the $1.86–$1.88 area without another sharp liquidity-driven rejection.
For AMPL, the headline is a 31.18% 15-minute crash. The deeper market lesson is about how quickly thin liquidity can transform a relatively small trading environment into an extreme price-discovery event.
#MidAutumnRedPacketRain.
repost-content-media
  • 16
  • 2
I trade on Gate, a top-tier exchange with a 13-year track record. Join me and follow the popular events currently taking place! https://www.gate.com/campaigns/6340events?ch=7675&ref=AllFXVgL&ref_type=132
post-image
  • 13
BMNR is interesting not only because of its 4%+ correction, but because its volatility is closely tied to ETH’s movements and expectations for the Ethereum treasury.
Key levels to watch: $26.90 as a support area and $28.40–$28.86 as resistance. Volume will be key to distinguishing a normal pullback from a structural shift.
In crypto stocks, don’t just look at the red candle. Look at ETH + volume + price structure together.
#CryptoStocksSlipBMNRDownOver4% #GateSquareMidAutumnReunion
HighAmbition
#CryptoStocksSlipBMNRDownOver4%
CRYPTO STOCKS SLIP — BMNR DOWN 4%+: WHAT TRADERS NEED TO KNOW
The headline “Crypto Stocks Slip, BMNR Down Over 4%” sounds simple, but the numbers tell a more useful story. The recent weakness is better understood as a pullback after a strong September advance rather than every crypto-related stock suddenly collapsing. BMNR, Coinbase, Strategy, Robinhood and crypto-mining stocks have all been experiencing periods of profit-taking and volatility, while their movements remain closely connected to Bitcoin, Ethereum, liquidity and broader risk appetite. BMNR is particularly important because BitMine Immersion Technologies has built a very large Ethereum-focused treasury, making ETH price action one of the major variables traders should monitor alongside BMNR itself.
BMNR CURRENT PRICE AND RECENT MOVE
BMNR’s latest completed U.S. session closed at $27.56, down 1.68% on the day. The stock opened around $28.28, reached a high of $28.39 and dropped to a low of $26.92, creating an intraday range of $1.47, or approximately 5.18% from high to low. Around 31.4 million shares traded during the session, showing that BMNR remains a highly liquid but highly volatile stock. The important point is that the recent 4%+ decline did not happen in isolation. BMNR had already rallied strongly before the pullback, moving from $22.81 on September 16 to $28.25 on September 21, a gain of roughly 23.85%. It then reached around $28.76 before retreating.
The specific session behind the “down over 4%” headline saw BMNR fall approximately 4.52%, moving from $28.76 to $27.46. During that session, the stock traded between approximately $28.56 and $27.30, with more than 35.7 million shares traded. A decline of this size combined with substantial volume tells traders that there was meaningful selling activity, but it does not automatically mean the larger recovery has ended.
CRYPTO STOCKS ARE ALSO SHOWING WEAKNESS
The latest completed session showed several major crypto-linked equities moving lower. BMNR closed at $27.56, down 1.68%, while Coinbase closed around $195.11, down 2.06%. Strategy closed near $158.61, down approximately 1.86%, and Robinhood finished around $119.40, down roughly 1.18%. MARA closed around $12.55 after falling from approximately $12.92, with about 36.66 million shares traded. These moves show that the weakness is not limited to BMNR, although individual companies can experience much larger moves depending on their crypto exposure, valuation and company-specific news.
BMNR’S VOLUME AND LIQUIDITY MATTER
Volume is one of the most important pieces of the BMNR setup. The stock traded approximately 65.3 million shares on September 18 while gaining 8.79%, around 52.5 million shares on September 21 while gaining 8.70%, approximately 40.7 million shares on September 22, about 36.3 million shares on September 23 during the 4.52% decline, and around 31.4 million shares on September 25. This shows that BMNR can attract tens of millions of shares in a single session, creating significant liquidity but also allowing large buying and selling flows to produce rapid price changes.
At approximately $27.56, BMNR’s market capitalization is around $16.6 billion. Traders therefore should not judge the stock only by its share price. The relationship between the company’s market capitalization, its Ethereum holdings, cash position, share structure and the market value investors assign to its treasury is extremely important when assessing the stock.
WHY DID BMNR FALL MORE THAN 4%?
One major factor is Ethereum. BMNR’s investment story is strongly connected to ETH because the company has accumulated a very large Ethereum treasury. When ETH falls, investors can reassess the value of that treasury and the premium they are willing to pay for BMNR shares. Recent reporting connected the September 23 BMNR decline with weakness in ETH, which was reported around $2,661.43 at that time and down approximately 2.9% over 24 hours.
The second factor is profit-taking. A stock that rises from $22.81 to $28.25 in only a few sessions can attract traders who decide to lock in gains. From $22.81 to $28.25, the move was approximately 23.85%.
From $23.89 on September 17 to $25.99 on September 18, BMNR gained about 8.79%, and the following move toward $28.25 added another substantial advance. After such a rapid rally, a 4%–5% pullback can occur simply because short-term traders reduce positions.
The third factor is volatility between crypto and U.S. equity markets.
Ethereum trades continuously, while BMNR trades during U.S. market hours. A significant ETH move outside equity-market hours can therefore be reflected in BMNR when the stock market opens, creating fast moves, gaps and large intraday ranges.
THE ETHEREUM CONNECTION
Recent company disclosures reported that BitMine had reached approximately 5.79 million ETH, representing around 4.8% of total ETH supply, with crypto and cash holdings reported around $11.8 billion at that point. Later September reporting indicated approximately 5.93 million ETH. This makes Ethereum one of the most important variables for BMNR traders.
If ETH rises, the value of BMNR’s ETH treasury can rise in dollar terms, while improving crypto sentiment can also increase demand for the stock. If ETH falls sharply, the opposite pressure can appear.
However, BMNR will not necessarily move one-for-one with ETH because the stock is also influenced by valuation, treasury strategy, share issuance, liquidity, investor expectations and the premium or discount assigned to its assets.
BMNR KEY PRICE LEVELS
At $27.56, the first important downside area is $26.90–$27.00 because the latest session reached approximately $26.92. If buyers defend this zone and BMNR recovers toward $28.00, traders can then watch $28.33–$28.40. Above that, the September resistance area around $28.86 becomes important.
A sustained move above $28.86 would put the psychological $30 level into focus. From $27.56 to $30, the potential move is approximately 8.85%. If momentum continues beyond $30, the $32 area would represent approximately 16.10% upside from $27.56, while $34 would represent approximately 23.37%.
On the downside, a confirmed break below $26.90 would make $26.00 an important reference. From $27.56 to $26.00 is approximately -5.66%. A move toward $25.00 would equal roughly -9.28%, while $24.00 would represent approximately -12.92%.
The next deeper historical areas are around $24.70–$25.00 and $23.80–$23.90. BMNR closed around $23.60 on September 15, $22.81 on September 16 and $23.89 on September 17. These levels can help traders judge whether the current pullback remains a normal consolidation or develops into a deeper deterioration.
BULLISH PRICE SCENARIO
For a bullish continuation, traders can watch whether BMNR holds $26.90–$27.00 and then recovers above $28.00. The stronger confirmation would come from a move through $28.40 followed by a break of approximately $28.86 with increasing volume. If that happens while ETH is also strengthening, $30 becomes the next major psychological checkpoint
A move from $27.56 to $30 would be about 8.85%, $32 about 16.10%, and $34 about 23.37%. These are mathematical price scenarios rather than guaranteed targets. Analysts have also published widely different estimates for BMNR, illustrating how uncertain valuation can be for a high-volatility crypto treasury company.
BEARISH PRICE SCENARIO
The main short-term warning would be a sustained break below $26.90 accompanied by increasing selling volume. That could expose $26.00 first and then $25.00–$24.70. If ETH is simultaneously declining, the pressure on BMNR could become stronger because of its substantial Ethereum exposure.
A deeper breakdown below $23.80–$23.90 would be more significant because it would erase much of the recent September recovery. Traders should therefore watch not only where BMNR trades, but also how much volume accompanies every major move. A low-volume dip that quickly recovers has a different meaning from a high-volume breakdown followed by continued lower highs.
TRADING PLAN FOR THE NEXT MOVE
For traders waiting for confirmation, the $26.90–$28.86 range is currently important. Holding above $26.90 keeps the recent structure alive, while recovery through $28.40 and especially $28.86 would show stronger buying interest. A break toward $30 would then become the next major test.
For traders already holding BMNR, the key is to monitor ETH, BMNR volume and the reaction around $26.90 rather than reacting emotionally to one red session. For traders waiting for an entry, patience around major levels can be more useful than chasing a sudden green candle after an already strong rally.
The most important confirmation is the relationship between price and volume. If BMNR rises through resistance with expanding volume, the move has stronger participation behind it. If price repeatedly fails near $28.40–$28.86 while selling volume increases, traders should recognize that resistance is still active. Likewise, if BMNR breaks $26.90 but quickly recovers with strong buying volume, that reaction can provide different information from a clean breakdown followed by continued weakness.
FINAL MARKET VIEW
The recent BMNR decline should be viewed in the context of a much larger September move. From $22.81 on September 16 to $27.56 on September 25, BMNR was still approximately 20.82% higher despite the recent pullback. From $23.60 on September 15 to $27.56 on September 25, the gain was approximately 16.78%. Therefore, the headline “BMNR down over 4%” describes an important short-term decline, but the broader September price movement remains much larger.
My focus for the next move would be $26.90–$27.00 on the downside and $28.40–$28.86 on the upside. Above $28.86, $30 becomes the next major psychological level, followed by $32 and $34 if strong momentum returns
Below $26.90, $26.00 becomes important, followed by $25.00–$24.70 and then $23.80–$23.90.
The biggest external variable remains Ethereum. Strong ETH price action combined with rising BMNR volume could support renewed buying interest, while a sharp ETH decline combined with heavy BMNR selling could increase downside pressure.
For traders, the practical lesson is to follow the confirmed price structure, volume and ETH relationship rather than trading the headline alone.
BMNR has already demonstrated that daily moves of 4%, 8% or more are possible, so volatility should be treated as a central part of the setup rather than an unexpected event.
#GateSquareMidAutumnReunion
repost-content-media
BMNR+0.25%
ETH+0.01%
  • 18
  • 2
I trade on Gate, a top-tier exchange with a 13-year track record. Join me and follow the popular events happening now! https://www.gate.com/campaigns/6352?ch=7731&ref=AllFXVgL&ref_type=132
post-image
  • 16
  • 1
$QNT is attractive not only because its price has surged, but because its catalyst touches the level of banking infrastructure.
However, strong fundamentals do not always mean the price must continue rising in the short term. After an extreme surge, short squeezes and FOMO also need to be taken into account.
In my view, the most important thing now is not chasing the candle, but seeing whether real adoption can eventually keep pace with market expectations.
#QNT #Gate广场中秋团圆局
$QNT
ThisIsTranslateContent:
#QNT Why is QNT rising so violently: a dual detonation of real catalysts and short squeezes

This surge has "real substance"—The Clearing House selected Quant as the interoperability layer for a tokenized deposit network in the US. This is a bank-infrastructure-level partnership, not empty hype; but of the +95% one-day gain and 180% weekly rise, more than half is thanks to short squeezes and FOMO. The long-term narrative is strong, but it is severely overbought in the short term. Chasing now means taking the final leg.

Core catalyst: a genuine "bank adoption"-level event
On September 24, The Clearing House (TCH) announced that it had selected Quant to provide the interoperability layer for its "On-Chain Money Initiative."
The significance of this partnership needs to be broken down:
TCH is not an ordinary institution: it is core clearing infrastructure for the US banking system, processing more than $2 trillion in payments daily and operating the two major systems RTP (real-time payments) and CHIPS (international clearing)
​25 major US banks are participating: Quant's technology will be used for the clearing and settlement of tokenized deposits and connected to existing payment systems
​Quant's role is the "interoperability + orchestration + transaction management" layer—effectively serving as the "nervous system" for the tokenized deposit network of the US banking system
​The network is expected to go live in the first half of 2027
This is indeed one of the strongest types of narratives in "bank adoption"—one level deeper than "a certain bank pilot," representing "the selection of core US clearing infrastructure."

Why is it rising so violently: three amplifiers
Amplifier one: short squeezes. 24-hour trading volume is 20–36 times the 30-day average, short positions were liquidated in a chain reaction, and forced buying pushed the price from $65 all the way to $188—this is the standard short-squeeze script.
Amplifier two: smart money positioned early. On-chain data shows that activity had already heated up before the announcement became public—large funds built positions in advance, and once the announcement came out, it was time to "cash in."
Amplifier three: a boost from the compliance narrative. Tokenized deposits are the most "orthodox" direction in the RWA sector—"US banking infrastructure is going to use it" offers more room for imagination than any meme narrative, so capital naturally rushes in.

But three buckets of cold water need to be poured
First, +95% in a single day is extreme overbought territory. DiarioBitcoin's headline has already sounded the alarm ("eleva las alarmas de sobreextension")—after a vertical rise, pullbacks have historically never been gentle. A rise from $65 to $188 is nearly 3x, so a 30–50% retracement would not be surprising.
Second, the connection between the token and revenue remains unclear. Quant's TCH partnership is a permissioned network, and the use of the QNT token and revenue-sharing mechanism within it have not been clearly explained—between "the technology is being adopted" and "token holders make money" lies an unaddressed accounting gap.
Third, implementation is still far off. The network will not go live until the first half of 2027. From now until implementation, any issue in any link of the chain—regulation, technology, or negotiations among banks—could trigger a sentiment reversal. What is rising now is "expectations"; realizing those expectations will still take time.

Conclusion and strategy
In one sentence: this QNT rally is a hybrid of "real catalysts + a short squeeze"—the bank-infrastructure-level partnership is real, so this is not a shitcoin's irrational surge; but at $190, short-term expectations are already fully priced in. If you chase now, you are earning the profits that others are cashing out. $QNT ‌
QNT+26.46%
  • 13
  • 1
Claim red envelopes every day and compete for the leaderboard to share 100,000 USDT https://www.gate.com/campaigns/mid-autumn-2026?ref=AllFXVgL&ref_type=132
post-image
  • 10
  • 2
It’s not just about prizes; this is your chance to help shape the narrative on Gate Square. 🔥
Discuss the market, share insights, showcase strategies, and let your content compete for rewards.
⏳ Only 1 day left. Time to start creating!
#Gate广场中秋团圆局 #Gate
GateSquare
🌕 15,000+ USDT is being distributed, and the Gate Square “Mid-Autumn Creation Season” countdown has 1️⃣ day left!
Discuss market trends, share your trades, and share investment insights while creating content and winning Mid-Autumn gifts!
Join now 👉️ https://www.gate.com/campaigns/6260
🎁 Mid-Autumn benefits
1️⃣ Post to enter the red packet draw: up to 5 USDT per draw
2️⃣ Creator leaderboard: win a Gate Mid-Autumn limited-edition gift box + up to 1,000 USDT
3️⃣ Bonuses for quality content: verified creator badge + featured content + exclusive traffic support
4️⃣ Newcomer first-post reward: 50 lucky users share a 1,000 USDT prize pool
📌 Participation is easy:
① Register and include #Gate广场中秋团圆局 + to publish original content on daily trending topics
③ Discuss market trends, share your views, climb the leaderboard, and unlock generous Mid-Autumn benefits!
👉 Post now: https://www.gate.com/post.
repost-content-media
  • 8
  • 1
60 million users in 13 years is not merely a milestone, but proof of the long journey in building a global crypto ecosystem.
60 million is not the finish line. Instead, this is where the next chapter begins. 🚀
#Gate
$GT ‌
GateSquare
🌍 60 million users, and we’ve come this far together with Gate.
Starting in 2013, and serving more than 60 million users worldwide today, over 13 years, the market has changed, technology has changed, and Gate has kept moving forward.
From a single transaction to more assets, more markets, and more possibilities;
from exploring Crypto to connecting with the broader financial world.
Every choice, every transaction, and every step taken together has become part of Gate’s story today.
And 60 million is not the finish line, but the starting point of the next journey.
#Gate
GT-2.93%
  • 9
Convert Lucky Draw Challenge: Unlock Mystery Boxes with $1, Win Up to $1,888 in ETH https://www.gate.com/campaigns/6355?ch=7702&ref=AllFXVgL&ref_type=132
post-image
  • 12
Bitcoin Holds at $84,000–$85,000: ETFs Reverse Course, but the Market Has Yet to Confirm
Quick summary:
· U.S. spot Bitcoin ETFs recorded ~$2.4 billion in weekly inflows, reversing 2026 YTD into positive territory
· Price stalled at $84,000–$85,000 after failing to break through $87,000
· This consolidation is a test of character, not the finish line
Money Flows In, Price Stalls
Bitcoin touched $87,000 again on September 21—the highest level since late January—before retreating to the $84,000–$85,000 zone. On the surface, this looks like a routine technical retracement. But something more impo
post-image
BTC-0.74%
  • 9
  • 1
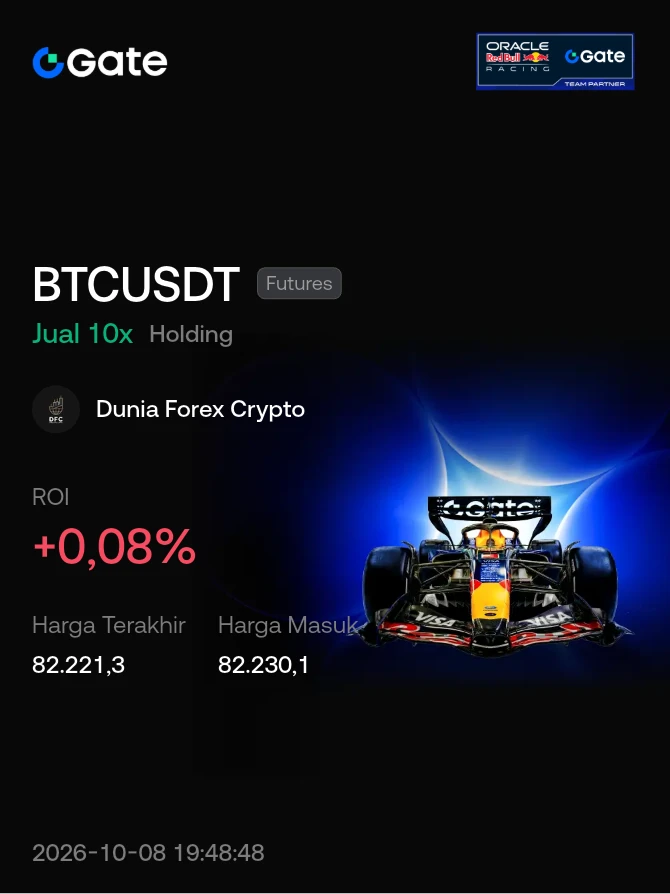
#Share My Holding Returns#
Go get your allowance now ☕🐂🀄
🔥🔥🔥🔥🔥
post-image
  • 13
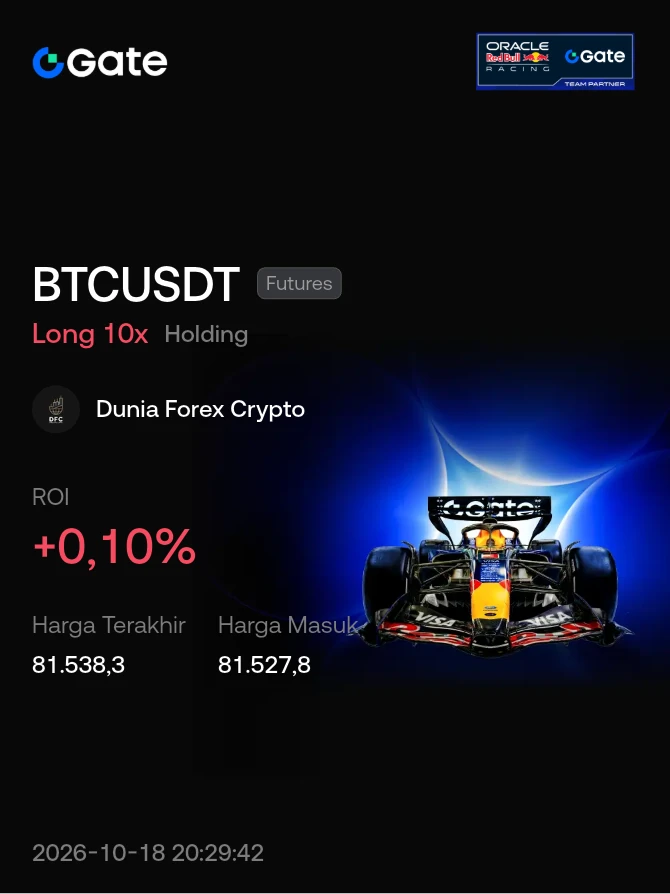
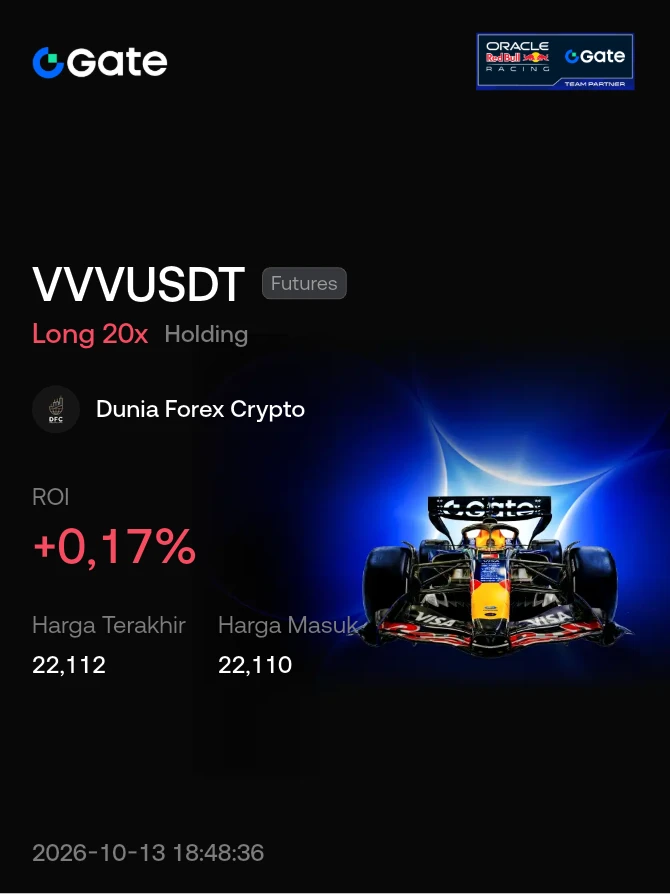
#Share My Futures Return#
Lock in your profits and take your pocket money
☕🐂🀄
The market is so wild, please be careful!
post-image
  • 9
  • 2
Crypto Market Starts Heating Up BTC, ETH, and altcoins are showing strong activity. Market momentum is once again in the spotlight.
Start here:
1. BTC vs ETH - Double Boost
Complete BTC/ETH deposits + futures trading to unlock total rewards of more than $514,000. https://www.gate.com/campaigns/6383
2. Deposit & Trading Challenge
Reach the target and get 1% cashback, up to 5,000 USDT. https://www.gate.com/campaigns/6358
3. Altcoins in the Spotlight
NEAR, AVAX, UNI, HYPE - token rotation season is underway.
New and returning users get a 1.5× trading volume boost. https://www.gate.com/campaig
post-image
BTC-0.74%
  • 13
  • 1
#Share My Holding Returns#
Take your pocket money ☕🐂🀄
Rest well
post-image
  • 16
  • 1
$90K Could Be the Next Target, But Not a Straight Run
BTC has just broken out of the $76K–$81K zone and broken through $85K, briefly touching the $87K area. This momentum was supported by recovering sentiment, ETF inflows, and a short squeeze. Therefore, the question “is $90K the next target?” makes sense.
Technically, $87K–$88K is the nearest obstacle. If that level is broken and held, $90K becomes a natural psychological magnet. The distance from $85K to $90K is not extreme, but the market has just risen quickly. That means the rise can continue, as long as it is not chased emotionally
post-image
BTC-0.74%
  • 18
  • 1
Keep building and building the spirit, friend ☕🐂🀄
Quickly take your pocket money 😁✌
#WeeklyShare
Gate_Square
📢 Reward Update | Gate Square Certified Creator Incentive
Rewards for September weekly rewards (9.14-9.20) have been distributed.
Apply now to unlock exclusive creator benefits 👉 https://www.gate.com/questionnaire/7698
The more you post, the more you earn!
🎁 Creator Rewards
1️⃣ First Post Bonus: New creators can earn $30 for first post.
2️⃣ Weekly Rewards: Post 5 times a week to share $10,000+.
3️⃣ Monthly Rewards: Post at least 8 times a month to share a $100,000+ .
📌 This round features NEAR_USDT with 20x leverage. Rewards will be credited within 14 business days.
📌 Existing Creator Badge holders do not need to reapply. Rewards will be distributed to eligible verified creators.
Winner Details: https://docs.google.com/spreadsheets/d/1fCqDlh2V5JClaHqJ8qKKE690y9kOhMI_fyrfZ0PMKFo/edit?hl=zh-CN&gid=0#gid=0
Event Details: https://www.gate.com/announcements/article/100944
repost-content-media
  • 18
  • 2