
Square
Following
Hot
News
Profile
Share your thoughts
placeholder
Article
can think of a few memes to pair with these
$HIMS
$MU
$NFLX
who's sending the next runner?
live on @base via @aeroxyz
post-image
HIMS-6.81%
MU-5.28%
NFLX+0.01%
#白银# On the 30th, I said, “There may be a rebound at 49.82.” 49.82 has been reached. Let’s see whether it rebounds. I share my thoughts in the second image. $XAG
XAG+0.47%
Trenches
ZIG
Z
bade
b
ZIG
0x8c...1145
Market Cap
$.
Change
.
24h Vol
$.
Holders
.
uni
u
bade
b
uni
jM9r...pump
Market Cap
$.
Change
.
24h Vol
$.
Holders
.
Anakin
A
bade
b
Anakin
Exxz...pump
Market Cap
$.
Change
.
24h Vol
$.
Holders
.
IDOL
I
bade
b
IDOL
0x3b...ab07
Market Cap
$.
Change
.
24h Vol
$.
Holders
BTC
B
bade
b
BTC
C5xp...pump
Market Cap
$.
Change
.
24h Vol
$.
Holders
.
This Week’s Gold Market Analysis (Comprehensive Assessment Based on the Previous Post)
I. Overview of This Week’s Key Drivers⚜️
This is a week packed with macroeconomic data. The key themes are U.S. employment data, PMIs from multiple countries, and Fed officials’ remarks, alongside the U.S. midterm elections. Gold pricing still hinges on real Treasury yields, the strength of the U.S. dollar, and rate-cut expectations.
Gold is fundamentally a non-yielding safe-haven asset: falling real Treasury yields are bullish for gold, while rising real yields are bearish. ❎
Key events this week, ranked by
XAU+0.38%
ETH-1.23%
XAUUSD+0.84%
  • 24
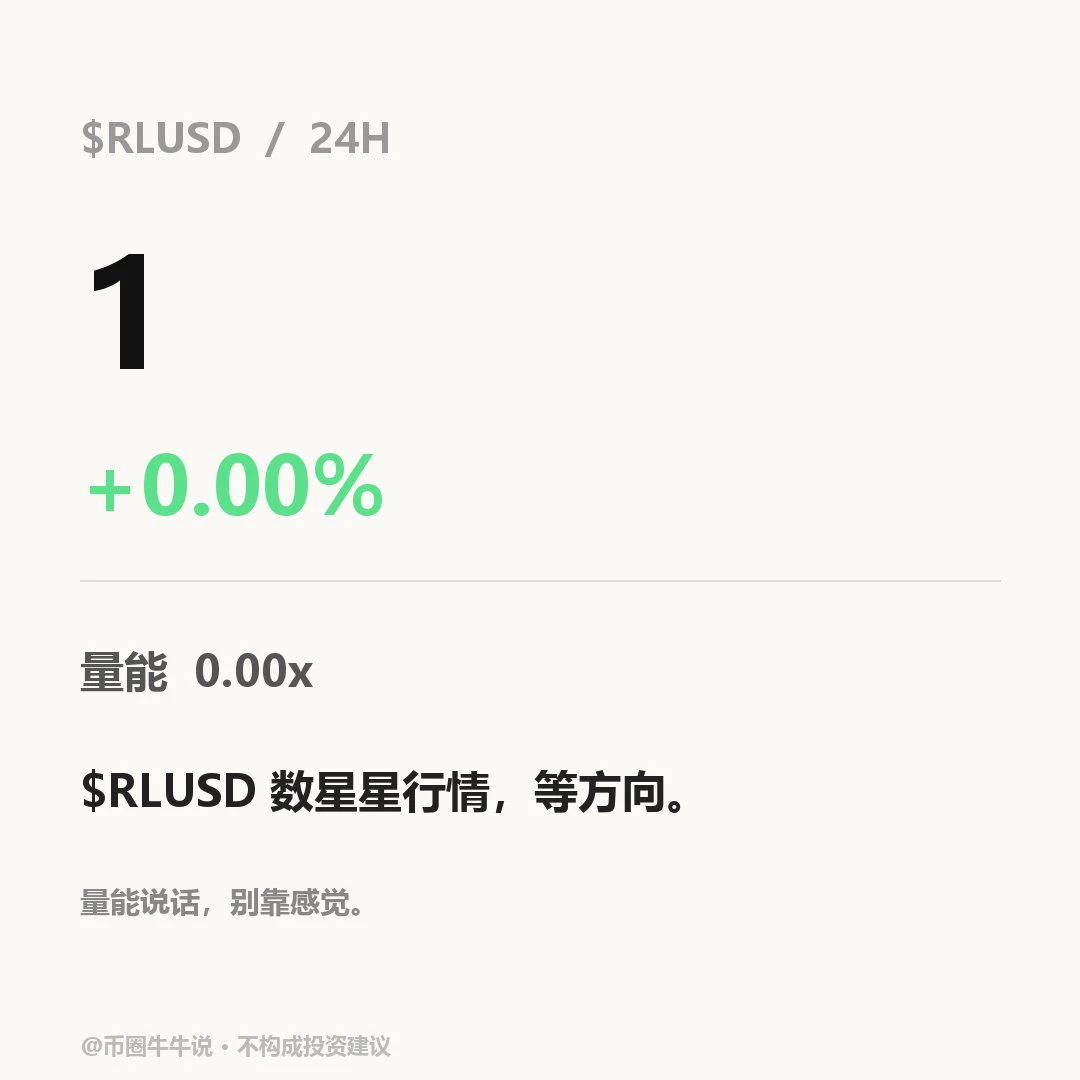
$RLUSD Currently trading at 1.0012, 24H +0.00% (range: 1.001–1.0013). The 1H trend is strong, with an RSI of 44; the 4H trend is weak, with an RSI of 29. If it holds above 1.0013, watch for further upside; if it breaks below the 1.001 support, the short-term structure may weaken. Markets are volatile; for observation only.
post-image
RLUSD+0.00%
🔹A Supercharged Market Week Is Here! U.S. Midterm Elections, Jobs Data, and Earnings From Apple and
live-cover
LIVE2,020
#ETHPullsBack #ETHPullsBack
The cryptocurrency market is once again attracting attention as Ethereum (ETH) faces selling pressure and pulls back from its recent price levels. After periods of bullish momentum, a correction can create uncertainty among traders and long-term investors. Some see this decline as a normal market adjustment, while others are wondering whether more downside could be ahead.
But one thing is important to remember: not every price drop means the bullish trend is over.
**1. Why Is Ethereum Pulling Back?**
There can be several reasons behind Ethereum's recent weakness. Pr
post-image
ETH-1.26%
BTC-0.67%
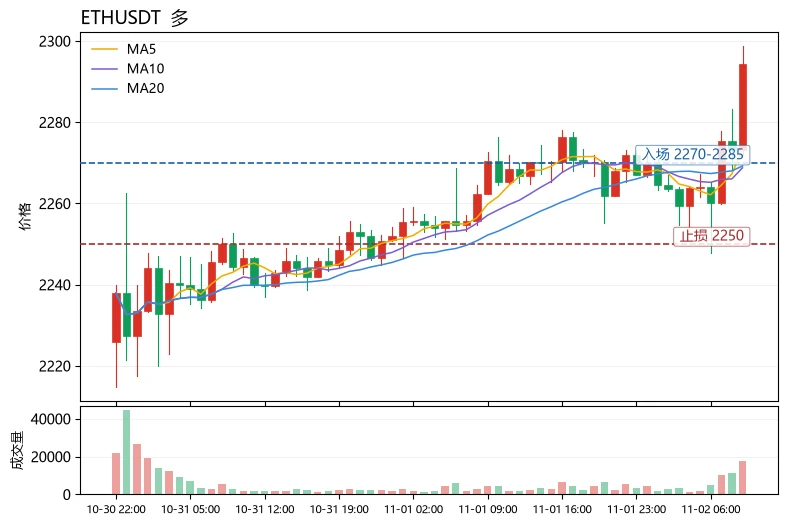
Can you still go long amid fearful sentiment? Yes, but only with a “small position and tight stop,” not a heavy bet.
$ETH The current price is 2294.43, above the Bollinger upper band at 2284.13. MA5 (2273.43) is above MA20 (2269.24), and the MACD histogram remains bullish at +1.501; the trend structure is intact. However, RSI at 69.3 is nearing overbought territory, and the 30-candle range is only about 2.22%. Volatility is low, meaning an upward breakout needs confirmation from increased volume; otherwise, it could be a false breakout followed by a quick pullback. The funding rate is -0.0015%
post-image
TRX+0.42%
11.02 ETH Market Analysis
Short: around 2310–2330, stop loss at 2345, targets 2270/2245.
ETH is currently at 2291. Price made a swift V-shaped rebound from around 2245, reaching a high of 2297 before facing resistance. It is now consolidating at elevated levels near 2290. Consecutive upper wicks indicate heavy selling pressure at the 2300 psychological level, and bullish momentum has clearly faded.
Chasing longs after a sharp rally offers a very poor risk-reward ratio, and 2310–2330 is a dense overhead supply zone from the previous decline. With strong resistance overhead, wait for a rebound t
post-image
ETH-1.23%
Once you've been utterly crushed in this line of work, you'll understand: the market never lacks opportunities; the hard part is keeping yourself in check. Most losses come from being unable to sit through volatility and rushing into trades.
This is a brutal game. There are stars everywhere who shine briefly, but very few “old-timers” survive. People who fivefold their money in a day are everywhere, but those who double their accounts over a year or two are few and far between.
There are no get-rich-quick fantasies here. Those chasing fast, massive profits will most likely be disappointed. In
XAUUSD+0.84%
  • 9
PEPEUSDT Short-Term Weakness: Key Levels to Watch After a Low-Volume Dip
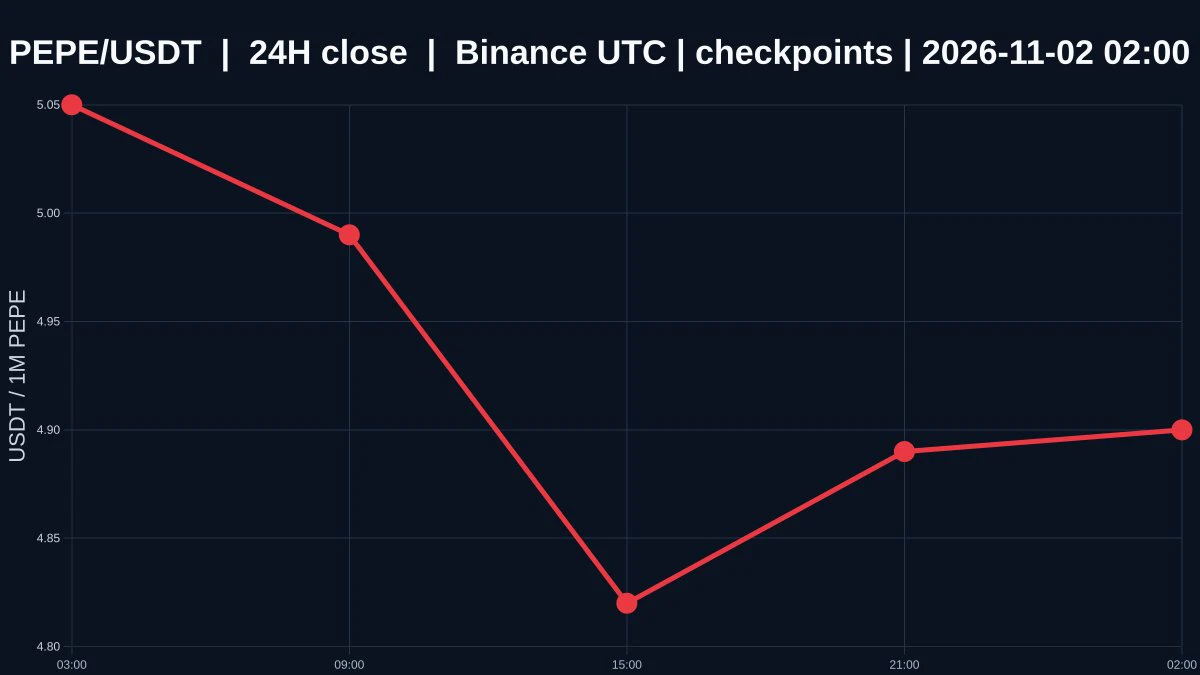
$PEPE The current price is 0.0000049, down 3.543% over the past 24 hours, with an intraday high of 0.00000509 and low of 0.0000048. On shorter time frames, the 1-hour trend is weak, and the 4-hour trend is also weak. Both time frames are moving in the same direction, with no clear signals of divergence between bulls and bears. However, their shared weakness suggests downside momentum remains in place, with no clear bottoming structure. In a multi-time-frame analysis framework, the short- and medium-term directions have no
post-image
PEPE+0.97%
We are back in China for the last phase of Canton fair #cantonfair
post-image
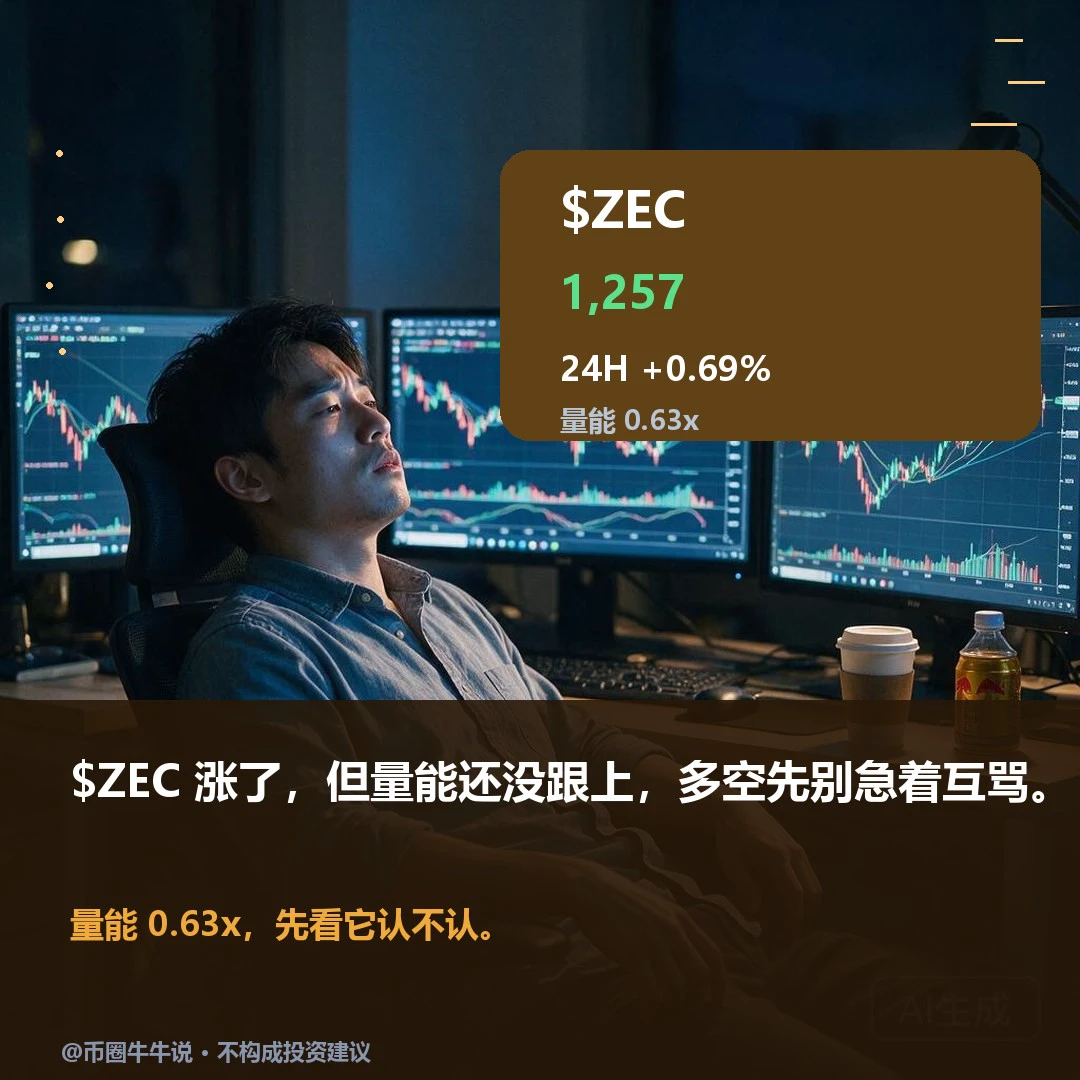
Somewhat bullish, with $ZEC currently at 1,256.85. The one-hour and four-hour trends are both somewhat bullish, but trading participation during this rally is less than 70% of average: there’s direction, but not participation.
Price is just a step away from the resistance level at 1,260.66, yet trading volume remains noticeably weak. If the bulls are really driving the move, why is volume still below 70% of usual?
Only if the price holds above resistance for an extended period will the bullish view merit reassessment; if it pulls back and fails to hold the intraday low, the bearish side will p
post-image
ZEC+1.16%
morning market
live-cover
LIVE2,007
Many people mistake a sharp rise for strength, then chase high-volatility coins and get tossed around; true relative strength should be measured against others in the same sector—the one with lower volatility and a steadier structure is often where capital is willing to stay.
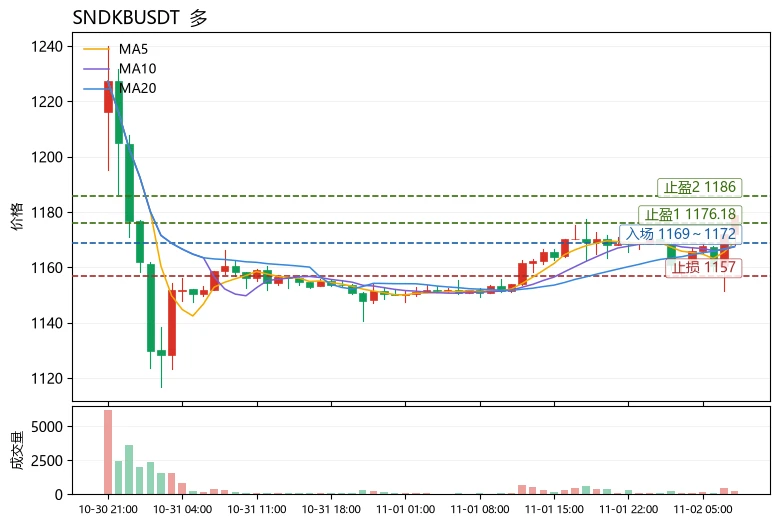
$SNDKB is currently at 1178.89, up 2.41% in 24h, with a trading volume of 7.6M USDT. Compared side by side with the concurrently active $TRUMP and $NEAR : $TRUMP is up 9.75%, but its RSI has already reached 72.8, its 30-candle range is about 12.28%, and its funding rate is +0.0050%, making it a high-volatility asset wi
post-image
SNDKB
SNDKBSNDKB
Four.meme
MC:$3.87KHolders:1
0%
TRUMP-0.95%
NEAR+1.17%
What Is Trading Signal Confluence? Why Do Multiple Indicators Sending Similar Signals Still Not Guarantee a Successful Trade?
In cryptocurrency trading, traders often use moving averages, RSI, MACD, trading volume, and support and resistance analysis at the same time. When multiple signals point in the same direction, many people assume the probability of a successful trade must be higher. But having more signals does not mean there is sufficient evidence, nor does it mean the market outcome is certain.
First, what is trading signal confluence?
Trading signal confluence refers to different ana
post-image
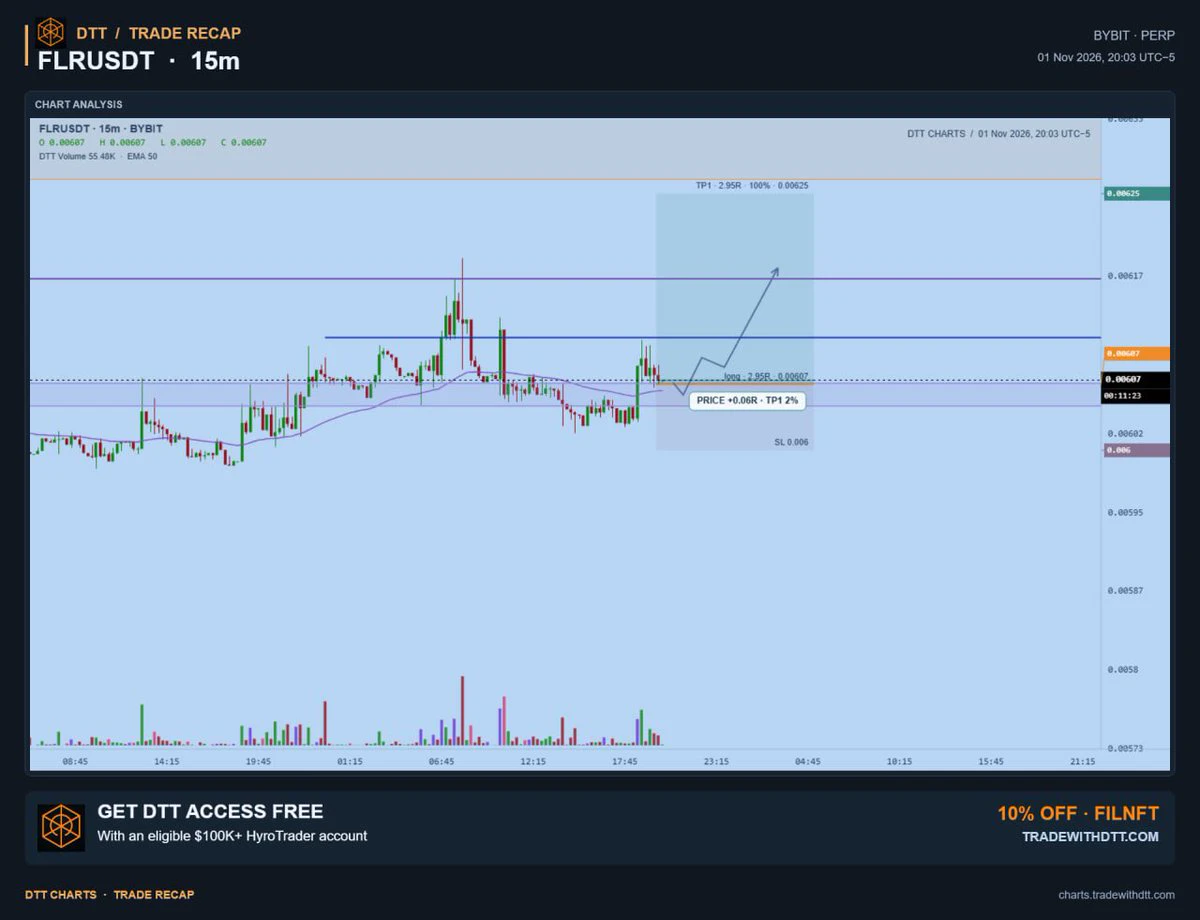
$flr long.
DTT corrective B setup.
post-image
FLR-0.24%
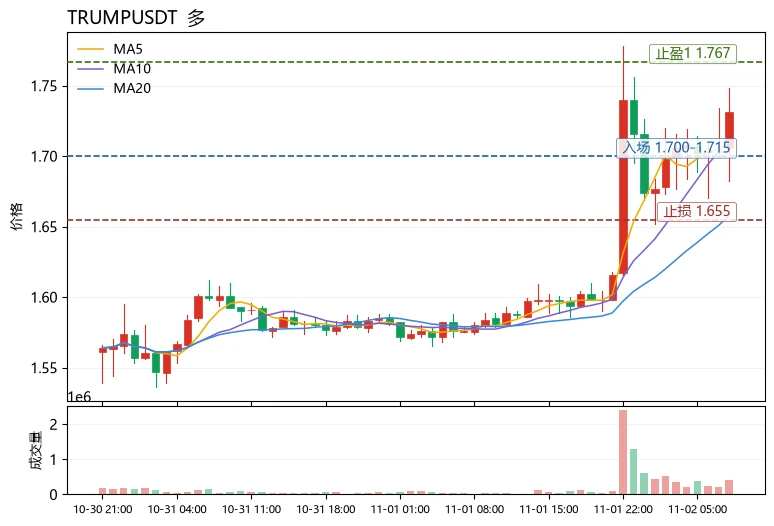
$TRUMP Key price levels: resistance at 1.767 above, support at 1.71 below, and the current price of 1.731 is between them, closer to the upper end.
The Fear & Greed Index is just 37, putting the market in the fear zone, but $TRUMP has bucked the trend with a 24h gain of +9.56% and a trading volume of 13.4M USDT. This is a typical rotation into assets attracting concentrated capital in a weak market—when broader market sentiment is subdued, hot money tends to target high-volatility, small-cap assets. Technically, MA5=1.71 has moved above MA20=1.65795, with short-term moving averages in a bull
post-image
TRUMP-0.95%
SOL-0.77%
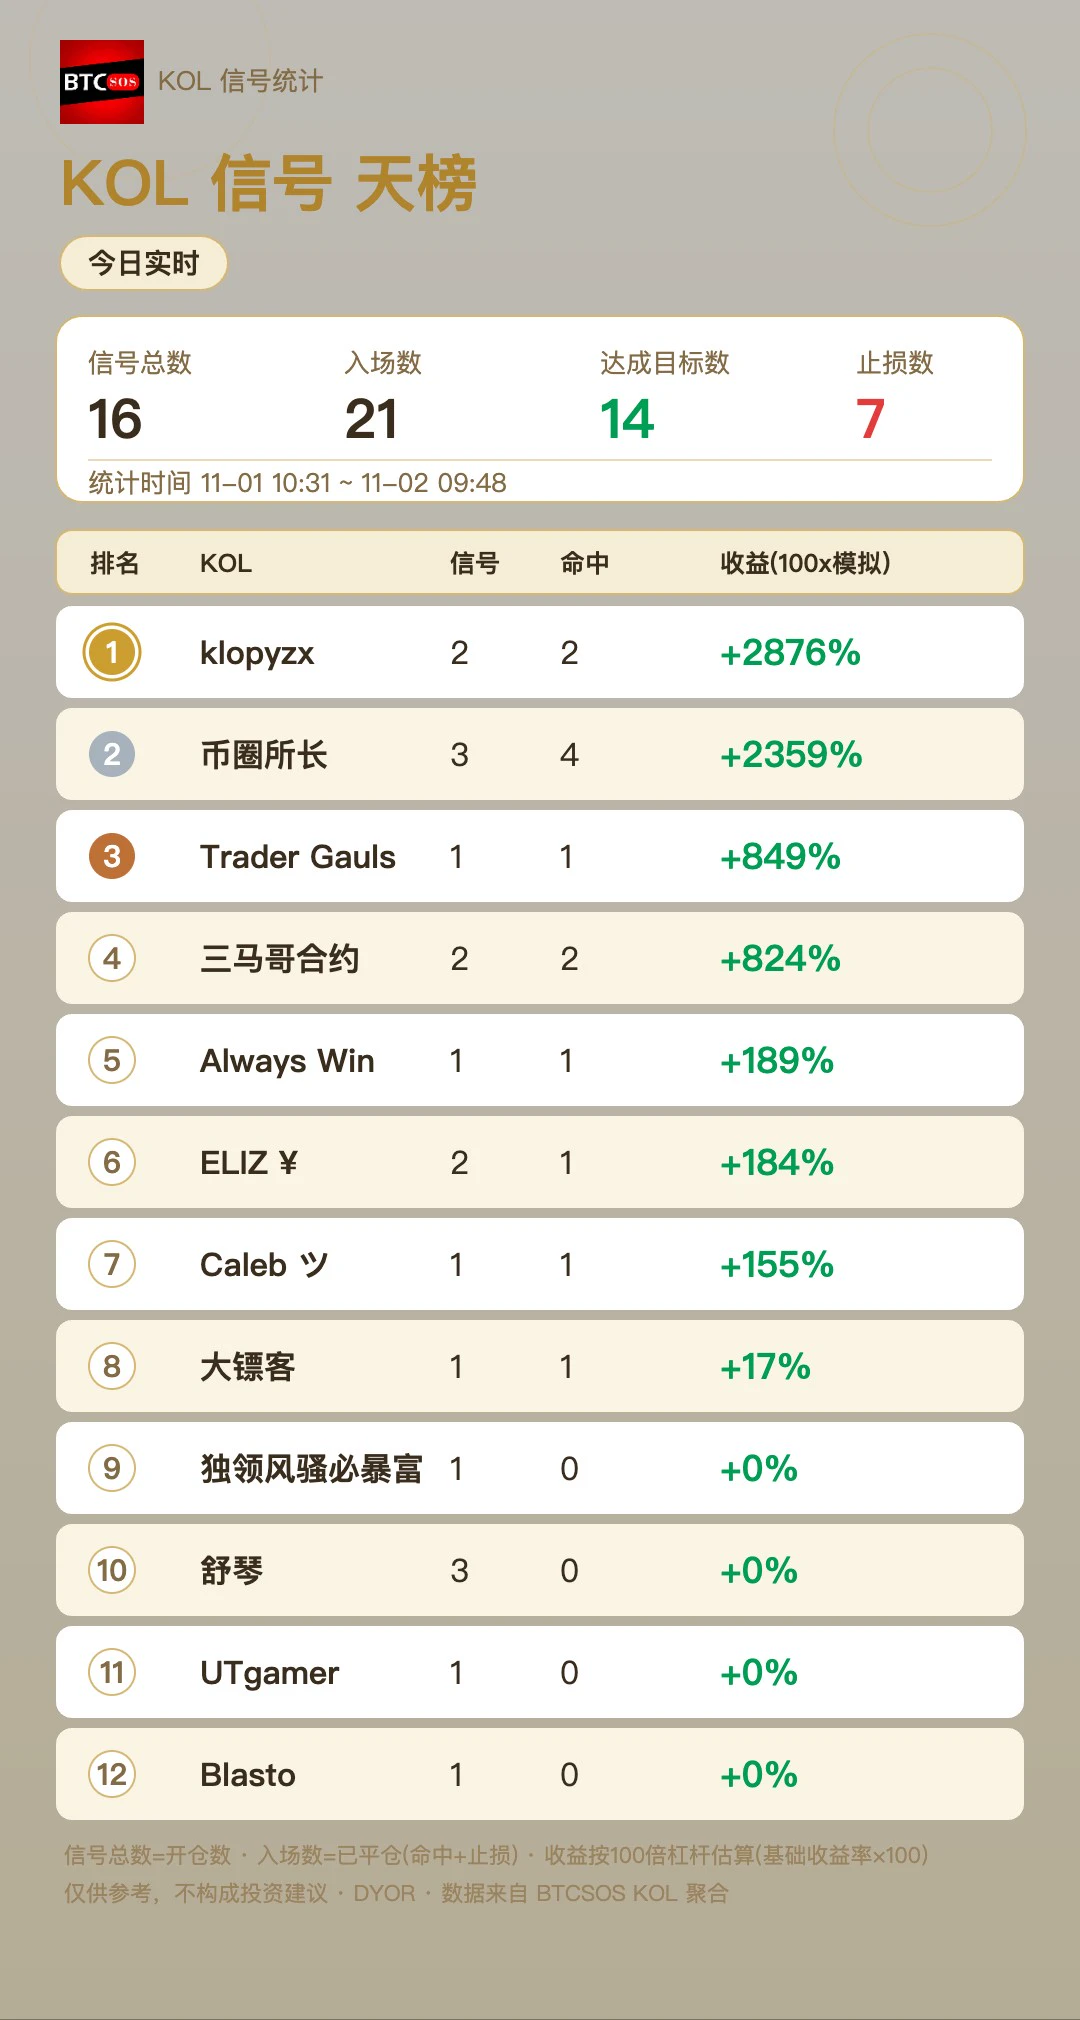
Today’s KOL leaderboard is out: klopyzx went 2-for-2, topping the chart with simulated returns of +2876%; 币圈所长 settled 5 trades with 4 wins, close behind at +2359%. The entire TOP5 posted at least +189%, with 14 wins out of 21 settled trades overall. Don’t get carried away by the numbers, folks—high returns come with high leverage in simulated trading, so just take a look. Before copying any trades, think carefully about whether your own position can handle the risk 😤 See the image for the full leaderboard. Shared as a personal record, not investment advice. By the way, klopyzx also topped th
post-image
I could never decide what to redeem the points from my JD Plus membership for. Then I got a notification today—problem solved, they’ve expired and are now worthless, so no more agonizing over it 😭
post-image
Load More

Join 40 M users in our growing community

⚡️ Join 40 M users in the crypto craze discussion

💬 Engage with your favorite top creators

👍 See what interests you

Trending Topics

USMidtermsEnterFinalStretch

576 Views168 Discussing

The U.S. midterm elections are entering the final stretch, with control of both chambers of Congress still at stake. Inflation, energy prices, tariffs and economic policy remain key voter concerns, while the result could shape fiscal, trade and regulatory policy over the next two years. If the balance of power in Congress changes, which policies could be affected first? How might U.S. stocks, gold and crypto trade the election outcome? Are you watching fiscal policy, tariffs or crypto regulation most closely?

BTC大跌

561.73k Views39.97k Discussing

IntelBeatsEarningsButStockPlunges

53.98k Views1.11k Discussing
View More