





Square
Following
Hot
News
Profile
Share your thoughts
placeholder
Article
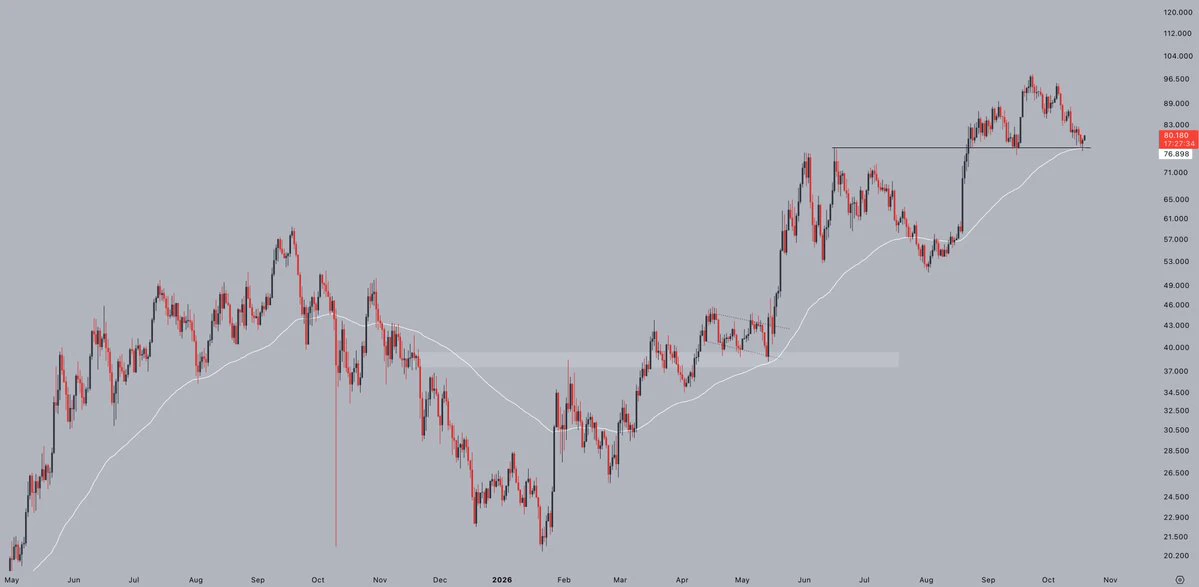
An unpopular take: $INJ ’s current +10.99% gain is not as conclusive as it looks.
$INJ is currently at 8.423, up +10.99% over 24 hours. The 1-hour support is 7.061, resistance is 8.562, and current volume is 0.77 times the average volume of the past 20 periods. What is truly useful in these numbers is where 7.061 and 8.562 are containing the range.
This is where I currently stand: I acknowledge that the trend is strong, but what matters next is not how much higher it can surge, but whether buyers step in during the first pullback. The 1-hour trend is strong, with an RSI of 86; the 4-hour trend
post-image
INJ+10.95%
Short-Selling Analysis of the Biggest Decliners: Real wealth is hidden in the red candlesEveryone is mesmerized by green candlesticks. Chasing pumps, chasing hot trends. But where is the real opportunity? It is right in front of you—in the red candles. Most people are too afraid to touch them. These four coins are weakening sharply. The market structure has already broken down. Sellers are fully in control. This is not a pullback, but a trend. Smart money positioned itself long ago. I have carefully examined every chart. No hype, just letting the charts speak. $TRUT
Risk level: HighEntry price
post-image
Layout: Bitcoin, Ethereum, Dogecoin
live-cover
LIVE880
  • 4
Everyone watching SYMBOL long is about to get blindsided by a sharp drop.

$MU /USDT - SHORT

Trade Plan:
Entry: 927.98 – 934.84
SL: 964.38
TP1: 906.68
TP2: 890.19
TP3: 865.47

Why this setup?


Debate:
Are we testing TP2 or is 994.50 about to flip this setup?

⚠️ Personal market analysis only. NFA — manage risk and DYOR.
Educational content, not investment advice or a recommendation to buy, sell, deposit, or withdraw any asset. No paid promotion or referral/affiliate links.
MU+2.12%
Sky has burned 7.37M SKY in its second monthly burn, roughly 2.6x the 2.86M SKY removed in the first. Each burn is funded by 5% of Sky's monthly net protocol surplus.
@SkyEcosystem
SKY+0.96%
$ENA Right now it feels like a multiple-choice question with no standard answer, but the answer will not be hidden in emotions.
First, let’s copy the full question: $ENA is currently at 0.2051, up 4.32% over 24 hours. The 1-hour support is 0.1825, resistance is 0.2069, and current volume is 0.43 times the average volume of the past 20 candles. The 1-hour trend is strong, with RSI at 80; the 4-hour trend is strong, with RSI at 46.
The angle I’m watching is that $ENA remains strong, while the crowded positioning is already on the table. I acknowledge that the trend is strong, but what matters ne
post-image
ENA+4.73%
$TOLLY let’s go 5X
post-image
TOLLY-2.28%
$MARSCOIN is currently in a high-volatility, weak-trend phase. Conclusion first: short-term bias is bearish; chasing longs is not recommended. If it rebounds to around 0.0782, a small short position may be cautiously attempted, but a hard stop-loss must be used.
The reasoning is as follows. MARSCOIN is currently at 0.0772, down 5.04% over 24h, with the amplitude over 30 candles reaching as high as 15.93%. Its volatility is significantly higher than BTC's 3.44%, making it a typical high-risk asset. In terms of moving averages, MA5=0.07824 remains above MA20=0.07621, so the apparent bullish ali
post-image
MARSCOIN-5.67%
BAT+28.31%
BTC+0.46%
1016 $DOGE Recent entry position for DOGE—just look at the daily chart. Every time the broader market makes any move, DOGE starts falling in advance.
I've bought at 0.06888 many times before and played the August range quite a bit. The last time, I held DOGE until it started moving at 0.083 and then exited. I haven't really watched DOGE since, because I think DOGE can sometimes be difficult to trade short-term.
We'll continue placing long orders around 0.06888 and 0.07, with a stop loss at the bear-market low of 0.067. Keep the stop-loss range slightly wider. Leave this long-term lottery orde
post-image
DOGE-0.55%
This woman is very wealthy, but she’s genuinely low-key.
$FET took me through a trade like this: the hardest part is knowing when to exit.
This feels like a good spot. Close the position right here. Watching these two today: $SO and $BAT .
post-image
FET+4.90%
BAT+28.31%
$CORE Everyone, do you think it will reach 2u?
post-image
CORE+0.48%
If you had put $10,000 into Richard Heart’s Hex token at the 2021 all time high you would only have $11 left and be down over -99.9%.
post-image
$SNDK
Key levels respected; bounced from the $1,279.29/share support zone
I will only pick this at $995.69/share, or I leave it
#NFA
SNDK-0.56%
$ETH Going To Push Up For More 👀
post-image
ETH+1.40%
With the same 1000U, some people are holding the bag at $WAL 0.0677, while others who bottom-fished at 0.0502 are already laughing. It is now 0.0512, down 15.7% in 24 hours, with a 565M trading volume—what does that indicate? Panic sellers are fleeing, but with selling this fierce, who is taking the other side?
Round one: the volume showdown. A 565M trading volume at this market-cap level means the turnover rate has been pushed to the limit. Rising volume during a decline either means the main players are unloading or that the market is shaking out and rotating holders. What is the difference
WAL-21.09%
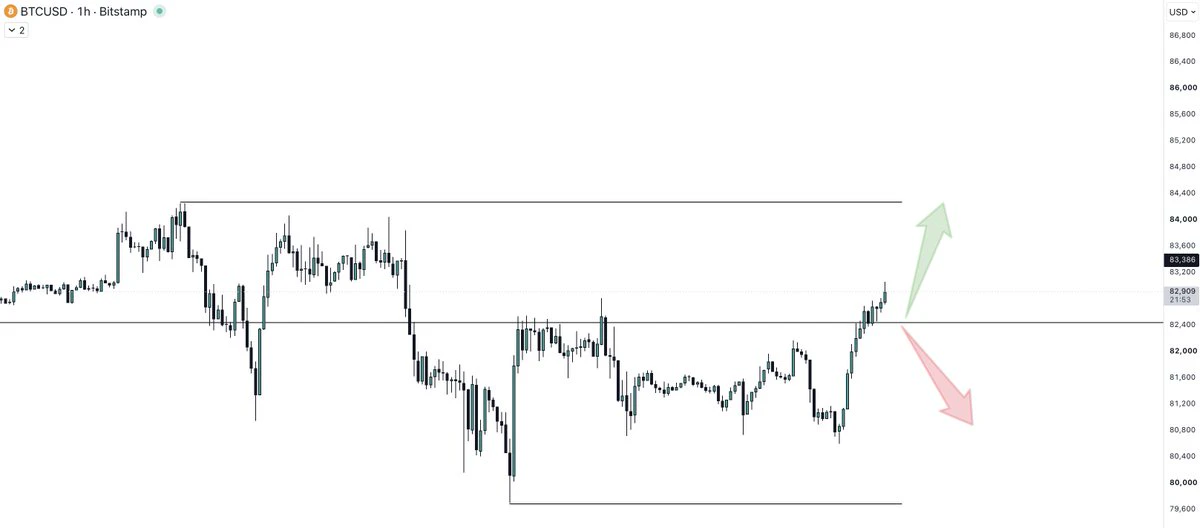
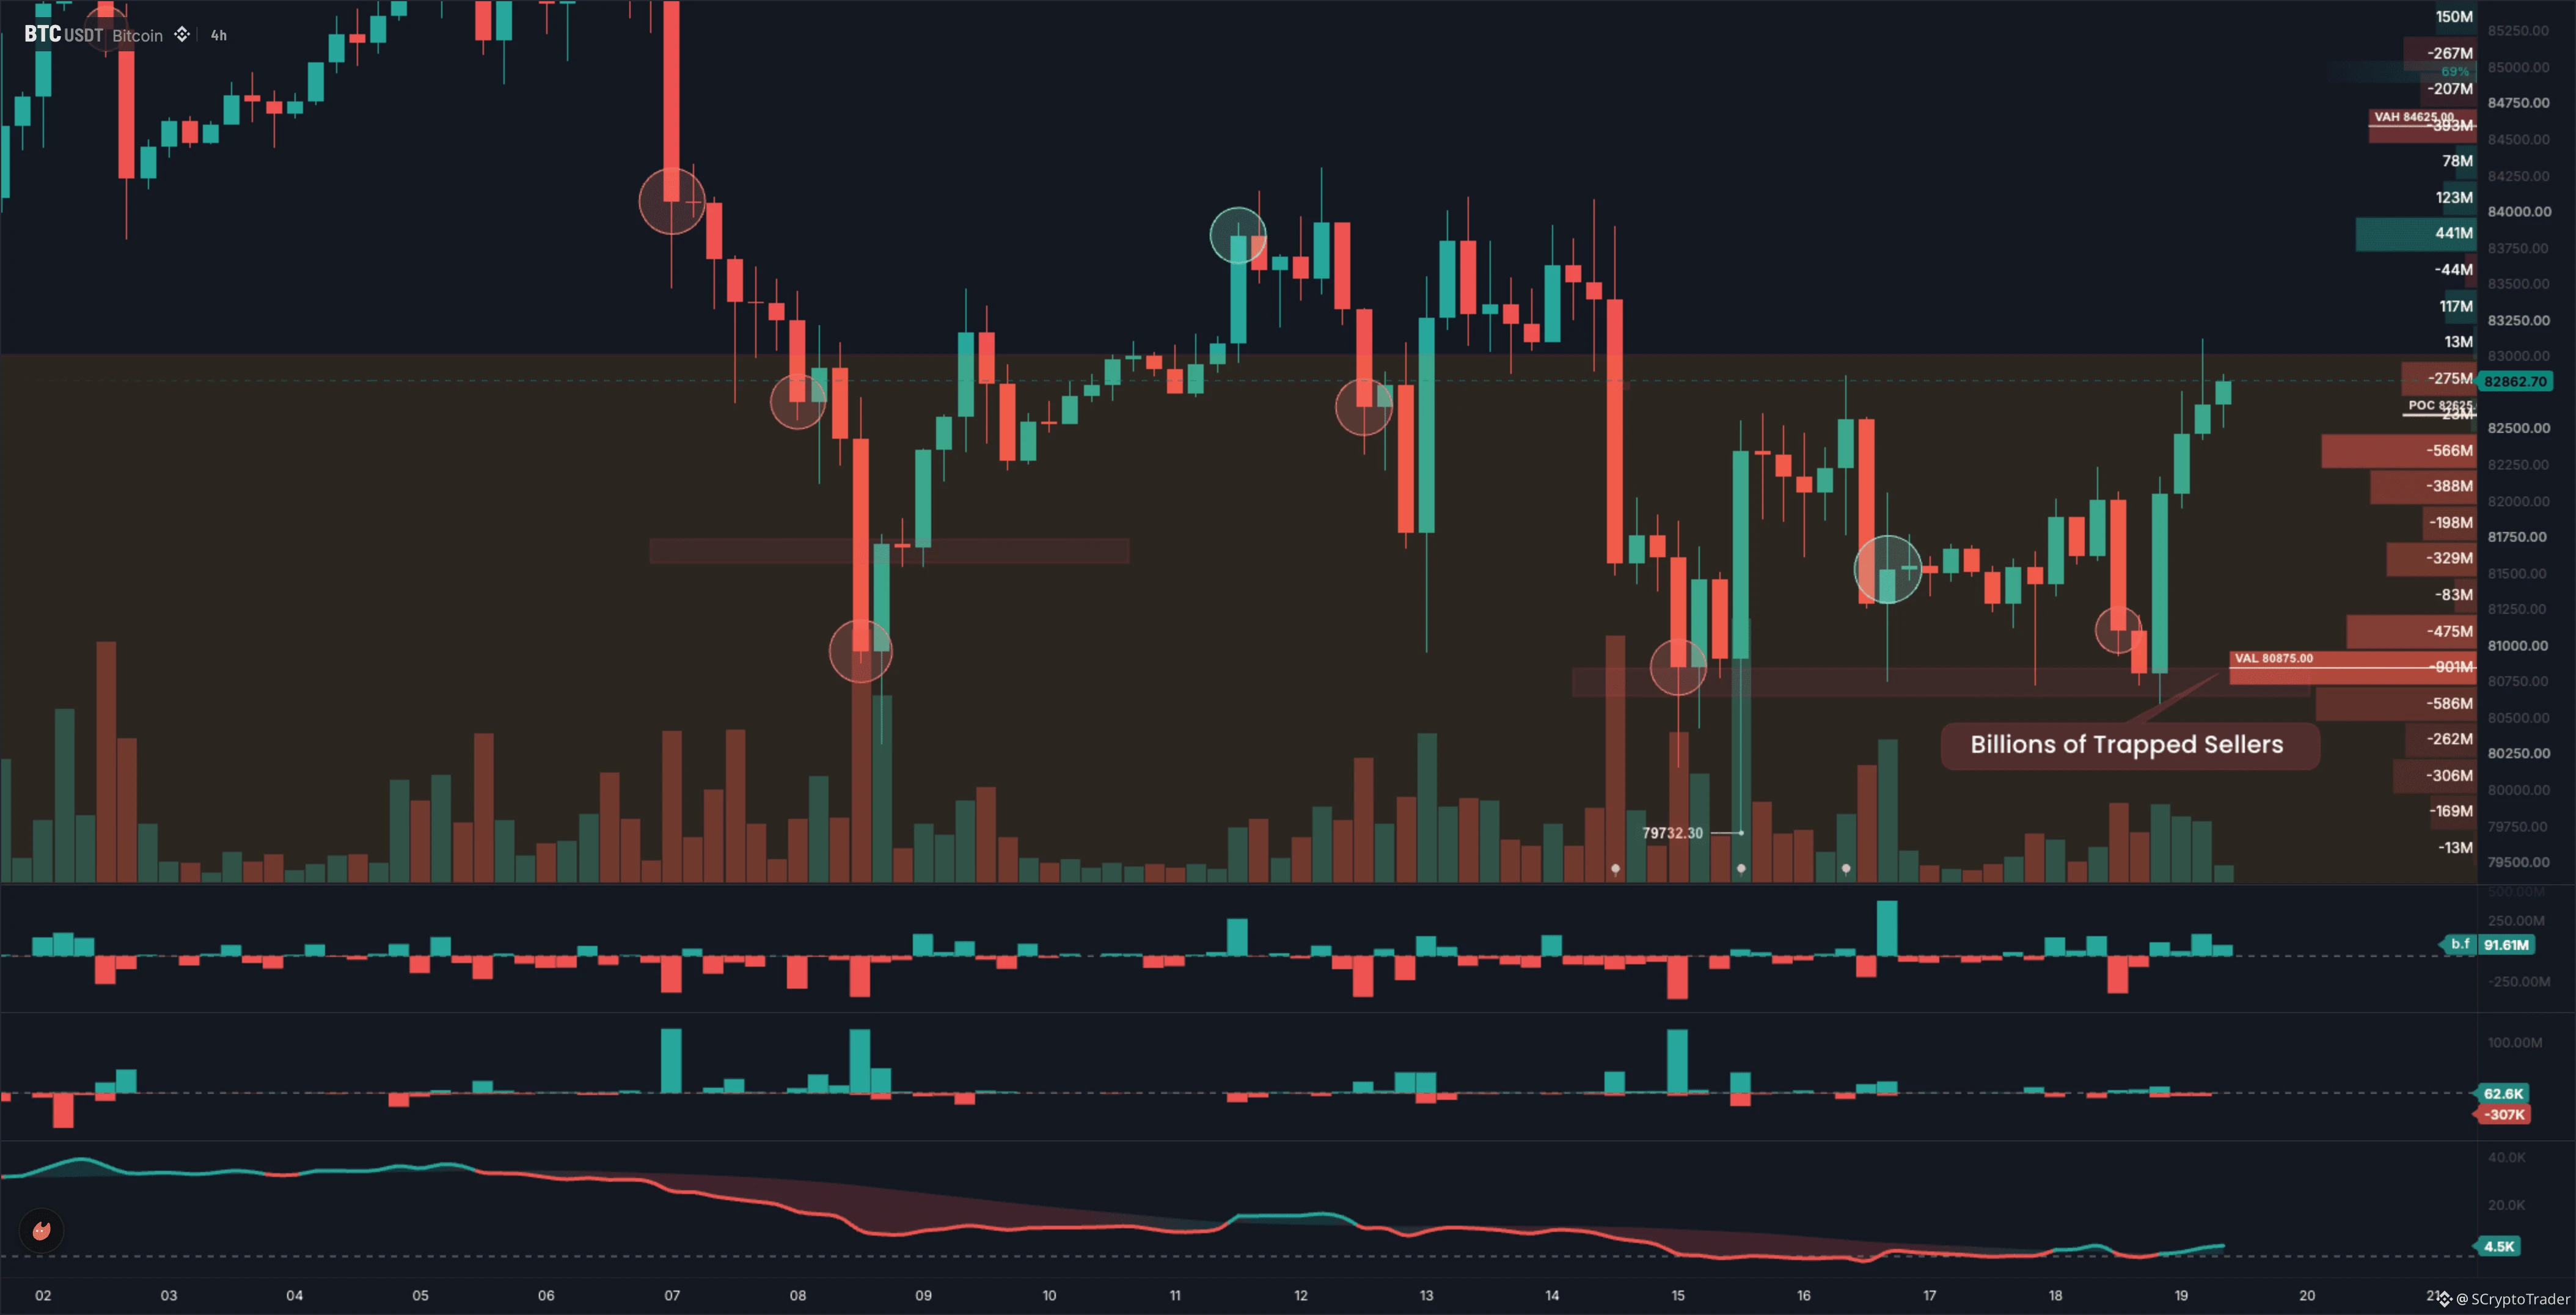
Honestly, there is still support below overall, and it has been holding above 82000, but I still couldn’t hold on. I’ll take profits first and redeploy later. 😁
post-image
$QNT
A steady grind lower all the way, with longs liquidating longs—everyone trying to catch the falling knife got buried.😤 A rebound to 213.7 is the window to escape; if 201.8 breaks, it will head straight down. Don’t wait until the waterfall comes to run.
post-image
QNT-0.02%
Bitcoin Support and Resistance Levels
live-cover
LIVE66
Load More

Join 40 M users in our growing community

⚡️ Join 40 M users in the crypto craze discussion

💬 Engage with your favorite top creators

👍 See what interests you

Trending Topics

USSeptemberPPIBeatsExpectations

91.35k Views1.88k Discussing

US September PPI came in at 6.3% YoY, well above the 5.3% market expectation, pointing to renewed producer-side inflation pressure. Weekly jobless claims were 199K, broadly in line with forecasts. Could hotter inflation further reduce room for rate cuts, and what does it mean for $BTC, US stocks, and gold?

DrLinHanSpeaksAtOxfordUnion

135.63k Views1.86k Discussing

JapanAndKoreaStocksPlunge

47.27k Views1.76k Discussing

View More