



Square
Following
Hot
News
Profile
Share your thoughts
placeholder
Article
Initial jobless claims fell to their lowest level since 2022, and layoffs are down, but don’t rush to call it a soft landing. Weekend trading volume is only 30% of weekday levels—what can that kind of volume really tell us? The logic behind yield farming now applies to macro as well: as soon as the data improves slightly, people start front-running. I’m not chasing it, for one simple reason: fewer people receiving unemployment benefits doesn’t mean more people are hiring. The Fed is watching.
post-image
Not a single dollar moved in 16 years.
Satoshi holds 1.096M $BTC , now worth $93.12 BILLION.
And he's never touched it.
The ultimate diamond hands.
post-image
BTC-3.11%
Shorting the 4,160 level has been so smooth; the decline hasn’t bottomed out yet, and we’re waiting for the data to push it lower
10.15 BTC Analysis
The current market is showing a typical bearish alignment. After touching a high of 84322, the price formed a bearish engulfing pattern, followed by a continuous descending channel. Recent candlesticks have consecutively closed with solid bearish bodies, accompanied by long lower shadows reaching 80458, indicating some buying support below, but the overall center of gravity continues to move downward.
In terms of technical indicators, the price has decisively broken below the lower Bollinger Band at 80694, while the bands are widening downward. The middle band at 81400 has s
post-image
BTC-3.11%
TOTAL3ES weekly 50/200SMA combo death cross + 365 SMA
Did you know, that the closer price is to a Death Cross (or Golden Cross) when the signal fires, it tends to be more accurate and better capture the emerging trend?
This is because the further price moves away from the averages, the more overbought or oversold it is, and it is more likely to mean revert or already be nearing a trend's end
If you start from mean reversion, you tend to capture more of the trend that gets disconnected from the mean
Know what I mean?
Below the averages the asset leans bearish. Above, leans bullish
Altcoins must
post-image
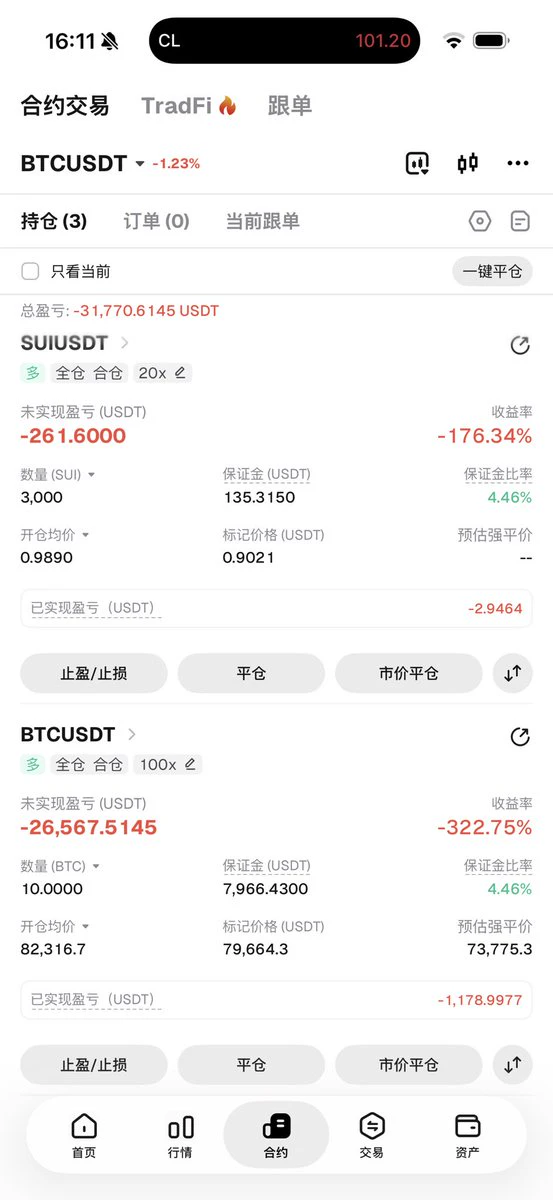
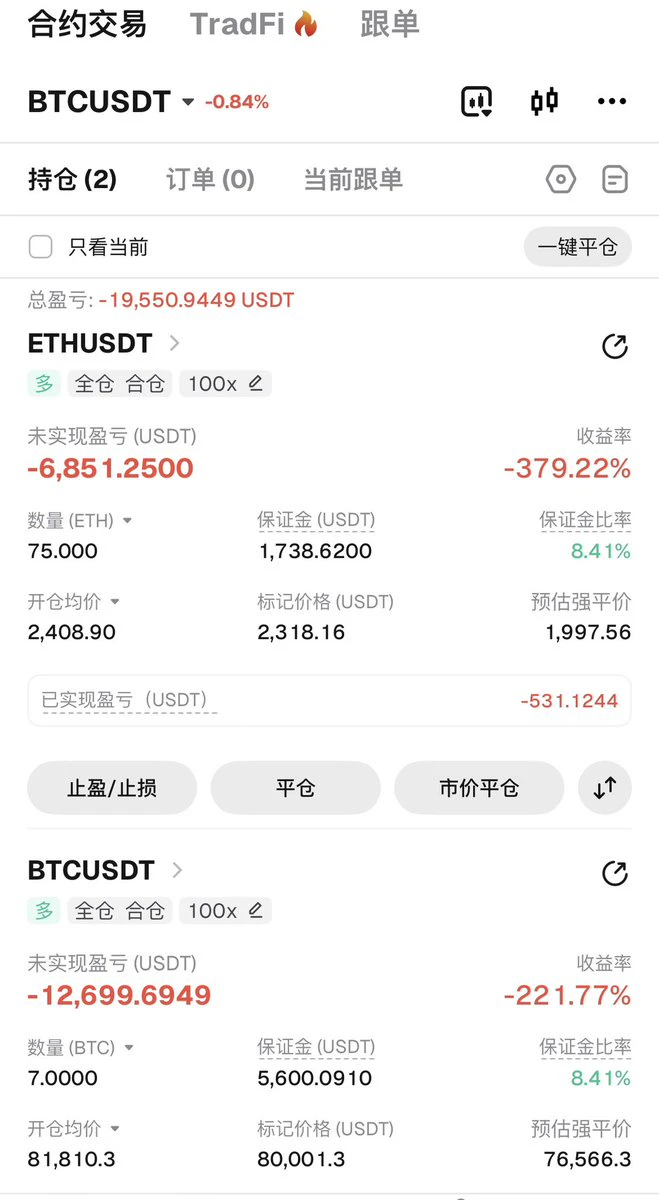
$MVLL I entered at 31.8, and it's at 27.56 now, for a 13% unrealized loss. I own this trade. I watched it surge to 36.57 yesterday but didn't sell—got greedy. Then it plunged -22.84% in 24h. The 58.4M trading volume shows the selling pressure was real money hitting the market, not a fake dip.
One-line review: chasing the pump destroys everything. It broke above the previous high on heavy volume, and I impulsively chased in at market. I set my stop-loss too far away, and when it fell to 30, I was still thinking, “I'll exit on the rebound.” Instead, it kept dropping all the way to 27.26.
My reco
MVLL-17.40%
BlockBeats News: On-chain analyst Ember reported that the pump token has fallen 16% over the past 24 hours. An address sold 1.264 billion pump tokens through an on-chain transaction 7 hours ago, receiving $5.483 million in USDC at a sale price of $0.0043. Since it sold everything in a single transaction, the address suffered 5% slippage. If the sale had been split into multiple transactions, it was expected to receive $5.78 million, but the single-transaction sale yielded only $5.48 million, resulting in $300,000 less.
post-image
PUMP-15.66%
USDC+0.02%
AI hot stocks face a broad sell-off! Optical communications lead the decline, while chip and memory
live-cover
LIVE2,418
#美国9月PPI数据公布 #每周来晒 US September PPI exam begins tonight at 20:30: CPI has already pushed the probability of an October hike to 42%. Will PPI deliver a “final blow” or call a halt?

I. First, the forecast: PPI will likely “remain elevated,” but the key is the “structure”
Market expectations: US September headline PPI is expected to rise around 0.6% m/m, continuing CPI’s “energy-led” characteristic—the inflation pressure at the production end is “significant, but structurally narrow.”
My forecast: The probability of headline PPI exceeding expectations is not high (oil prices have already been
BTC-3.11%
GLDX+0.59%
PAXG+0.01%
  • 2
$ETH is setting up for a potential daily swing long.
Entry: $2,358
Target: $3,433 (+45%)
Stop: $2,095
The falling trendline is the key hurdle. $2,934 is the first major checkpoint.
Get up to 6,200 USDT
#ETH
ETH-5.63%
#USSeptemberCPITopsEstimates
The September 2026 U.S. Consumer Price Index (CPI) report has put global financial markets under renewed pressure. Released on October 14, the data reinforced concerns that inflation remains stubbornly high, potentially forcing the Federal Reserve to maintain restrictive monetary policy for longer than investors had hoped.
For crypto traders, stock investors, and precious-metals holders, the message is clear: inflation data can change market expectations within minutes. However, the real question is whether this selloff marks a temporary correction or the beginnin
BTC-3.11%
ETH-5.63%
SOL-4.96%
XRP-5.15%
BNB-3.04%
  • 2
  • 1
Gold and silver moved higher together today.
Gold rose 1.7% in a day, while silver climbed even more aggressively.
On the crypto side, the entire market dropped by more than 5% that same day.
Yesterday’s September CPI came in at 3.7% year over year, higher than expected.
Gasoline prices rose 9.1% in one month.
The odds of a rate hike at the meeting later this month jumped from 20% to 50%.
Crypto has been carrying the “inflation hedge” label for years.
Today, gold and silver are where the money is flowing.
Ethereum fell 5% in a day, dropping harder than Bitcoin.
I’m still hold
post-image
GLDX+0.59%
PAXG+0.01%
GAS-4.35%
ETH-5.63%
BTC-3.11%
U.S. stock pre-market assessment
Three days ago, I mentioned concentration + the debt issue of losing both chambers
U.S. stocks plunged in response
The current situation is actually the script of falling first and rising later during the midterm elections
Then add in the expectation of losing both chambers
At present, apart from some defensive consumer stocks
$mcd $jnj $wmt
This is also after concentration reached a historical extreme
Other sectors are now rebounding
But AI simply cannot stop falling
Comparable to the 2024 war crash
And the February 2026 Iran war crash
It will fall for at lea
post-image
MCD+1.01%
JNJ+2.11%
WMT+3.48%
#美国9月CPI超预期
U.S. September CPI Exceeds Expectations: Will Inflation Change the Direction of Bitcoin and Global Markets?
The global financial market is once again focusing on U.S. inflation as the September Consumer Price Index (CPI) reportedly comes in above market expectations. The latest inflation surprise has raised important questions about the Federal Reserve's next move, the future of interest rates, and the short-term outlook for stocks and cryptocurrencies.
For investors, CPI is more than just an economic statistic. It is a key indicator that can influence monetary policy, market liq
post-image
BTC-3.11%
$DOT is approaching a key trendline support on the 4H chart. 👀
This trendline has been respected multiple times, while the $1.29–$1.30 zone has acted as strong resistance.
If DOT gets a bounce from here, we could see another attempt to break above resistance. But with overall market sentiment still bearish, confirmation is important before expecting a breakout.
If the trendline breaks, we could see further downside.
Let's wait and see how price reacts here.
Not Financial Advice, DYOR
post-image
DOT-5.64%
  • 9
  • 1
During the countdown to the midterm elections, an unexpectedly high inflation reading has become a major political liability weighing on Trump and the Republican Party.
U.S. prices surged again in September, with energy costs soaring: gasoline rose 9.1% in a single month and more than 34% year over year, while heating oil jumped 74% year over year. Living costs, which have remained elevated since the pandemic, continued to worsen amid tariffs and the conflict with Iran, fueling voter anger.
Rent prices, which had previously begun to cool, unexpectedly rebounded as businesses passed on costs an
post-image
GAS-4.35%
$RATS 's arc, which fell along with it, has already rebounded 100%, while you’ve only rebounded 20%—what’s going on, little bro
post-image
RATS+6.76%
BTC, GOLD, NVDA, AMD, ETH, XRP, SOL, SOXL, ADA, SUI, BTU, HNT, PEAQ, RE: Live TA
Watch now 👉
Ethereum is testing a critical decision point while Bitcoin holds $80K and altseason hangs in the balance, with The Trading Parrot tracking the S&P, VIX and gold into PPI. We work through Solana, Cardano, XRP, Sui, Helium, RE Protocol and PEAQ, plus Nvidia, AMD and BTU. Watch the full live TA now.
00:00 AI Stocks vs Crypto: Early Bull Debate
03:44 Bitcoin-S&P Coupling and AI Bubble Risk
04:37 Bitcoin One Hour: Double Bottom or Squeeze
06:06 Open Interest Band Grows to $470M
07:56 CPI Hot, PPI Incomin
post-image
BTC-3.15%
XAU+0.04%
NVDA-3.08%
AMD-5.74%
ETH-5.63%
#日韩股集体大跌 Storage Stocks Amid Circuit-Breaker-Level Plunges in Japanese and South Korean Markets: A “Golden Pit” or a “Downtrend Continuation”? — A Systematic Review and Operational Framework

I. The Full Picture: An Extreme Market Driven by a Double Blow from “Macro + Narrative”

October 15, 2026, was the worst day of the year for Asia-Pacific tech stocks:

- Japan: The Nikkei 225 closed down 4.90% at 64,425.95 points
- South Korea: The KOSPI closed down 7.57% at 5,554 points — plunging more than 9% at one point intraday, triggering the tenth circuit breaker of the year, while the Korea Exc
post-image
JPN225-4.42%
SK Hynix-11.06%
MU-4.12%
STX-4.55%
  • 3
[New Streamer] Market Prediction
live-cover
LIVE1,944
Load More

Join 40 M users in our growing community

⚡️ Join 40 M users in the crypto craze discussion

💬 Engage with your favorite top creators

👍 See what interests you

Trending Topics

USSeptemberCPITopsEstimates

36.75k Views2.78k Discussing

US September CPI rose 3.7% YoY, above the 3.6% estimate; core CPI rose 2.6%, also above the 2.5% estimate. With inflation topping forecasts across the board, how will rate hike expectations shift? How will BTC react? Share your view.

DrLinHanSpeaksAtOxfordUnion

135.63k Views1.86k Discussing

USSeptemberPPIReleased

91.35k Views1.79k Discussing

View More