

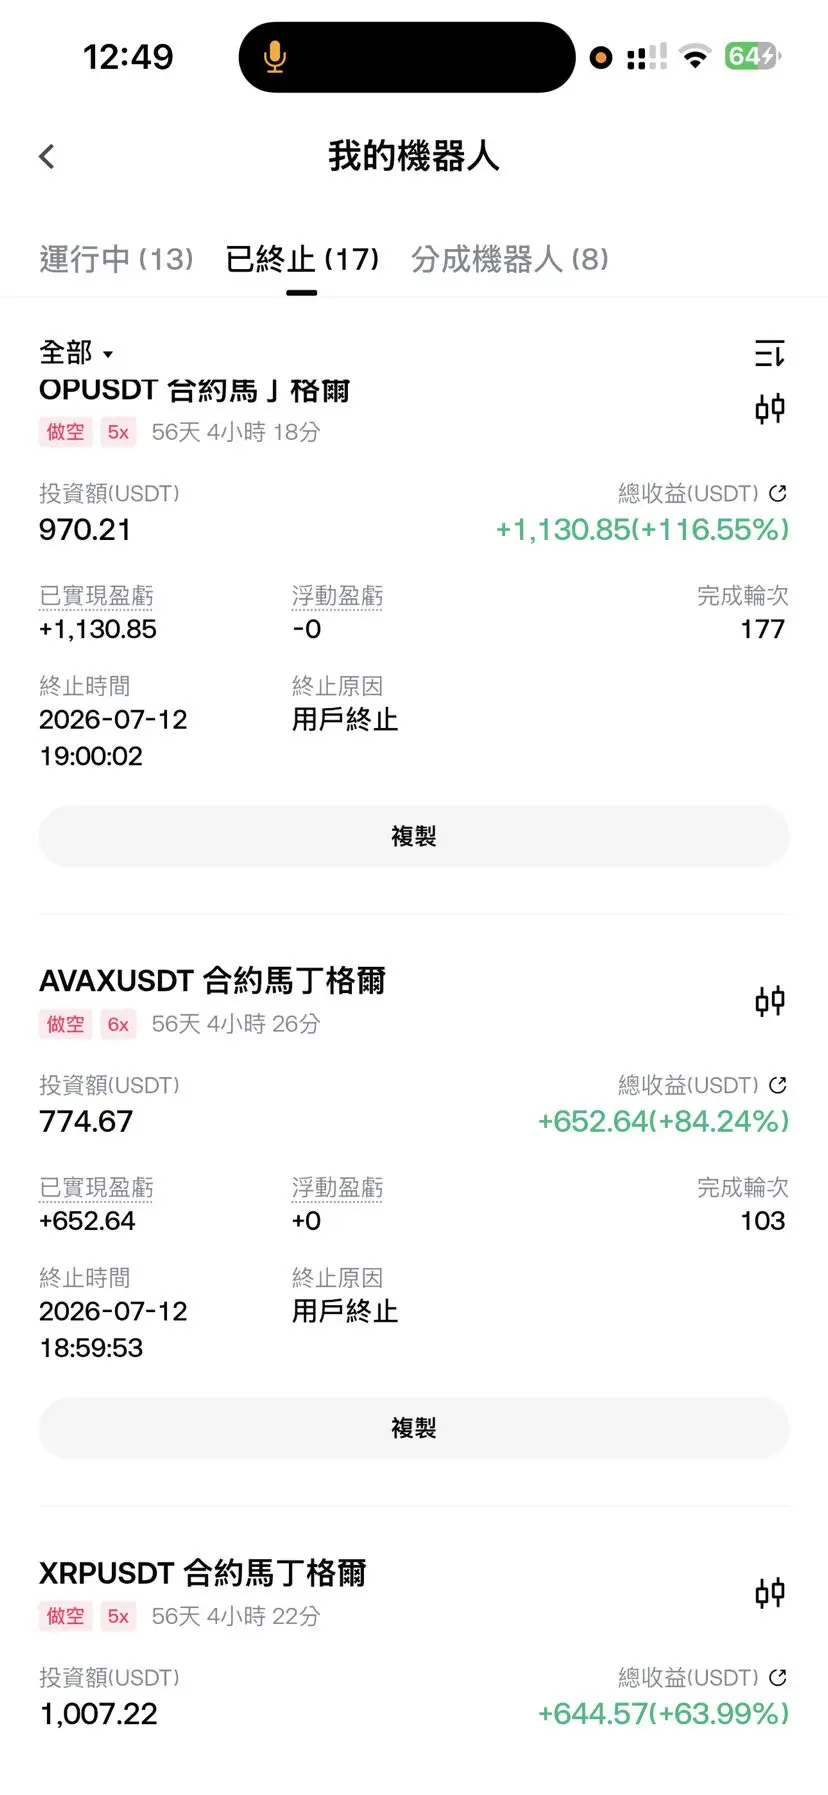
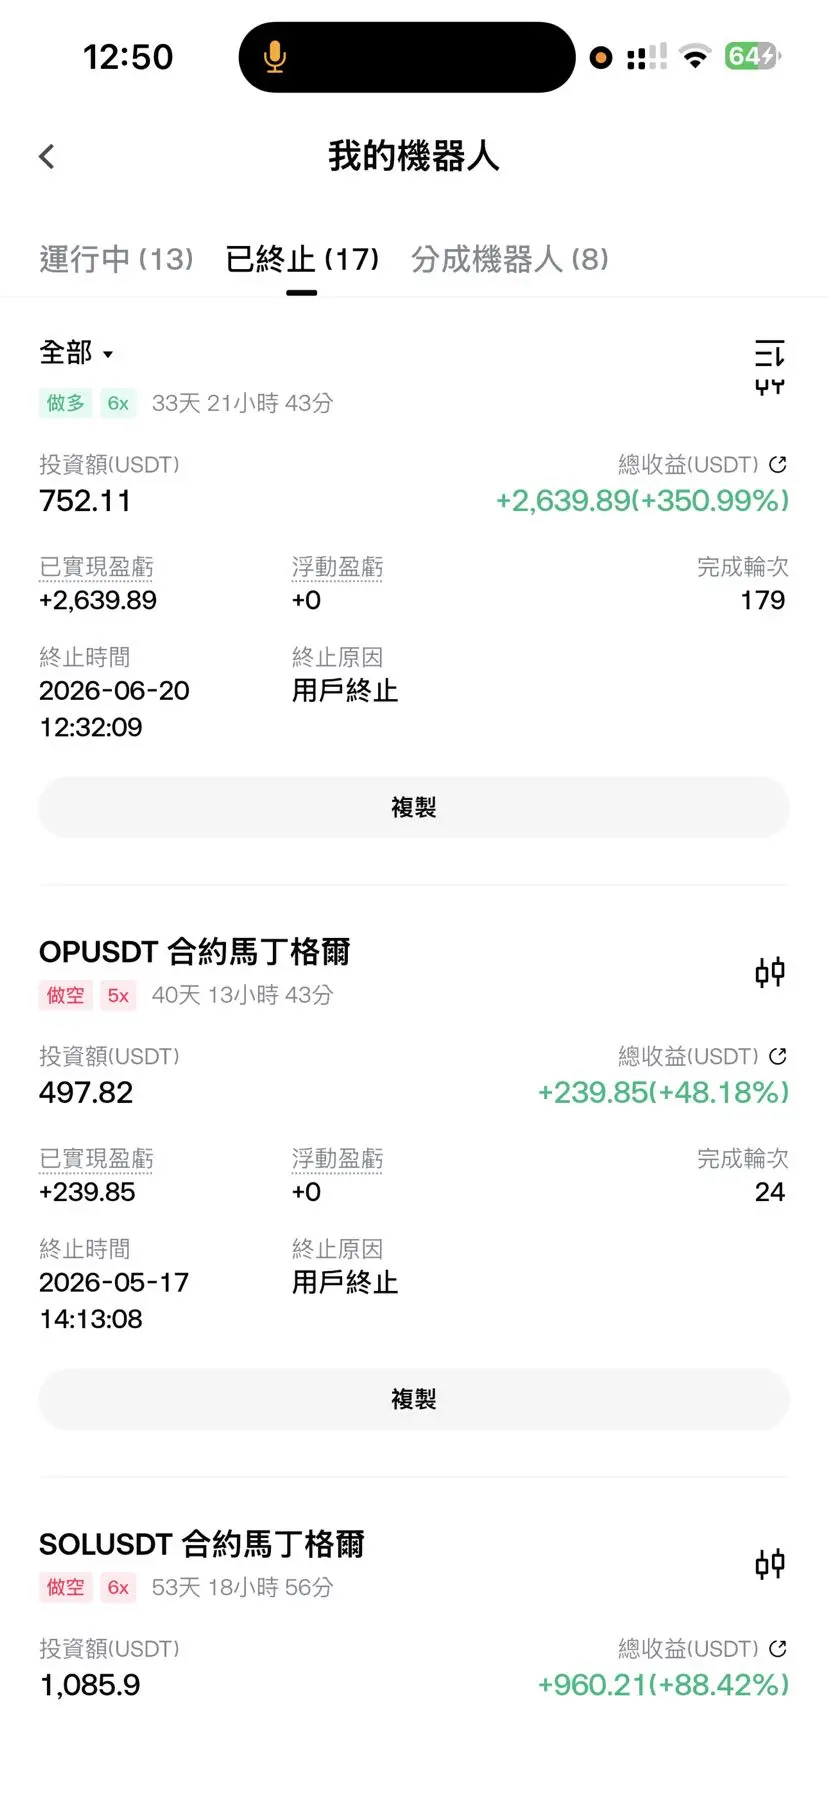

#广场预测世界杯赢40000U
FIFA made $9 billion, but it’s hard for the host country to break even—who is the real winner of this World Cup?
How FIFA turned the World Cup into a money-printing machine
The role that is “guaranteed to profit with no losses” in this World Cup is the International Federation of Association Football (FIFA). For the four-year cycle from 2023 to 2026, total revenue is expected to reach $13 billion, a 72% surge compared with the previous edition in Qatar. For the 2026 event alone, same-year receipts are already close to $8.9 billion, while total operating costs are only $3.8 billion. The input-output ratio hits 1:3.4—its money-making efficiency is something many listed companies can only envy. In the revenue mix, broadcasting rights contribute the biggest share, about $3.93B; ticketing and premium hospitality are next, expected to exceed $3 billion—3 times Qatar’s—and commercial sponsorships and brand licensing add another $1.79B. These three major segments together account for more than 70% of revenue. After the dynamic pricing mechanism debuted, the official face value for the first-tier final tickets has already reached $10,990; the secondary market has also reportedly seen outrageous deals at the million-dollar level. On FIFA’s official resale platform, each transaction charges a 15% fee to both buyers and sellers. That means when a $1,000 ticket changes hands, FIFA can additionally skim $300.
More importantly, almost all the cost burden of this business machine is pushed onto the host countries. Huge expenses such as stadium renovation, city security, and transportation support are handled by the US, Canada, and Mexico themselves. FIFA provides less than $100 million in fixed subsidies to the three hosts, accounting for under 0.8% of total revenue. Meanwhile, FIFA is registered in Switzerland and benefits from tax exemptions for non-profit organizations, so the massive profits it earns don’t need to be paid with high taxes. Team total prize money is $727 million, but compared with FIFA’s nearly $200k in annual revenue, it’s still a small slice. Put together, FIFA is projected to net more than $5 billion in profit over four years, with a profit margin above 130%.
Which host countries actually made money?
The economic windfalls split among the three hosts are drastically uneven. The US hosted 78 matches, accounting for 75% of the total. It even cornered the knockout stage, semifinals, and final—looking impressive on the surface, but the actual books are not so bright. The states combined invested about $11.1 billion in stadium refurbishments and transportation support; even at the federal level, security funding alone is $625 million. Analysts estimate the US’s overall GDP exceeds $20 trillion, and the macro boost from the World Cup is only about 0.05%, basically equivalent to statistical noise. In New Jersey alone, the investment for the final venue’s supporting facilities exceeds $100 million; while in a smaller city like Birmingham, Alabama, security expenses directly consume one-tenth of the city’s annual budget simply because it hosted matches. New York, as the final host, was forecast to gain an incremental $3 billion, but in reality hotel reservations reached only 65% of expectations, and many fans were deterred by inflated room-and-board prices.
Mexico, on the other hand, is the host with the highest relative gains among the three. Even though its absolute figure is lower than the US’s, Mexico invested only about $8 billion and mainly renovated existing stadiums. It added 800k inbound tourists; hotel occupancy in the first week of the tournament rose 16%; property prices in core urban areas jumped 3 to 5 times; and local restaurants and street vendors are expected to see a 50% increase in revenue. In the stock market, sectors like consumer spending and airports benefit directly, and small merchants and people working in service industries benefit the most.
Canada is the most awkward of the three. The two host cities each hosted only group-stage matches. Total spending is about 800k Canadian dollars, or $780 million. Toronto’s hosting cost rose from 30 million Canadian dollars at the start to 380 million Canadian dollars, more than tenfold. Vancouver’s tourism revenue increased by 1 billion Canadian dollars for the single city, but the overall input-output ratio still doesn’t look optimistic.
Good on paper, but ordinary people may not feel that way
While the macro numbers look impressive, many counterintuitive things happen when you zoom into specific scenarios. In Toronto, on the first match day, average hotel prices rose 48%, revenue per available room increased 36%, but occupancy actually fell 8%. Vancouver shows a similar pattern: house prices up 53%, revenue up 31%, but occupancy down 15%. The high prices keep ordinary business travelers and typical vacationers out, leaving the excitement largely for upscale hotels and international airlines. Food and drink inside the stadiums are also absurdly priced: in Toronto’s stadium, a beer costs $17—nearly 3 times the price in Germany; and in Miami’s stadium, a special “loaded fries” package is priced at $75. Overall spending in bars and restaurants in Toronto grew only 3%, while spending by international tourists rose 34%—but most of that money flows into the pockets of chain brands and international companies.
Commercial development around event-related merchandise also shows FIFA’s ability to “dig up money.” The official championship rings are limited to 2,026 pieces: ring numbers 1 to 30 are reserved for members of the champion team, and numbers 31 to 2,026 are put into the retail market with a price of $12k each. That means more than 98% of “World Cup champion rings” are sold to you. Broadcasters are winners too: the newly added “water break” pause rules were criticized for creating fixed ad windows for broadcasters. It’s estimated this World Cup adds about 7.5 hours of advertising inventory, bringing nearly $2 billion in incremental revenue, which directly pushes the US region’s broadcast fees to $945 million. As for the paths, stadiums, and temporary support that the host countries upgrade with real money, there is rather limited ability to keep generating returns after the event ends—whether a one-time investment can be turned into long-term assets remains a big question.
FIFA made $9 billion, but it’s hard for the host country to break even—who is the real winner of this World Cup?
How FIFA turned the World Cup into a money-printing machine
The role that is “guaranteed to profit with no losses” in this World Cup is the International Federation of Association Football (FIFA). For the four-year cycle from 2023 to 2026, total revenue is expected to reach $13 billion, a 72% surge compared with the previous edition in Qatar. For the 2026 event alone, same-year receipts are already close to $8.9 billion, while total operating costs are only $3.8 billion. The input-output ratio hits 1:3.4—its money-making efficiency is something many listed companies can only envy. In the revenue mix, broadcasting rights contribute the biggest share, about $3.93B; ticketing and premium hospitality are next, expected to exceed $3 billion—3 times Qatar’s—and commercial sponsorships and brand licensing add another $1.79B. These three major segments together account for more than 70% of revenue. After the dynamic pricing mechanism debuted, the official face value for the first-tier final tickets has already reached $10,990; the secondary market has also reportedly seen outrageous deals at the million-dollar level. On FIFA’s official resale platform, each transaction charges a 15% fee to both buyers and sellers. That means when a $1,000 ticket changes hands, FIFA can additionally skim $300.
More importantly, almost all the cost burden of this business machine is pushed onto the host countries. Huge expenses such as stadium renovation, city security, and transportation support are handled by the US, Canada, and Mexico themselves. FIFA provides less than $100 million in fixed subsidies to the three hosts, accounting for under 0.8% of total revenue. Meanwhile, FIFA is registered in Switzerland and benefits from tax exemptions for non-profit organizations, so the massive profits it earns don’t need to be paid with high taxes. Team total prize money is $727 million, but compared with FIFA’s nearly $200k in annual revenue, it’s still a small slice. Put together, FIFA is projected to net more than $5 billion in profit over four years, with a profit margin above 130%.
Which host countries actually made money?
The economic windfalls split among the three hosts are drastically uneven. The US hosted 78 matches, accounting for 75% of the total. It even cornered the knockout stage, semifinals, and final—looking impressive on the surface, but the actual books are not so bright. The states combined invested about $11.1 billion in stadium refurbishments and transportation support; even at the federal level, security funding alone is $625 million. Analysts estimate the US’s overall GDP exceeds $20 trillion, and the macro boost from the World Cup is only about 0.05%, basically equivalent to statistical noise. In New Jersey alone, the investment for the final venue’s supporting facilities exceeds $100 million; while in a smaller city like Birmingham, Alabama, security expenses directly consume one-tenth of the city’s annual budget simply because it hosted matches. New York, as the final host, was forecast to gain an incremental $3 billion, but in reality hotel reservations reached only 65% of expectations, and many fans were deterred by inflated room-and-board prices.
Mexico, on the other hand, is the host with the highest relative gains among the three. Even though its absolute figure is lower than the US’s, Mexico invested only about $8 billion and mainly renovated existing stadiums. It added 800k inbound tourists; hotel occupancy in the first week of the tournament rose 16%; property prices in core urban areas jumped 3 to 5 times; and local restaurants and street vendors are expected to see a 50% increase in revenue. In the stock market, sectors like consumer spending and airports benefit directly, and small merchants and people working in service industries benefit the most.
Canada is the most awkward of the three. The two host cities each hosted only group-stage matches. Total spending is about 800k Canadian dollars, or $780 million. Toronto’s hosting cost rose from 30 million Canadian dollars at the start to 380 million Canadian dollars, more than tenfold. Vancouver’s tourism revenue increased by 1 billion Canadian dollars for the single city, but the overall input-output ratio still doesn’t look optimistic.
Good on paper, but ordinary people may not feel that way
While the macro numbers look impressive, many counterintuitive things happen when you zoom into specific scenarios. In Toronto, on the first match day, average hotel prices rose 48%, revenue per available room increased 36%, but occupancy actually fell 8%. Vancouver shows a similar pattern: house prices up 53%, revenue up 31%, but occupancy down 15%. The high prices keep ordinary business travelers and typical vacationers out, leaving the excitement largely for upscale hotels and international airlines. Food and drink inside the stadiums are also absurdly priced: in Toronto’s stadium, a beer costs $17—nearly 3 times the price in Germany; and in Miami’s stadium, a special “loaded fries” package is priced at $75. Overall spending in bars and restaurants in Toronto grew only 3%, while spending by international tourists rose 34%—but most of that money flows into the pockets of chain brands and international companies.
Commercial development around event-related merchandise also shows FIFA’s ability to “dig up money.” The official championship rings are limited to 2,026 pieces: ring numbers 1 to 30 are reserved for members of the champion team, and numbers 31 to 2,026 are put into the retail market with a price of $12k each. That means more than 98% of “World Cup champion rings” are sold to you. Broadcasters are winners too: the newly added “water break” pause rules were criticized for creating fixed ad windows for broadcasters. It’s estimated this World Cup adds about 7.5 hours of advertising inventory, bringing nearly $2 billion in incremental revenue, which directly pushes the US region’s broadcast fees to $945 million. As for the paths, stadiums, and temporary support that the host countries upgrade with real money, there is rather limited ability to keep generating returns after the event ends—whether a one-time investment can be turned into long-term assets remains a big question.