




Share your thoughts
placeholder
Article
$SNDK The bullish engine roars, with strategy and trend resonating perfectly.
On September 6, the market broke out of its consolidation range, with volume and price rising together to break key resistance. Relying on trendline support, we entered precisely during the accumulation phase.
Now approaching the first take-profit target, avoid overstaying under extreme leverage. Watch for selling pressure at the highs, take profits in time, and wait for a pullback before determining the next direction.#HYPE突破88美元创新高
post-image
SNDK+1.49%
today update 🥰🌹
live-cover
LIVE1,924
#HYPEBreaks88HitsNewAllTimeHigh
HYPE has entered a major price-discovery phase after breaking above $88 and printing a fresh all-time high of $88.11 on September 3. The token is currently trading around $85.4–$85.6, meaning it remains only about 2.8% below its record high despite the profit-taking that followed the breakout. The recent structure is especially interesting because HYPE has not collapsed after reaching $88.11; instead, it has been consolidating mainly between $83.5 and $86.4. From the August 31 area near $79.6 to the $88.11 ATH, HYPE gained approximately 10.7%, while the move fr
GM to everyone ☀️
Happy sunday
post-image
$DASH One order has fallen!
post-image
DASH+0.22%
  • 6
This Week’s (8.31-9.04) Review Summary✨
Don’t let short-term gains and losses disrupt your mindset, and don’t let fantasies of huge profits cloud your judgment
Learn to make trade-offs, align your actions with your knowledge, slow down, and time will give you the answer
#黄金 #白银 #行情 #策略 #交易 $XAUT
XAUT-0.15%
#USELESSSurgesAnother67%
USELESS is currently trading near 0.25 after another sharp upward move that registered approximately 67 percent gains in a recent 24-hour window.
The token, a Solana-based meme coin, has shown repeated strength over the past week. Market data places the current price in the 0.248 to 0.252 range, with a market capitalization around 249 to 252 million dollars. Twenty-four-hour trading volume has remained elevated, frequently exceeding 140 to 150 million dollars on spot markets and significantly higher when futures volume is included. This level of activity indicates gen
post-image
Falcon_Official
#USELESSSurgesAnother67%
$USELESS
MOMENTUM IS STILL RUNNING
USELESS has once again become one of the most aggressive momentum stories in the market. After its explosive multi-day rally, the token is now trading around $0.22, following a powerful move that previously pushed price toward the $0.25–$0.28 region. The latest market data shows just how extreme the move has become: USELESS has gained roughly 250%+ over seven days, while 24-hour trading volume has expanded above $200M.
THE BIGGER PICTURE
What makes this setup interesting is that USELESS is not simply experiencing a one-candle pump. The rally has developed across several sessions, with price moving from roughly $0.06–$0.07 at the beginning of the recent acceleration toward the $0.20+ area. Recent daily data shows gains of approximately 31.8% on Aug. 31, 24.8% on Sept. 1, 9.7% on Sept. 2, and 68.1% on Sept. 3, followed by another strong session on Sept. 4.
$0.22 IS THE NEW BATTLEFIELD
At the current $0.22 area, the chart is entering a completely different phase. Buyers have already demonstrated extraordinary strength, but the question now is whether they can maintain that momentum after such a rapid expansion.
The first level I would watch is $0.25. This remains the major psychological barrier because it represents a clean round number and sits close to the recent high zone. A strong daily close above $0.25, supported by sustained volume, would strengthen the continuation setup.
UPSIDE LEVELS
If USELESS successfully reclaims and holds $0.25, the next area to watch would be approximately $0.258–$0.26. A clean break there could put $0.30 back into focus.
Above $0.30, the $0.31–$0.312 region becomes an important technical target. From $0.22, a move to $0.25 would represent roughly 13.6%, while $0.30 would require about 36.4% upside. Reaching $0.312 would mean approximately 41.8% from the current level.
BUT THE CHART IS EXTREMELY HOT
This is where traders need to separate trend strength from risk. USELESS has already moved several hundred percent in a very short period, and current market activity confirms that speculation is intense.
The latest 24-hour range has been extremely wide, with market data showing price moving between roughly $0.18 and $0.28. That means double-digit percentage swings can happen quickly, even without a major fundamental change.
After such a vertical rally, chasing every green candle becomes increasingly dangerous. A strong asset can continue higher, but the probability of sharp profit-taking also increases as early buyers lock in gains.
THE SUPPORT MAP HAS CHANGED
For me, the most important question is whether previous breakout areas can become support.
The first zone is $0.21–$0.20. Holding this region after the recent acceleration would be constructive because it would show that buyers are defending the new higher price structure.
Below that, I would watch $0.18–$0.176. This area becomes much more important if the current momentum starts cooling. A controlled retracement into this region would not automatically destroy the larger rally.
The next deeper zone is around $0.15. Losing that level with heavy volume would suggest that the market is moving from healthy consolidation into a much deeper correction.
VOLUME TELLS THE STORY
The volume expansion is one of the strongest parts of the current setup. Current market data places USELESS around $220M+ in 24-hour trading volume, showing that this rally is happening alongside substantial market participation rather than disappearing liquidity.
But volume needs to be interpreted together with price. If buyers continue producing higher highs while volume remains elevated, momentum can continue. If price repeatedly fails near $0.25–$0.26 while selling volume increases, that would be a very different signal.
THE OVERBOUGHT PROBLEM
Momentum indicators are another reason I would avoid blindly chasing the current move. Previous technical readings already showed RSI entering an extremely overbought area, while MACD and moving averages remained strongly bullish.
That combination tells an important story: the trend is strong, but the entry risk is also rising.
An overbought RSI does not automatically mean price must crash. In powerful momentum markets, RSI can remain elevated for longer than expected. The better signal is whether price starts losing support while momentum indicators roll over.
BULLISH SCENARIO
My bullish scenario is simple: USELESS holds $0.20–$0.21, buyers return with strong volume, and price reclaims $0.25 decisively.
If that happens, $0.26 becomes the first confirmation zone, followed by $0.30 and potentially $0.31–$0.312.
The key is not simply touching $0.25. I want to see acceptance above it rather than another temporary wick followed by immediate rejection.
BEARISH SCENARIO
The risk scenario starts if USELESS repeatedly fails around $0.25 and then loses $0.20 with strong selling pressure.
That could trigger a cooling phase toward $0.18, followed by the $0.15 area if sellers remain aggressive. Such a pullback would not necessarily erase the entire multi-week rally, but it would indicate that the parabolic phase is losing momentum.
MY CURRENT VIEW
At approximately $0.22, USELESS remains one of the strongest momentum charts to watch, but the setup has changed significantly from the beginning of the rally.
The data shows extraordinary seven-day performance, huge trading activity and a market that has already demonstrated its ability to move tens of percent in a single session.
For me, the three levels are clear:
$0.25 — breakout confirmation
$0.20–$0.21 — immediate support
$0.176–$0.18 — deeper trend support
Above $0.25 with strong volume, $0.26 → $0.30 → $0.31+ becomes the upside roadmap.
Below $0.20, I would become much more cautious and wait for the market to establish a new base.
USELESS is still bullish from a momentum perspective, but after a 250%+ seven-day rally, the biggest opportunity may no longer be predicting whether the next candle is green. The real test is whether buyers can convert the explosive move into a sustainable higher-price structure.
If $0.25 breaks and holds, $0.30 comes back into play. If $0.20 breaks, the market may need a serious cooldown first.
@Gate_Square
repost-content-media
USELESS-0.17%
  • 1
Bitcoin pullback: watch support and set up long positions❗
During the pullback, focus on holding the two key bullish supports at 79300 and 78600.
As long as these two support levels are not decisively broken, the bullish structure remains intact, and the pullback presents an opportunity to buy long.
Long positions can be set up near the 79300–78600 support zone, with the first target at 80500–81200. A sustained move above 81200 would further open up upside room to challenge the previous high.
If the market breaks below the 78600 support on heavy volume, the bullish outlook is invalidated$BTC $
post-image
BTC+0.17%
ETH+1.62%
#Gate事件合约晒单挑战
Zcash has moved ahead of Dogecoin to become the tenth-largest cryptocurrency by market capitalization. Latest data from CoinMarketCap and market reports on September 6, 2026 show ZEC’s market value at approximately 19.64 billion dollars, placing it above DOGE.
ZEC has traded in a strong upward range in recent sessions, with prices moving through the 1,000 to 1,170 dollar zone on elevated volume. Circulating supply sits near 16.8 million coins against a maximum of 21 million. This relatively limited float has magnified the effect of recent capital inflows. Over the past thirty da
post-image
ZEC+16.13%
DOGE+6.07%
🚨 $DASH +65% FROM VIP ENTRY
Called it when DASH was sitting around $42.
HTF bullish 🟢
Reclaim $47.6 → continuation.
Price did exactly that.
Now sitting around $69 after pushing into the $70–78 area.
65%+ already captured.
Not chasing the top — let the chart come to us.
VIP gets the entries. Public gets the receipts. 🩸
post-image
DASH-0.23%
Everyone’s chasing gold—but $XAUT /USDT just flashed a 15m RSI of 29. Who’s buying this dip?

$XAUT /USDT - SHORT

Trade Plan:
Entry: 4419.8 – 4421.6
SL: 4429.7
TP1: 4413.9
TP2: 4409.4
TP3: 4402.6

Why this setup?
- 4h bias is SHORT (Conf 55), and 1D trend is *range*—not a breakout.
- Entry zone 4419.8–4421.6 sits right under rejection; TP1 at 4413.9 is the first magnet.
- RSI 15m oversold means a dead-cat bounce could fake you out—but the range top is capped at 4432 in the alt scenario.
- Why now? Price is mid-range with bearish pressure building; the 55% confidence says probability,
XAUT-0.15%
✨ MGBX Brand Refresh and Upgrade | Technology Empowered, Reshaping the Future of Trading
Evolution goes beyond the interface. It also lies in a comprehensive overhaul of the underlying architecture and intelligent core.
With faster matching and a more secure foundation, we continue to break boundaries and enable frictionless global asset flows.⚡
#MGBXBrandRefresh
post-image
  • 1
$400K to $145M on $STONK
RACE TO A BILLION MC 🎯
$DROVER
#HYDRACHAIN
$CKOM
$WOJAK
$BOB
$PONKE
$MYRO
#Cat
$BRETT
$DOG
$GME
$TRUMP
$WYNN
$Bonk
$PEOPLE
WHO WILL GET THERE FIRST? 🥇
post-image
WOJAK-8.84%
BOB+0.04%
PONKE+4.74%
MYRO+1.09%
BRETT+7.88%
$BTC is poised to hit the market again soon after its initial price was set to rise to the highest point of the year, with the benchmark price rising from the previous record low at around the same price.
The dollar has been on the verge of its highest.
BTC+0.17%
Thanks for the dip on $PURR
One clip candle for 100k is insane but the chart still holds.
See you at 100mn
post-image
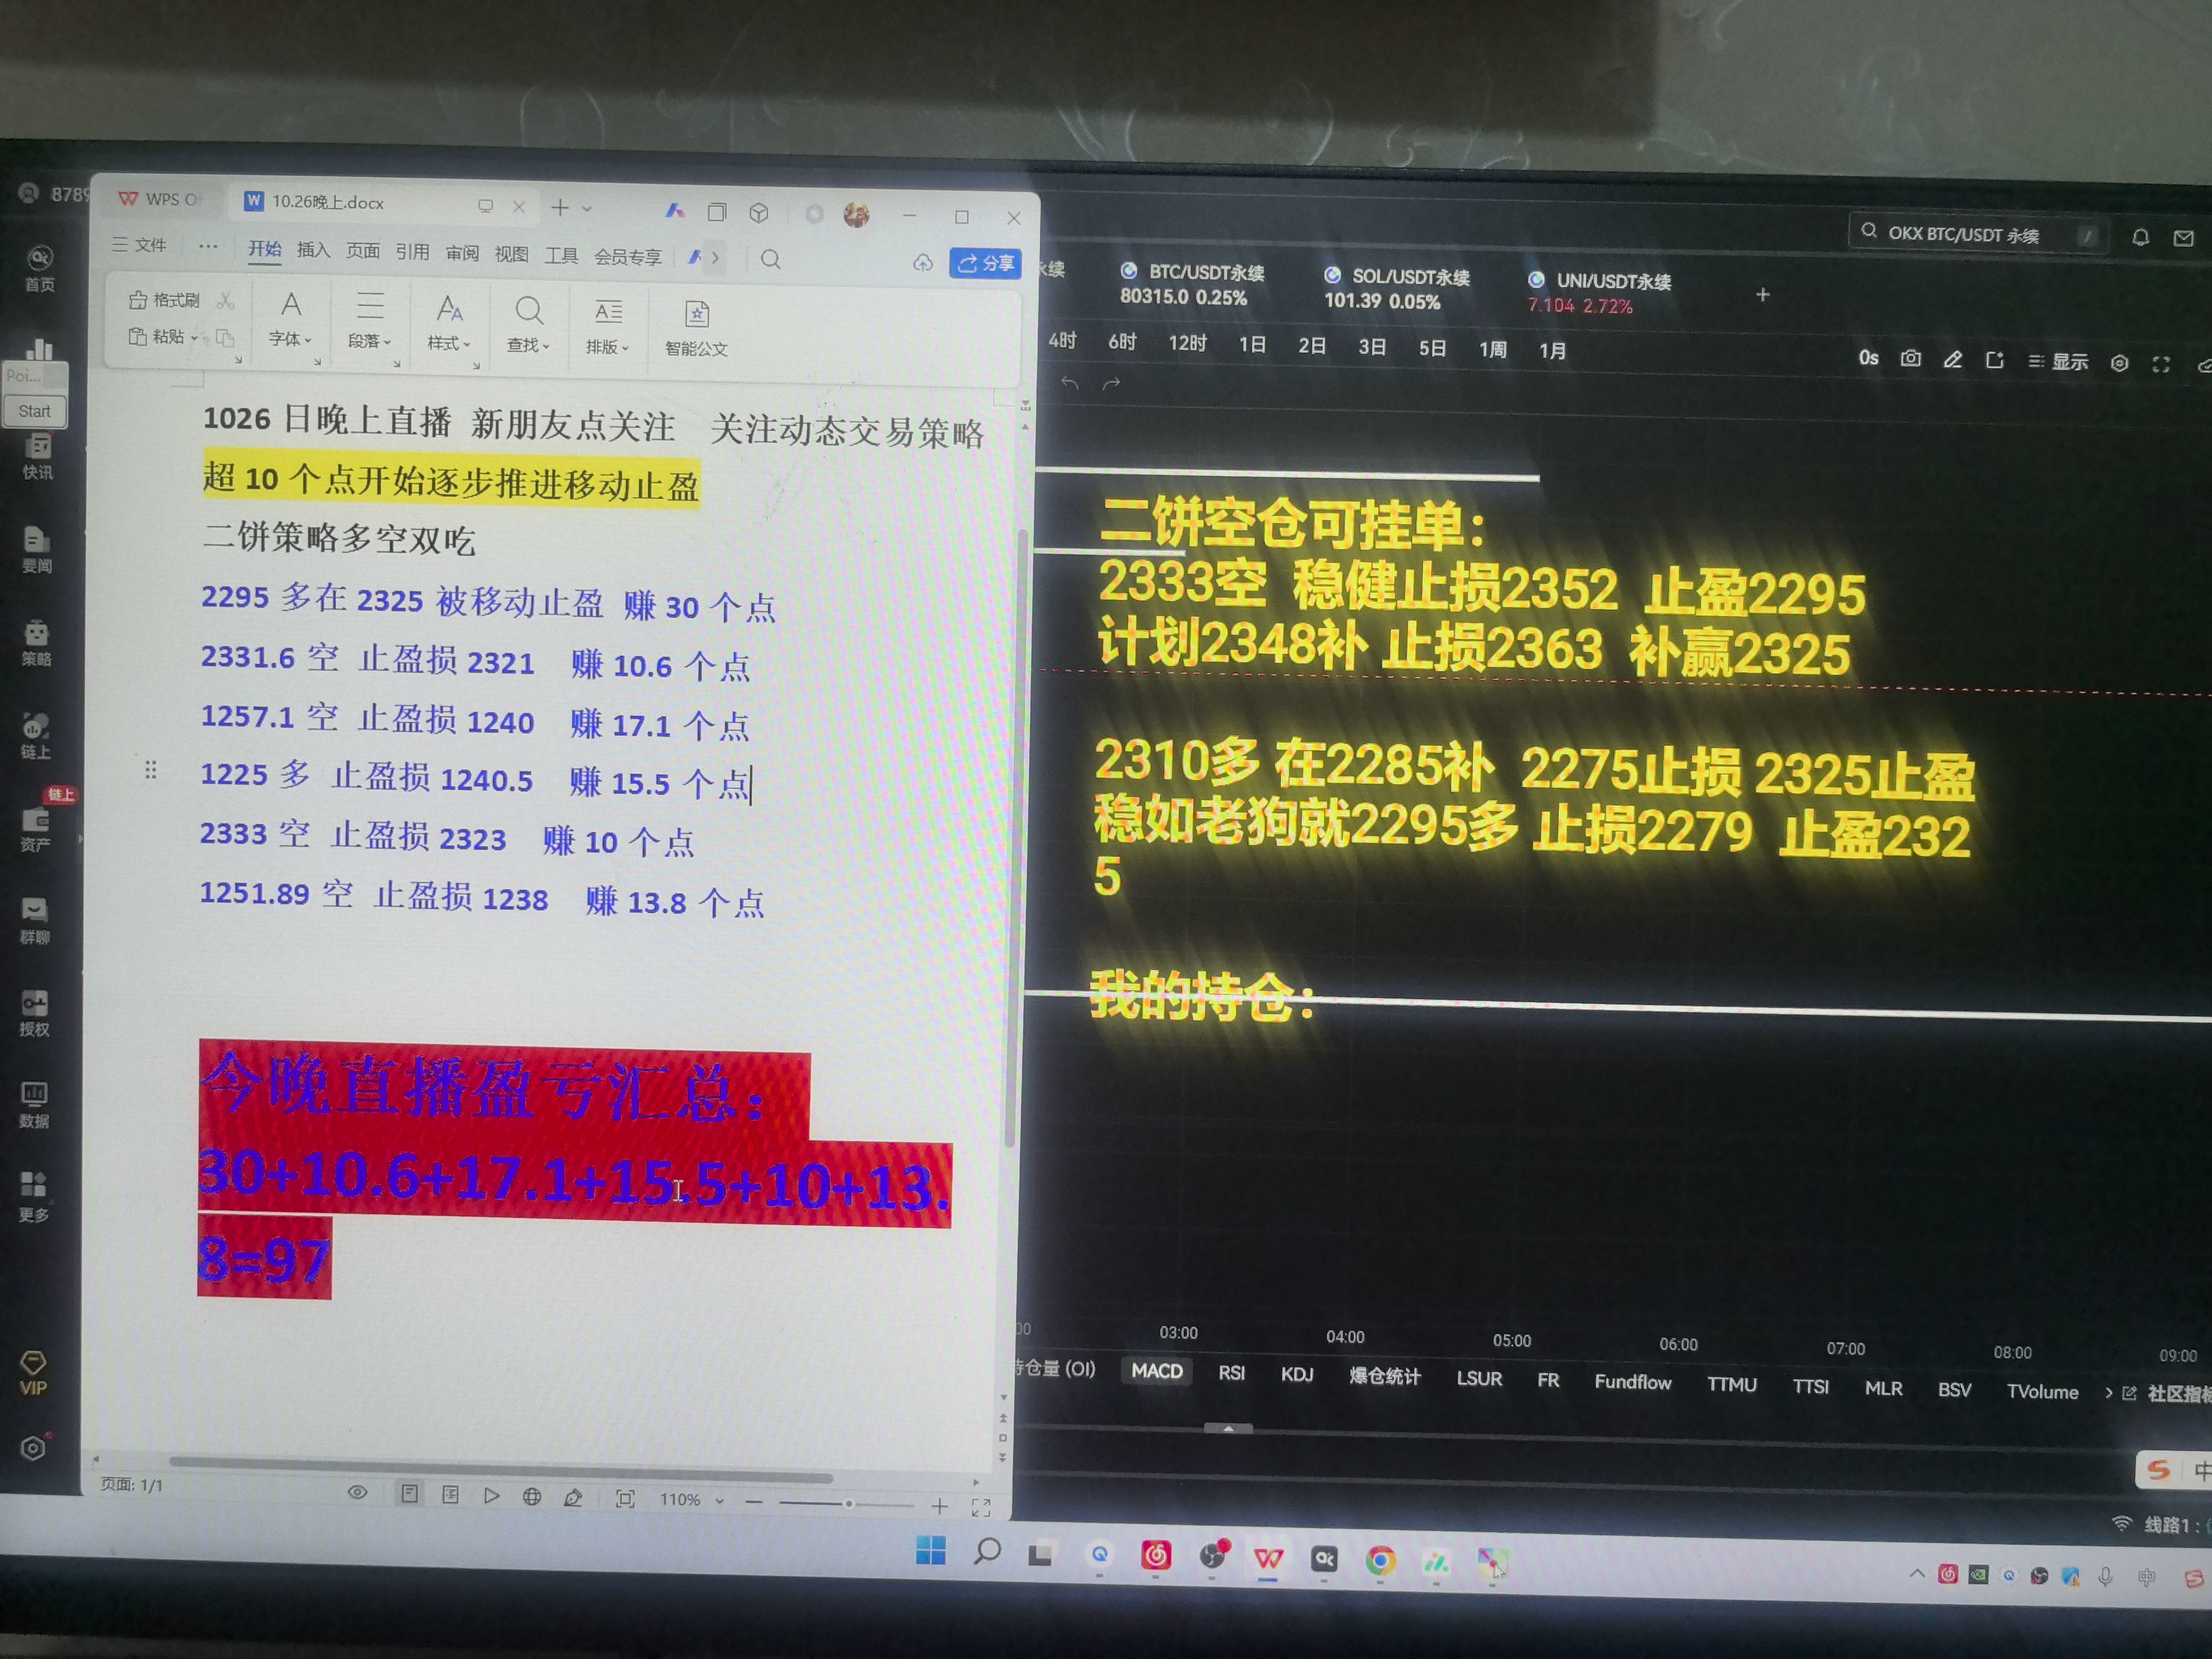
2510 20 shorts successful
post-image
【$B Signal】Long + 1H recovery/funding rate stable
$B 1H RSI 62, price is running below the upper Bollinger Band at 0.1834, with the 1H structure intact. The 4H MACD histogram is narrowing, and bullish momentum is exhausted. Order book buy/sell volume is 0.87, with aggressive selling pressure dominant; funding rate is 0.0312%, with no excessive leverage. Risk-reward is approximately 1.5; position size should follow the short-term plan, with no increase.
🎯Direction: Long
⚡Entry/limit order: 0.180856 - 0.181400
🛑Stop loss: 0.179586
🚀Target 1: 0.184121
🚀Target 2: 0.185482
🛡️Trade management:
post-image
BTC+0.21%
ETH+1.67%
SOL+2.77%
#Gate用户突破6000万
#Gate60MillionUsers
Let’s be honest. In crypto, big user numbers can mean almost anything. Sometimes it means aggressive referral campaigns. Sometimes it means a lot of empty accounts. Sometimes it just means the marketing team had a good quarter 😏.
So when Gate announced it had crossed **60 million registered users**, my first reaction wasn’t pure celebration. It was curiosity. How did they actually get here? 🤔
I joined in January 2025. At that time Gate was already a serious platform, but it wasn’t the loudest name in the room. It didn’t have the flashiest ads or the most
Load More

Join 40 M users in our growing community

⚡️ Join 40 M users in the crypto craze discussion

💬 Engage with your favorite top creators

👍 See what interests you

View More