Square
Following
Hot
News
Profile

Repanzal

vip
Active for: 1.7y
Peak Tier 5
No content yet
97
Following
3.2k
Followers
28.9k
Liked
Pin
ETH MORNING SETUP — TARGET HIT
The morning strategy played out exactly as planned.
$ETH was highlighted around the $2,600 entry zone, with the take-profit target set near $2,700.
Entry: $2,600
Target: $2,700
Potential move: +100 points
The levels were posted clearly in advance, and the market followed the setup almost perfectly.
The plan was there.
The levels were there.
The move happened.
So when the target arrives, why leave profits on the table?
Trade the plan. Manage risk. Take profits when your levels are reached.
#AltcoinsSeeSharpPullback
post-image
ETH-0.30%
  • 3
SpaceX $SPCX — 146 Is the Key Line
SpaceX has spent roughly seven to eight weeks moving sideways on the weekly chart, with price repeatedly hovering around 150. Today’s close near 148 keeps the structure neutral rather than decisively bullish or bearish.
The daily chart has printed lower wicks for two consecutive sessions, while price has avoided making a fresh low. That makes 146 the most important short-term support.
As long as 146 holds, the broader range remains intact with a bullish bias.
A confirmed move above 150 could open the way toward 155 and then 160.
If 146 breaks decisively, atte
SPCX+0.42%
TSLA-1.54%
Quantum Computing Is Becoming a Crypto Security Priority
Quantum computing is no longer being treated as a distant technological concept. Security risks surrounding quantum technology are increasingly entering the conversation across the financial and digital-asset industries.
Europe’s three major financial regulators. EBA. EIOPA. and ESMA. have highlighted quantum computing as an emerging technology risk relevant to the crypto sector. This signals that quantum resistance is gradually becoming part of the industry’s long-term security planning.
Why Quantum Computing Matters for Crypto
A large
GOATED+0.10%
  • 1
cleared approximately 282,700 SOL long positions earlier today, realizing a profit of around $4.41 million. The whale accumulated the position between August 30-31 at an average entry price of $104.79 per SOL, then liquidated today at an average price of $120.39 per SOL, capturing a 14.9% gain over the near one-month holding period.
SOL+1.10%
According to CryptoQuant analyst Axel Adler Jr., Bitcoin entered an early bull market phase on August 20 when the adjusted MVRV 30-day moving average-to-365-day MA ratio crossed above its 365-day moving average at a price of $71,255. Over the subsequent 31 days, Bitcoin rose 13%.
BTC+0.04%
Weekly United States Stock Market Analysis
The United States stock market ended the week with a mixed but generally constructive tone. Technology and artificial intelligence stocks continued to lead, while the Dow Jones Industrial Average and smaller companies showed weaker momentum.
The biggest focus for next week will be inflation data, employment numbers, Treasury yields, oil prices, and the reaction of major technology stocks.
NVIDIA
NVIDIA closed Friday around $225.08, gaining roughly 1.35% during the week.
The stock traded inside a relatively narrow range between approximately $221 and $
post-image
US30+1.00%
NVDA+0.23%
TSLA-1.54%
NAS100+0.62%
US500+0.61%
  • 2
#GateSquareMidAutumnReunion
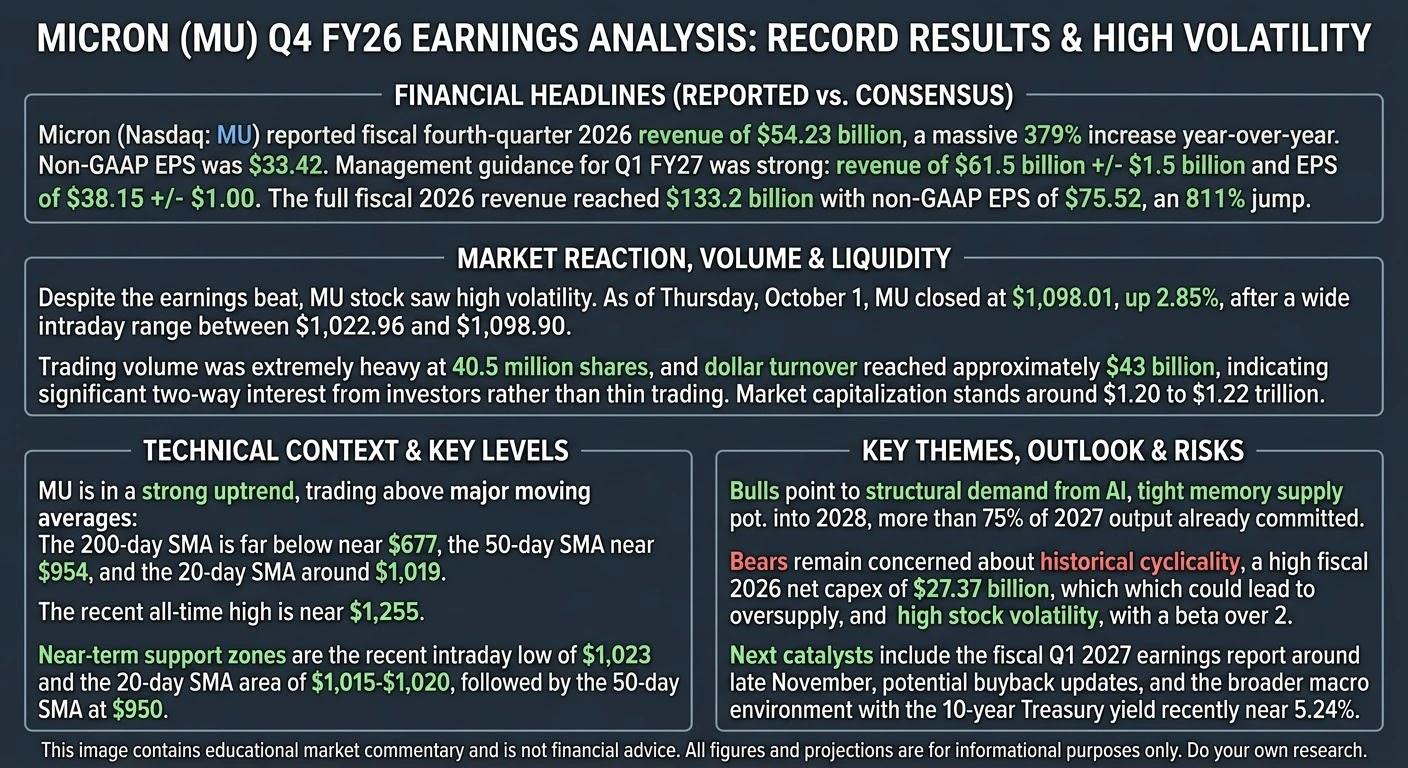
Micron Earnings Could Set the Next Memory Market Direction
On September 30, Micron will release its latest earnings report, and this update could be important for the entire memory and AI hardware sector.
The market is not only watching whether Micron beats expectations. The bigger question is what management says about DRAM demand, HBM4 growth, pricing, and the 2027 supply outlook.
1. How Long Can DRAM Prices Keep Rising?
AI infrastructure continues to consume huge amounts of memory capacity.
Micron previously expected 2026 data-center DRAM and NAND industry shipm
MU+0.27%
NVDA+0.23%
  • 2
Crypto Market Update | September 26, 2026
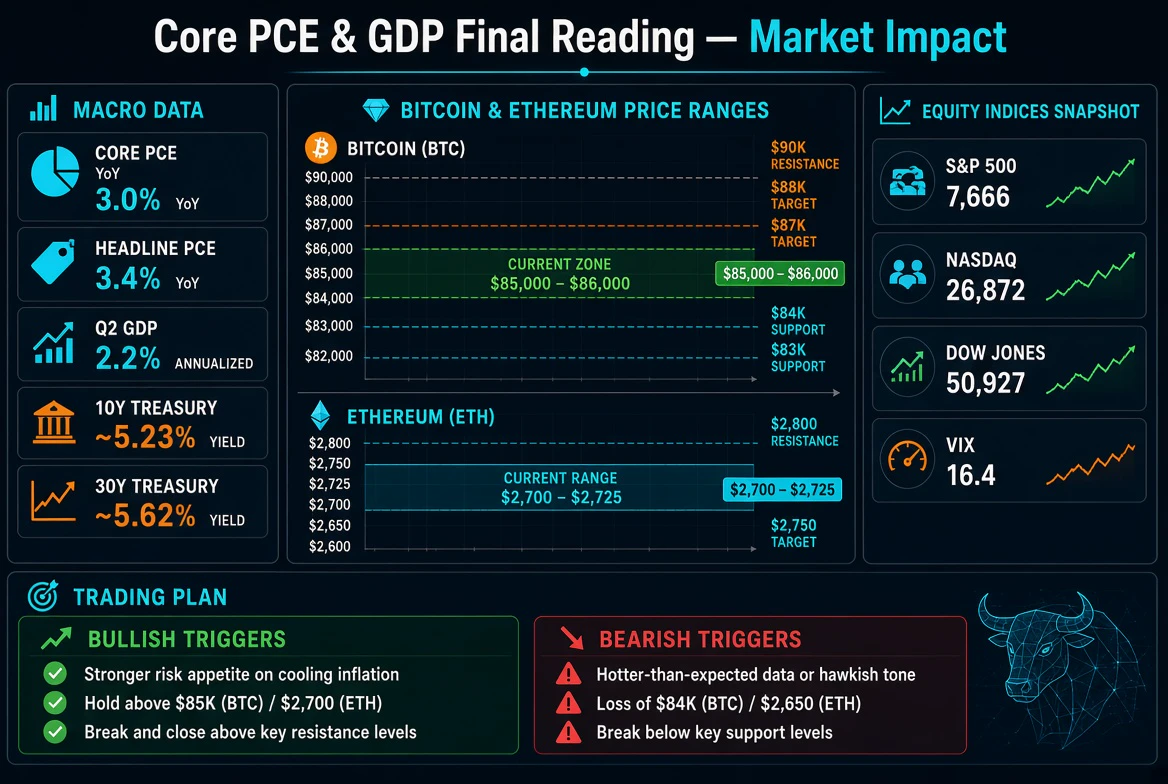
The crypto market remains structurally bullish, but Bitcoin and Ethereum are showing short-term consolidation.
Overall Market
Total crypto market cap is around $2.97T, up 0.4% over 24 hours.
Bitcoin dominance is 58.51% and Ethereum dominance is 11.39%.
The Fear and Greed Index is at 72, while the Altcoin Season Index is 64. This shows strong market confidence, but there is still no broad altcoin season.
Bitcoin Technical Structure
Bitcoin is trading around $83,965 on Gate.
24H High: $85,257
24H Low: $83,175
On the daily chart, the larger structure rema
BTC+0.04%
ETH-0.30%
SOL+1.10%
  • 1
First-Trade Loss Coverage Up to 20 USDT, Check In to Share 38,000 USDT https://www.gate.com/campaigns/6243?ch=7932&ref=VLIWB18NAQ&ref_type=132
post-image
  • 1
#GateBTC现货交易量跻身前三
ETH is currently around $ETH down slightly by 0.12% over the past 24 hours. Short-term moving averages are bearish, while the daily chart remains in a bullish alignment. The price has entered a narrow range, with a clear divergence between bulls and bears. The SEC clarified that liquid staking tokens are not securities, and spot ETFs have recorded net inflows for 5 consecutive days, providing support below.
post-image
ETH-0.30%
  • 5
#GateSquareMidAutumnReunion
🎁 15,000 USDT Mid-Autumn Festival gifts continue—today we’re talking about $BTC !
New users are guaranteed a red envelope on their first post, with up to 5 USDT, plus an exclusive 1,000 USDT prize pool!
👉 Sign up now: https://www.gate.com/campaigns/6260
🔥 Day 8: #BTC short-term pullback
Post with #BTC短线回调 + #Gate广场中秋团圆局 , share your views, and win rewards!
📢 Today’s hot topic
BTC pulled back to around $84,000 after surging, down approximately 3.7% over 24 hours, with about $280 million in long positions liquidated. Meanwhile, spot BTC ETFs have recorded net inf
HighAmbition
#GateSquareMidAutumnReunion
🎁 15,000 USDT Mid-Autumn Festival gifts continue—today we’re talking about $BTC!
New users are guaranteed a red envelope on their first post, with up to 5 USDT, plus an exclusive 1,000 USDT prize pool!
👉 Sign up now: https://www.gate.com/campaigns/6260
🔥 Day 8: #BTC short-term pullback
Post with #BTC短线回调 + #Gate广场中秋团圆局 , share your views, and win rewards!
📢 Today’s hot topic
BTC pulled back to around $84,000 after surging, down approximately 3.7% over 24 hours, with about $280 million in long positions liquidated. Meanwhile, spot BTC ETFs have recorded net inflows for four consecutive trading days. Is this pullback a buildup for the next move, or is the rally starting to weaken?
Post now: https://www.gate.com/post
Event details: https://www.gate.com/announcements/article/101723
repost-content-media
BTC+0.04%
  • 3
#GateMemeCarnivalSeason #PENGU
🟣 PENGU MARKET ANALYSIS — BREAKOUT OR PULLBACK?
Pudgy Penguins (PENGU) is currently around $0.00970, after a powerful recovery from the $0.0075–$0.0078 area. Recent market data shows PENGU reached an intraday high near $0.01026, while 24-hour volume remains substantial at roughly $300M+, showing that this move is attracting serious trading activity.
The bigger picture is interesting:
PENGU recently moved from around $0.00726 on Sept. 17 to above $0.0097, representing a major short-term recovery. The token also traded as high as $0.0112 during the recent move,
HighAmbition
#GateMemeCarnivalSeason #PENGU
🟣 PENGU MARKET ANALYSIS — BREAKOUT OR PULLBACK?
Pudgy Penguins (PENGU) is currently around $0.00970, after a powerful recovery from the $0.0075–$0.0078 area. Recent market data shows PENGU reached an intraday high near $0.01026, while 24-hour volume remains substantial at roughly $300M+, showing that this move is attracting serious trading activity.
The bigger picture is interesting:
PENGU recently moved from around $0.00726 on Sept. 17 to above $0.0097, representing a major short-term recovery. The token also traded as high as $0.0112 during the recent move, so the market is now testing an important resistance zone rather than starting from a low-volatility base.
📊 KEY LEVELS
Current Price: $0.00970
Support 1: $0.00950–$0.00955
Support 2: $0.00910–$0.00920
Support 3: $0.00865–$0.00880
Resistance 1: $0.01025–$0.01030
Resistance 2: $0.01080–$0.01120
Resistance 3: $0.01180–$0.01220
The first major battle is around $0.01025–$0.01030.
A clean breakout with strong volume and sustained trading above this zone could open the door toward $0.0108–$0.0112. If momentum continues and the previous ~$0.0112 high is reclaimed convincingly, the next expansion zone could reach $0.0118–$0.0122.
That would represent approximately +8% to +26% from the current ~$0.00970 level.
🎯 TRADE PLAN
TP1: $0.01025
TP2: $0.01100
TP3: $0.01200
For risk control:
SL1: $0.00945
SL2: $0.00905
SL3: $0.00860
The idea is not to chase a vertical candle. If PENGU breaks $0.01025 with strong volume, waiting for a successful retest can provide a cleaner entry. If price loses $0.00950 decisively, momentum could weaken and a deeper retracement toward $0.00910 or $0.00870 becomes possible.
🔥 MARKET SENTIMENT
Sentiment is currently cautiously bullish, but volatility is extremely important. PENGU has already produced a large recovery, and recent data shows strong volume accompanying the move. At the same time, the market has repeatedly faced selling around the $0.0102–$0.0112 region, meaning buyers need to prove that resistance can turn into support.
📈 MY SCENARIO
Bullish scenario: Hold $0.00950 → reclaim $0.01025 → breakout → $0.0110 → $0.0120.
Neutral scenario: PENGU remains between $0.0095 and $0.01025 while the market builds liquidity before the next directional move.
Bearish scenario: Lose $0.00950 → $0.00910 → potentially $0.00865–$0.00880.
The key is simple: $0.01025 is the breakout trigger, while $0.00950 is the immediate line of defense. I would manage the position around these levels rather than chasing price after a sudden pump.
PENGU has momentum, liquidity and a strong recent recovery, but meme-coin volatility can move extremely fast in both directions. Protect capital first, scale positions carefully, and let confirmation—not emotion—drive the next trade.$PENGU ‌
repost-content-media
PENGU+2.24%
  • 3
🔥 Altseason signals are heating up—could Meme be next in line?
The market has started discussing capital rotating from BTC into altcoins, and Meme is often one of the sectors that attracts the most attention when risk appetite recovers 👀
Do you favor Meme taking the baton this round, or do you think we still need to wait?
Bring #GateMeme狂欢季 to Gate Square to share your Meme views and trading ideas 👇
🎯 The more you post, the more chances you have to win, with up to 10 USDT per draw
📈 Your first valid trade-showcase post each week guarantees a 50 USDT futures position experience voucher
🍀
HighAmbition
🔥 Altseason signals are heating up—could Meme be next in line?
The market has started discussing capital rotating from BTC into altcoins, and Meme is often one of the sectors that attracts the most attention when risk appetite recovers 👀
Do you favor Meme taking the baton this round, or do you think we still need to wait?
Bring #GateMeme狂欢季 to Gate Square to share your Meme views and trading ideas 👇
🎯 The more you post, the more chances you have to win, with up to 10 USDT per draw
📈 Your first valid trade-showcase post each week guarantees a 50 USDT futures position experience voucher
🍀 Complete copy trading to enter a weekly draw for 2 Meme copy-trading lucky winners, each receiving 20 USDT
Whether altseason has arrived is up for discussion, but whether Meme has a chance is even more worth talking about.
👉 Join now: https://www.gate.com/campaigns/6197
#GateMemeCarnivalSeason
repost-content-media
MEME+2.78%
BTC+0.04%
#GateSquareMidAutumnReunion #MU Current Price: ~$1,086
Major Catalyst: September 30 earnings
Previous ATH: ~$1,254.81
Key Sector: AI memory / HBM / DRAM / NAND
Market Structure: Bullish, but high-volatility
Micron's biggest structural driver remains AI infrastructure. Modern AI accelerators and data-center servers require enormous amounts of high-bandwidth memory and conventional DRAM. That has shifted memory from being simply a cyclical semiconductor component toward a strategically important part of AI infrastructure.
The most important fundamental story is therefore HBM + DRAM pricing + su
HighAmbition
#GateSquareMidAutumnReunion #​MU Current Price: ~$1,086
Major Catalyst: September 30 earnings
Previous ATH: ~$1,254.81
Key Sector: AI memory / HBM / DRAM / NAND
Market Structure: Bullish, but high-volatility
Micron's biggest structural driver remains AI infrastructure. Modern AI accelerators and data-center servers require enormous amounts of high-bandwidth memory and conventional DRAM. That has shifted memory from being simply a cyclical semiconductor component toward a strategically important part of AI infrastructure.
The most important fundamental story is therefore HBM + DRAM pricing + supply discipline. If memory prices remain elevated while Micron continues moving its product mix toward higher-value HBM products, revenue and margins can remain exceptionally strong.
Micron's Q3 FY2026 numbers already demonstrated the strength of this cycle: approximately $41.5B revenue, 84.9% gross margin, about $100B contracted backlog, and roughly $23.8B net cash. Nasdaq also reported that Micron had around $100B of memory contracted through 2030.
THE SEPTEMBER 30 EARNINGS TEST
This is the most important short-term event.
The market is not simply looking for Micron to beat its previous quarter.
Investors will be watching:
1. Revenue
Guidance is around $49–51B. A substantial beat would reinforce the demand story, while a result around or below expectations could trigger profit-taking.
2. EPS
Current guidance is approximately $30–32 non-GAAP EPS, with ~$31 around the midpoint.
3. Gross Margin
The company is guiding toward approximately 86%, which makes margin commentary extremely important. If pricing and product mix remain strong, margins could provide another bullish confirmation.
4. HBM demand
This may be even more important than headline revenue. Investors want evidence that HBM demand remains strong and that Micron can execute its HBM4 ramp.
5. FY2027 guidance
This could determine whether MU's enormous valuation momentum continues. The market will want to know whether tight supply and strong AI demand can persist into 2027.
KEY PRICE LEVELS AT $1,086
Immediate Support: $1,050–$1,040
This is the first zone bulls need to defend.
Major Support: $1,000
Psychological + technical level.
Holding $1,000 keeps the broader bullish structure intact.
Strong Support: $950–$930
A deeper correction into this region could still represent a pullback inside a larger bullish structure rather than automatically signaling a trend reversal.
Major Resistance: $1,120–$1,150
A clean breakout with strong volume would put the previous highs back into focus.
Next Resistance: $1,200
A major psychological level.
Previous ATH Zone: ~$1,255
This remains the major historical breakout target. MU previously reached approximately $1,254.81 intraday.
BULLISH SCENARIO
If earnings beat expectations, gross margin expands, HBM commentary remains strong and FY2027 guidance comes in above market expectations, MU could attempt:
TP1: $1,120–$1,150
TP2: $1,200
TP3: $1,250–$1,260
Extended scenario: $1,300+
A move from $1,086 to $1,200 would represent approximately +10.5%, while a move to $1,255 would be approximately +15.6%.
The $1,300 area would represent approximately +19.7% from $1,086.
These are scenario levels, not guaranteed price predictions.
BEARISH / RISK SCENARIO
The biggest risk is not necessarily weak current business. It is expectations becoming too high.
If Micron reports strong numbers but gives conservative FY2027 guidance, margins disappoint, HBM growth fails to accelerate, or investors believe the memory cycle is approaching a peak, MU could experience a classic sell-the-news correction.
Important downside levels:
SL1 / Risk Alert: $1,040
SL2: $1,000
SL3: $950
A decisive break below $950 would materially weaken the current bullish structure and would make the previous rally much more vulnerable to deeper consolidation.
MARKET SENTIMENT
Fundamental sentiment: Bullish
AI/HBM sentiment: Strong bullish
Earnings sentiment: Extremely important
Technical sentiment: Bullish but extended
Volatility: Very High
Risk/Reward: Attractive only with disciplined entries
The broader memory industry is also extremely important. Micron is competing with Samsung and SK hynix, while Chinese competitor CXMT is making technological progress in DRAM. Reuters reported that CXMT recently entered mass production with a newer memory platform, highlighting the longer-term competitive and supply-side risk for established memory manufacturers.
TRADING PLAN
At $1,086, I would not treat MU as a low-risk chase.
A more disciplined structure is:
Breakout strategy:
Above $1,120–$1,150 with strong volume → monitor for continuation toward $1,200 and $1,250.
Pullback strategy:
$1,050–$1,040 → first important reaction zone.
Deep pullback:
$1,000 → major psychological/technical level.
High-risk accumulation zone:
$950–$930, provided the fundamental thesis remains intact.
Earnings strategy:
Because September 30 can produce very large gaps, leverage should be controlled. Entering immediately before earnings carries substantially higher gap risk than waiting for the market to establish a post-earnings direction.
FINAL VIEW
Micron's story is no longer simply “memory chips are recovering.” The bigger story is the combination of AI infrastructure demand + HBM + DRAM pricing + constrained supply + expanding margins + long-term customer commitments.
The critical question now is whether Micron can convert this exceptional AI-memory demand into sustainable FY2027 growth.
At $1,086, MU remains in a powerful long-term bullish structure, but the stock is close enough to major historical highs that earnings expectations and forward guidance matter enormously. The September 30 report could therefore create either a continuation toward the $1,200–$1,255 region or a sharp volatility-driven reset toward $1,000/$950.
The key levels to watch are $1,040 → $1,000 → $950 on the downside and $1,120 → $1,200 → $1,255 on the upside.
The strongest confirmation for the bulls would be revenue above guidance + ~86% or better margins + strong HBM commentary + bullish FY2027 guidance. $MU ‌
repost-content-media
MU+0.27%
SK Hynix+1.19%
SKHY+2.83%
SKHYV-0.98%
#GateSquareMidAutumnReunion
Gate Square Mid-Autumn Reunion is more than a seasonal celebration. It is a beautiful reflection of community, connection, creativity, knowledge sharing, and the journey that brings people together through one of the most active spaces in the Gate ecosystem.
The Mid-Autumn Festival has always carried a special meaning. It represents reunion, togetherness, appreciation, family, friendship, and the idea that even when people are far apart, they can still come together around something meaningful. In the digital world, Gate Square brings that same spirit into the cry
HighAmbition
#GateSquareMidAutumnReunion
Gate Square Mid-Autumn Reunion is more than a seasonal celebration. It is a beautiful reflection of community, connection, creativity, knowledge sharing, and the journey that brings people together through one of the most active spaces in the Gate ecosystem.
The Mid-Autumn Festival has always carried a special meaning. It represents reunion, togetherness, appreciation, family, friendship, and the idea that even when people are far apart, they can still come together around something meaningful. In the digital world, Gate Square brings that same spirit into the crypto community by giving people from different backgrounds and different parts of the world a place to connect, communicate, share ideas, and celebrate their common interest in blockchain and digital assets.
What I appreciate most about Gate Square is that it is not simply a place where people publish posts and move on. It has developed into a community-driven environment where creators, traders, investors, and crypto enthusiasts can exchange perspectives and learn from one another. Every useful market observation, educational explanation, trading idea, personal experience, and thoughtful discussion adds value to the wider community.
Gate Square also gives creators something extremely important: a platform to express their own knowledge and perspective. In the fast-moving crypto market, information changes constantly.
Prices move, liquidity shifts, narratives develop, new projects appear, and market sentiment can change within hours. Having a place where people can discuss these developments openly makes the community more active and informed.
For creators, the journey is not only about producing content. It is also about learning how to explain complicated market developments in a way that other people can understand. A strong community helps creators improve their research, communication, analysis, and consistency. Gate Square provides an environment where these different skills can come together.
Another thing that makes Gate Square special is the diversity of its community. Some users focus on technical analysis, some follow macroeconomic developments, some are interested in blockchain technology, some explore new crypto projects, while others simply enjoy following market discussions and learning from experienced members. These different perspectives create a much richer community experience.
The Mid-Autumn Reunion is therefore a perfect moment to appreciate everyone who contributes to this environment. Every creator who takes time to prepare a thoughtful post, every trader who shares a market observation, every user who leaves a meaningful comment, and every community member who participates in discussions contributes to the overall energy of Gate Square.
I believe a strong crypto ecosystem needs more than technology and markets. It also needs people who communicate, educate, discuss, question, and share experiences.
Gate Square brings these elements together through its creator and community-focused environment.
There is also something meaningful about celebrating Mid-Autumn within a global digital community.
Traditionally, the full moon represents completeness and reunion. Today, technology allows people thousands of kilometers apart to participate in the same conversation. Gate Square is a great example of how digital communities can reduce distance and create connections between people who might otherwise never meet.
For me, the real value of a platform like Gate Square is the opportunity to be part of something bigger than an individual post. A single post may provide information for one moment, but an active community can create continuous learning. One person's market analysis can become another person's starting point for research.
One creator's experience can help another creator improve. One discussion can introduce an entirely new perspective.
That is why community matters.
Crypto is an industry where learning never really stops. Market conditions change, new technologies emerge, regulations evolve, and investor behavior constantly develops. A community that encourages knowledge sharing can help its members stay engaged with this rapidly changing environment.
Gate Square deserves appreciation for creating a dedicated space where this type of interaction can happen.
The platform gives creators a chance to participate, communicate, build their voice, and connect with an audience that shares an interest in the crypto ecosystem. It also gives ordinary community members the opportunity to discover different viewpoints and become part of ongoing conversations.
The beauty of the Mid-Autumn Reunion is that it reminds us that success is not only measured by numbers. Behind every market chart, every trading position, every post, and every campaign are real people with different experiences and ambitions. A healthy community gives those people an opportunity to connect.
As Gate Square continues to grow, its strongest asset will always be its community. Technology can create a platform, but people create the culture. Creators bring the ideas.
Traders bring the market perspective.
Readers bring curiosity. Discussions bring learning. Together, these elements create the identity of Gate Square.
This is why the Mid-Autumn theme feels so appropriate for Gate Square.
Reunion is ultimately about bringing people closer, and that is exactly what a strong community should do.
Whether someone is an experienced trader, a new crypto learner, a dedicated creator, or simply a person who enjoys following the latest market discussions, everyone can contribute something valuable.
Sometimes it is a detailed analysis.
Sometimes it is a simple observation.
Sometimes it is a question that starts a meaningful discussion. Every contribution can become part of the larger community experience.
I also appreciate the opportunity Gate Square gives creators to transform their market knowledge and personal experiences into useful content. In an industry where information moves incredibly fast, quality communication matters. Clear explanations, responsible analysis, and genuine community interaction can make a significant difference.
The Mid-Autumn Reunion is therefore not only about looking back at what the community has achieved. It is also about looking forward. There are still new technologies to explore, new market cycles to understand, new creators to discover, and countless conversations waiting to happen.
The future of crypto will be shaped not only by market prices but also by communities that understand how to communicate and learn together.
Gate Square has an important role in that process by giving creators and users a shared space to participate in the wider Gate ecosystem.
On this special occasion, I want to appreciate Gate Square for bringing people together and creating an environment where creativity, knowledge, market discussion, and community spirit can exist side by side.
May this Mid-Autumn Reunion bring stronger connections between creators and users, more meaningful discussions, more valuable knowledge sharing, and even greater community participation.
Markets will always have their ups and downs. Bitcoin will move through different cycles. Altcoins will create new narratives. Technology will continue to evolve. But the people who continue learning, sharing, and supporting a healthy community are what make an ecosystem truly meaningful.
That is the spirit of reunion.
That is the spirit of community.
And that is what makes Gate Square special.
Wishing the entire Gate Square community a wonderful Mid-Autumn Reunion filled with happiness, peace, creativity, meaningful conversations, valuable insights, and new opportunities.
Happy Mid-Autumn Festival to the entire Gate Square family. May this celebration bring everyone closer, strengthen the community spirit, and make the Gate Square journey even more exciting in the future.
$META $NVDA ‌ ‌
repost-content-media
BTC+0.04%
META-3.28%
NVDA+0.23%
#GateBTCSpotVolumeRanksTop3
Two years ago Gate held just 2.0% of the BTC spot volume tracked by Glassnode.
Today that figure stands at 9.1% — and Gate sits in the global 3 position.
That is not a small step.
It is a market-share transformation: four ranking positions gained, more than 4.5× growth in relative share, and nine months inside the top three across the last 24 months. While the crypto market kept shifting, Gate kept building — quietly, consistently, and at a scale that is now impossible to overlook.
The latest Glassnode Week On-Chain numbers make the progression clear. Gate advance
HighAmbition
#GateBTCSpotVolumeRanksTop3
Two years ago Gate held just 2.0% of the BTC spot volume tracked by Glassnode.
Today that figure stands at 9.1% — and Gate sits in the global 3 position.
That is not a small step.
It is a market-share transformation: four ranking positions gained, more than 4.5× growth in relative share, and nine months inside the top three across the last 24 months. While the crypto market kept shifting, Gate kept building — quietly, consistently, and at a scale that is now impossible to overlook.
The latest Glassnode Week On-Chain numbers make the progression clear. Gate advanced four places in BTC spot trading volume and reached 3 among the exchanges covered in the analysis. At the same time its share of tracked BTC spot volume expanded from 2.0% to 9.1% — a gain of 7.1 percentage points.
A temporary volume spike can appear after a major market move, a short-lived campaign, or a burst of speculative activity. A change that develops across two full years deserves a completely different level of attention. Gate spent nine of the past 24 months inside the top three. The current #3 position is therefore part of a broader pattern, not a single snapshot. Rankings fluctuate as exchanges compete for liquidity, yet repeatedly holding a top-three place shows that Gate has established a significantly larger presence in BTC spot trading than it held two years ago.
The most powerful number remains 2.0% → 9.1%.
Moving from roughly one-fiftieth of the tracked market to nearly one-tenth means Gate has dramatically increased its relative share of BTC spot activity. In a market as competitive as Bitcoin, capturing additional volume requires competing directly for traders, liquidity providers, market makers and order flow.
This is where the liquidity dynamic becomes central. Greater trading activity can support deeper order books and more continuous participation. Deeper liquidity can reduce the market impact of larger orders, while tighter competition between buyers and sellers can contribute to narrower effective spreads. Actual execution quality always depends on the specific pair, volatility, order-book depth and trade size at any given moment. The volume data should not be read as proof that every trader receives identical conditions at every second. What it does show is more fundamental: a larger share of BTC spot activity is now being routed through Gate than two years ago.
That is the structural shift.
And structural shifts matter more than short-term headlines.
Gate’s progress has occurred in an increasingly competitive exchange landscape. Major platforms continue to compete aggressively for spot volume and active users. Advancing four ranking positions in this environment means Gate has not merely ridden overall market growth; its relative standing within the tracked set has improved substantially. The nine top-three appearances reinforce the point. A single month at #3 could be temporary. Appearing inside the top three across nine different months of a 24-month period demonstrates repeated ability to attract and retain meaningful BTC spot flow under varying market conditions.
Bitcoin remains the core liquidity market for the entire crypto ecosystem. A stronger position in BTC spot does not simply improve an exchange’s ranking on a chart; it increases its relevance inside one of the industry’s most important trading markets. Gate’s rise should therefore be viewed through the lens of market share, persistence and competitive positioning rather than raw daily volume alone.
The key figures side by side:
BTC spot market share: 2.0% → 9.1%
Market-share increase: +7.1 percentage points
Relative share growth: approximately 4.55×
Ranking improvement: +4 positions
Current Glassnode ranking: 3
Top-three appearances: 9 of the last 24 months
Put together, the progression is difficult to dismiss. Two years ago Gate competed from a much smaller base. Today it occupies the third position in Glassnode’s tracked BTC spot ranking and accounts for close to one-tenth of the covered volume.
Volume growth can create a positive feedback loop when it is accompanied by strong liquidity and consistent participation. More traders can attract additional market-making activity. More market-making activity can support deeper books. Deeper books can make larger orders easier to execute. Better trading conditions can then encourage further participation. The data alone cannot quantify exactly how much each factor contributed, yet the sustained rise in market share shows that the end result has been real and measurable.
Market share is never permanent. Crypto trading is intensely competitive and rankings can shift as liquidity moves and conditions evolve. Defending and potentially expanding the current position will require continued focus on execution quality, order-book depth, capital efficiency and overall trading experience. That is precisely what makes the next phase interesting.
The question is no longer whether Gate can reach the top tier of BTC spot trading within the set of exchanges Glassnode tracks. The data shows it has already done so.
The larger question is how durable this position becomes from here — whether Gate can keep converting market activity into sustainable liquidity, maintain deep BTC order books through both high-volatility and quieter periods, and retain the traders and market makers responsible for the increased flow.
For now the historical record is clear.
2.0% became 9.1%.
Four ranking positions were gained.
Nine months out of the last twenty-four reached the top three.
And Gate now sits at 3.
What makes the story impressive is not any single number. It is the combination of scale, consistency and time. A two-year climb has transformed Gate’s position in the BTC spot market, and the latest Glassnode data puts a measurable figure behind that transformation.
Gate did not simply appear on the leaderboard.
It climbed the leaderboard.
Now the market watches whether this two-year structural climb becomes the foundation for an even larger chapter ahead.
If you trade BTC spot, the numbers invite a practical question: have you noticed the difference in liquidity and execution as Gate’s share has grown? The platform that has already moved from 2.0% to 9.1% and into the global top three is continuing to compete for every unit of volume.
📊 It wasn't a good month, but two years of sustained growth.
In Glassnode's latest Week On-chain report, Gate's BTC spot performance is well worth looking at:
Over the past two years, Gate's BTC spot trading volume ranking rose by 4 places to enter the global top three, making it the platform with the biggest ranking improvement on the list.
Meanwhile, its BTC spot trading share also rose from 2.0% to 9.1%, likewise ranking first in growth.
More importantly, this was not a short-term spike—
Over the past 24 months, Gate ranked among the top three in BTC spot trading volume for 9 months.
Market rankings change every day, but a sustained increase in share over two years tells a different story: more and more trading is taking place on Gate.
#GateSquareMidAutumnReunion
repost-content-media
BTC+0.04%
#BTCShortTermPullback
BTC is sitting near $84,200 after a sharp reset — and the tape is telling two stories at once.
Bitcoin pushed as high as the $87,200–$87,400 zone earlier in the week before sliding back toward the $84,000 area. The 24-hour decline has measured roughly 3.5–3.7 percent depending on the exact reference high, with the low of the recent move testing the $82,800–$83,000 region. Along the way, long liquidations ran in the $280–$400 million range across major venues, the bulk of it concentrated on the long side. That kind of forced selling is a classic short-term leverage flush:
HighAmbition
#BTCShortTermPullback
BTC is sitting near $84,200 after a sharp reset — and the tape is telling two stories at once.
Bitcoin pushed as high as the $87,200–$87,400 zone earlier in the week before sliding back toward the $84,000 area. The 24-hour decline has measured roughly 3.5–3.7 percent depending on the exact reference high, with the low of the recent move testing the $82,800–$83,000 region. Along the way, long liquidations ran in the $280–$400 million range across major venues, the bulk of it concentrated on the long side. That kind of forced selling is a classic short-term leverage flush: over-extended positions get cleaned out, open interest resets, and the market is left with a clearer view of actual demand rather than leveraged speculation.
What elevates the current structure beyond a routine pullback is the simultaneous behavior of the U.S. spot Bitcoin ETFs. These vehicles have recorded net inflows for multiple consecutive sessions, including large single-day prints ranging from roughly $300 million to nearly $999 million earlier in the streak. Positive flows have continued even as price pulled back.
Cumulative multi-day inflows have pushed well into the billions. When leveraged longs are being liquidated on one side of the market while regulated institutional products keep absorbing supply on the other, two different time horizons are operating in parallel. Short-term speculative capital is being forced out; longer-term capital is still accumulating.
The price path that produced this setup is worth reviewing in more detail. After trading in the low-to-mid $80,000s, Bitcoin accelerated higher and briefly challenged the $87,000s.
Volume expanded on the advance, consistent with momentum participation. The subsequent decline was orderly once the initial wave of liquidations passed, rather than a disorderly cascade. That distinction matters. Disorderly selling often leaves deeper technical damage; orderly selling after a leverage flush more frequently resolves into consolidation or a renewed attempt higher once the forced flow is absorbed.
Technically, the short-term map is defined by a clear set of reference levels. Immediate support sits in the $82,800–$83,200 zone — the area where the recent liquidation cascade found buyers and where price has so far stabilized. Below that, the $80,800–$81,200 region marks the next significant shelf from the prior consolidation phase. On the upside, the first recovery zone is $85,500–$86,000. A sustained move through that band would open the door to a retest of the recent swing high near $87,200–$87,400. Volume on the way up earlier in the week was elevated; the pullback has seen solid but not extreme selling pressure once the forced liquidations cleared. That volume profile is consistent with digestion rather than distribution so far.
Two primary scenarios remain on the table.
If the $82,800–$83,200 support continues to hold and buyers step in with conviction on dips, the path of least resistance points toward a retest of the $86,000–$87,400 region. A successful reclaim of the mid-$86,000s would shift short-term momentum back in favor of the bulls and could invite another attempt at the recent highs. In that case the recent flush simply removed excess leverage, reset positioning, and left the market better conditioned for the next directional move. Traders watching for confirmation would look for rising volume on the rebound, a higher low relative to the $82,800–$83,000 area, and continued positive ETF flow data.
If that same support gives way on expanding volume, the next downside magnet sits closer to the $80,000–$81,000 zone. A clean break there would shift short-term sentiment more decisively and raise the probability of a deeper corrective phase before any sustained recovery.
Liquidity below those levels tends to thin out, so cascade risk would increase if stops begin triggering in sequence. In that scenario the market would likely need time to rebuild a base before attempting another sustained advance.
Macro conditions continue to supply an extra layer of complexity. The Federal Reserve delivered a 25-basis-point rate hike in mid-September, lifting the federal funds target range to 3.75–4.00 percent — the first increase in more than three years. Officials have emphasized that inflation remains above the 2 percent goal and that further tightening remains possible if price pressures do not ease sufficiently. At the same time, lingering Middle East tensions linked to Iran and the Strait of Hormuz have kept energy prices elevated and introduced a persistent risk premium into global markets.
Higher oil and diesel costs feed into broader inflation expectations, which in turn keep the Fed’s policy path less predictable. Risk assets, including Bitcoin, are therefore trading against a backdrop of tighter monetary policy and ongoing geopolitical friction in energy markets.
These macro factors do not dictate Bitcoin’s short-term direction in a mechanical way, but they influence the broader risk environment in which price is moving. Periods of elevated policy uncertainty and energy-price volatility often increase the amplitude of swings in risk assets. That is one reason the current range between roughly $83,000 and $87,400 has become the immediate battleground: it sits at the intersection of technical levels and a macro regime that is still adjusting to the latest Fed action and energy-market developments.
Market sentiment at present occupies the classic “healthy pullback versus early trend reversal” debate. The size of the percentage decline and the volume of long liquidations argue for a constructive reset after a strong advance. The persistence of ETF inflows and the fact that price has so far defended the low-$83,000s argue against an immediate structural breakdown. Positioning data and liquidation heatmaps still show meaningful long exposure stacked not far below current levels, which means another wave of forced selling remains possible if support is retested.
Conversely, a decisive reclaim of the recent highs would force short covering and could accelerate upside as sidelined capital re-enters.
The short-term signals that matter most from here are concrete and observable. First, whether the $82,800–$83,200 zone continues to attract buyers on dips and produces higher lows. Second, how quickly any rebound attempts reclaim and hold the $85,500–$86,000 area. Third, whether ETF net inflows remain positive even while price consolidates or chops. Fourth, the behavior of volume: expansion on upside breaks would support the bullish case, while expansion on downside breaks would favor the deeper-correction scenario. Finally, the evolution of open interest and funding rates will indicate whether leverage is being rebuilt too quickly or whether the market is approaching the next move from a cleaner base.
Bitcoin has already demonstrated that it can absorb a multi-hundred-million-dollar long flush, stabilize above key prior support, and continue to attract institutional capital through ETFs. That combination does not guarantee the next directional move, yet it frames the current structure as a high-information moment rather than random noise. The market is no longer simply reacting to the prior surge; it is now processing the consequences of that surge, the leverage that accompanied it, and the steady institutional bid that has remained present throughout.
In the sessions ahead, daily closes relative to the $83,000 and $86,000 reference zones will carry more weight than intraday noise. A series of closes above the mid-$86,000s would strengthen the case that the pullback has completed its work.
Sustained closes below $83,000 would increase the odds that a deeper corrective phase is underway. Until one of those outcomes materializes, the market remains in a two-sided, high-attention regime — one in which both the liquidation reset and the ongoing ETF demand are visible on the same tape.
The next few daily closes will clarify whether Bitcoin is simply catching its breath after a strong advance or whether the recent weakness marks the beginning of a more meaningful shift in short-term momentum. For now the structure remains defined by the tension between cleaned-up leverage on one side and persistent institutional accumulation on the other — a tension that rarely resolves quietly.#GateSquareMidAutumnReunion $BTC ‌
repost-content-media
#GateIdleEarnAddsUSD1UpTo8.16APR .
Gate USD1 Idle Earn: Make Your Idle Capital Work
In crypto, not every opportunity comes from buying the next token before it moves.
Sometimes, the smarter approach is deciding what to do with your capital while you wait.
A trader may be waiting for BTC to reach a better entry zone. An investor may be keeping dollar-denominated liquidity aside for the next opportunity. Another user may simply want to hold a stable asset instead of taking additional market exposure.
This is where Gate Idle Earn and USD1 become interesting.
Eligible USD1 holdings can potentially
HighAmbition
#GateIdleEarnAddsUSD1UpTo8.16APR .
Gate USD1 Idle Earn: Make Your Idle Capital Work
In crypto, not every opportunity comes from buying the next token before it moves.
Sometimes, the smarter approach is deciding what to do with your capital while you wait.
A trader may be waiting for BTC to reach a better entry zone. An investor may be keeping dollar-denominated liquidity aside for the next opportunity. Another user may simply want to hold a stable asset instead of taking additional market exposure.
This is where Gate Idle Earn and USD1 become interesting.
Eligible USD1 holdings can potentially earn up to 8.16% APR, depending on current program conditions, eligibility and applicable terms.
The idea is simple: instead of allowing eligible USD1 holdings to remain completely inactive, users can explore an earning option within the Gate ecosystem while maintaining a dollar-pegged asset position.
What Does 8.16% APR Mean?
APR — Annual Percentage Rate — represents an annualized rate of return.
At an illustrative 8.16% APR:
$100 = approximately $8.16 annualized
$500 = approximately $40.80 annualized
$1,000 = approximately $81.60 annualized
$5,000 = approximately $408 annualized
These are illustrations, not guaranteed earnings. The actual return depends on the current APR, eligibility, balance, program duration and applicable conditions.
Most importantly, “up to 8.16% APR” does not mean a permanently fixed or guaranteed 8.16% return.
Users should always check the current rate and terms before participating.
Why USD1 Makes This Interesting
Traditional crypto assets such as BTC and ETH can experience significant price movements.
USD1 is designed around a different objective: maintaining a value intended to track the US dollar.
That makes a dollar-pegged asset different from taking a directional position in a volatile cryptocurrency.
Consider a trader who has exited BTC and is waiting for another setup.
They may not want to immediately buy another volatile asset, but they may also prefer not to leave eligible capital completely inactive.
This creates an alternative:
Maintain dollar-oriented liquidity + potentially earn yield + wait for the right market opportunity.
It does not eliminate risk, but it can make idle capital more purposeful.
The Real Advantage: Capital Efficiency
The word “Idle” is important.
Capital often sits on the sidelines for a reason.
Maybe BTC is near resistance.
Maybe the market is too volatile.
Maybe a trader is waiting for confirmation.
Maybe an investor wants to maintain liquidity.
Instead of forcing a trade simply because capital is available, eligible USD1 can potentially participate in an earning program while the user waits.
That changes the mindset from:
“I need to trade constantly.”
to:
“I can wait for the right opportunity while potentially earning on eligible idle capital.”
For disciplined traders, that distinction matters.
Key Advantages of Gate USD1 Idle Earn
1. Potentially Competitive Yield
The headline attraction is the advertised up to 8.16% APR for eligible USD1 holdings.
For someone already planning to hold USD1, the possibility of earning additional returns can make the holding strategy more productive.
2. Dollar-Pegged Exposure
USD1 is designed to track the US dollar rather than behave like a typical volatile crypto asset.
This can be useful for users seeking dollar-oriented liquidity without taking the same directional exposure as BTC or ETH.
However, dollar-pegged does not mean completely risk-free.
3. Simple Automation
Users do not necessarily need to monitor charts constantly or manually execute complicated DeFi yield strategies.
A platform-integrated earning product can provide a simpler way to explore yield generation within the Gate ecosystem.
4. Flexible Capital Strategy
For traders, liquidity is valuable.
Keeping capital available means you can reassess when a new market opportunity appears instead of being forced to sell another position.
If eligible funds can also potentially generate yield while waiting, the capital has an additional purpose.
5. Easy Access
The earning functionality is integrated into the Gate ecosystem, making it easier to manage eligible assets and earning settings from one platform.
Why This Can Matter During Market Volatility
Crypto markets never stop.
BTC can rally sharply and then retrace. Altcoins can move even faster.
During uncertain conditions, having liquidity available can be more valuable than chasing every move.
Imagine BTC is approaching a major resistance level and you do not want to chase the breakout.
You could keep eligible capital in USD1 while waiting for confirmation and potentially earn according to the current Idle Earn conditions.
Then, if a suitable setup appears, you can reassess your allocation.
The objective is not to predict every move.
It is capital efficiency and patience.
Sometimes the best trade is the trade you avoid.
APR vs. Compounding
APR and APY are not exactly the same.
APR is generally an annualized simple rate and does not automatically mean the return is compounded.
If earnings are added to principal and subsequently generate additional earnings, the effective return can differ.
Therefore, an advertised 8.16% APR should not automatically be interpreted as an 8.16% guaranteed compounded return.
Always review the actual earning mechanics and current terms shown by Gate.
Practical Example
Suppose a trader holds $2,000 of eligible USD1 while waiting for BTC to reach a preferred technical zone.
At an illustrative 8.16% APR:
$2,000 × 8.16% = $163.20 annualized
Again, this is a mathematical illustration, not a guaranteed payout.
The actual result depends on the applicable rate, eligibility and program conditions.
The bigger idea is simple:
If the capital is already intended to remain in USD1, it may be worth exploring whether an eligible earning option can make that waiting period more productive.
How to Start
Getting started is designed to be straightforward, subject to current availability and eligibility:
Step 1: Log in to your verified Gate account.
Step 2: Make sure you hold the required USD1 balance.
Step 3: Open the relevant Finance / Earn section.
Step 4: Select Idle Earn and check whether USD1 is currently supported for your account.
Step 5: Review the current APR, eligibility requirements, balance conditions, withdrawal rules and other applicable terms.
Step 6: If the conditions fit your strategy, activate the feature according to the instructions displayed by Gate.
Who Could Find It Useful?
Active Traders:
Potentially earn on eligible stablecoin liquidity while waiting between trades.
Long-Term Investors:
Explore an earning option for eligible dollar-denominated reserves.
Stablecoin Holders:
Consider whether Idle Earn makes sense for USD1 that would otherwise remain inactive.
DeFi Users:
Access an integrated earning option without necessarily navigating multiple external protocols.
Beginners:
Explore a simpler approach to stablecoin-based earning while first understanding the associated risks.
Important: Yield Does Not Mean Risk-Free
A high APR should never automatically be interpreted as risk-free income.
Users should consider several factors:
Asset risk: A dollar-pegged asset is designed to maintain its peg, but this does not mean zero risk.
Platform risk: Digital assets held through a centralized platform involve operational and platform considerations.
Program risk: Rates, eligibility and conditions can change.
Liquidity conditions: Users should understand the applicable withdrawal and access rules.
Rate risk: An “up to” APR may not remain at the same level indefinitely.
The correct approach is therefore:
Potential return + understanding the risks.
Do not focus on the headline percentage alone.
Security Still Matters
Yield should never be the only factor when deciding where to hold digital assets.
Gate provides security and risk-management infrastructure across its ecosystem, but no responsible financial product should be described as completely risk-free or guaranteed.
Users should maintain strong account security, use appropriate authentication protections and review the current product information before participating.
Idle Earn vs. Active Trading
Active trading requires constant decisions:
When to enter?
Where to place a stop?
When to take profit?
What happens if BTC breaks support?
Idle Earn follows a different philosophy.
Instead of trying to profit from every short-term market movement, eligible USD1 can potentially generate returns while the user waits.
The strategy becomes:
Maintain liquidity → potentially earn while waiting → deploy capital when the setup fits.
That can be particularly useful when markets are moving sideways or volatility makes directional trades less attractive.
The Bigger Picture
Good capital management is not only about finding the highest possible return.
It is also about managing:
Liquidity + risk + timing + opportunity cost.
A portfolio can have trading capital, long-term holdings and stable liquidity.
For eligible USD1 holders, Idle Earn can potentially add another layer: productive idle capital.
There is no universal allocation that works for everyone. The right approach depends on individual goals, liquidity needs and risk tolerance.
But the principle is powerful:
Capital should have a purpose, even when you are waiting.
Final Takeaway
The real attraction of Gate USD1 Idle Earn is not simply the headline 8.16% APR.
It is the possibility of making eligible idle capital more productive without turning every dollar into an active trading position.
Markets do not offer a good entry every hour.
Sometimes BTC is overextended.
Sometimes volatility is too high.
Sometimes the best decision is simply to wait.
During those periods, eligible USD1 holdings can potentially generate an annualized return through Idle Earn, subject to the current program terms and conditions.
For traders, it can potentially turn waiting liquidity into productive liquidity.
For investors, it provides another option for managing eligible dollar-pegged assets.
For stablecoin holders, it creates an opportunity to explore whether their USD1 balance can generate additional returns.
But the smartest approach is to look beyond the headline number.
Check the current APR, eligibility, terms, liquidity, risks and your own financial objective before participating.
Because successful capital management is not simply about chasing the biggest yield.
It is about understanding what you are earning, why you are earning it, what risks you are accepting, and how the product fits into your overall strategy.
Idle capital does not have to mean forgotten capital.
With proper risk awareness and a clear strategy, even the time spent waiting for the next market opportunity can potentially become part of a more efficient capital-management plan.
Gate USD1 Idle Earn — make your eligible idle capital work while you wait for the next opportunity.
#GateSquareMidAutumnReunion
repost-content-media
#USSeptemberCompositePMISurgesTo58.4
US September Composite PMI Hits 58.4 — The Strongest in 5+ Years
The US economy just delivered a data shock. S&P Global's flash Composite PMI jumped to 58.4 in September, up from 56.0 in August and well above the 55.2 consensus forecast. That is a 62-month high — the fastest pace of private-sector expansion since July 2021 — and a fourth straight month of accelerating growth.
WHAT 58.4 ACTUALLY MEANS
In PMI terms, 50 is the dividing line. Above 50 signals expansion, below 50 signals contraction. A reading of 58.4 indicates relatively strong, broad-based gr
HighAmbition
#USSeptemberCompositePMISurgesTo58.4
US September Composite PMI Hits 58.4 — The Strongest in 5+ Years
The US economy just delivered a data shock. S&P Global's flash Composite PMI jumped to 58.4 in September, up from 56.0 in August and well above the 55.2 consensus forecast. That is a 62-month high — the fastest pace of private-sector expansion since July 2021 — and a fourth straight month of accelerating growth.
WHAT 58.4 ACTUALLY MEANS
In PMI terms, 50 is the dividing line. Above 50 signals expansion, below 50 signals contraction. A reading of 58.4 indicates relatively strong, broad-based growth, not just a marginal pickup.
The detail is even more striking:
- Services PMI: 58.7 (up from 56.5, above the 56.0 forecast) — the strongest in nearly five years
- Manufacturing PMI: 57.0 (up from 53.9, above the 53.6 forecast) — the highest since May 2022
Chris Williamson, Chief Business Economist at S&P Global, says the survey is consistent with annualized economic growth of roughly 5%, with about 4% growth signaled for the third quarter overall. The economy is not just holding up — it is re-accelerating.
THE INFLATION TWIST NOBODY EXPECTED
Strong growth alone would be bullish. But this PMI report came with a hawkish sting:
- Input costs are rising at the fastest pace in four years
- Order backlogs hit their most severe level in nearly two decades outside the pandemic
That is a classic demand-driven inflation signal. Growth this hot, with costs this sticky, makes it much harder for the Fed to justify cutting rates.
THE BOND MARKET REACTED VIOLENTLY
This is the part that ripples through every asset class:
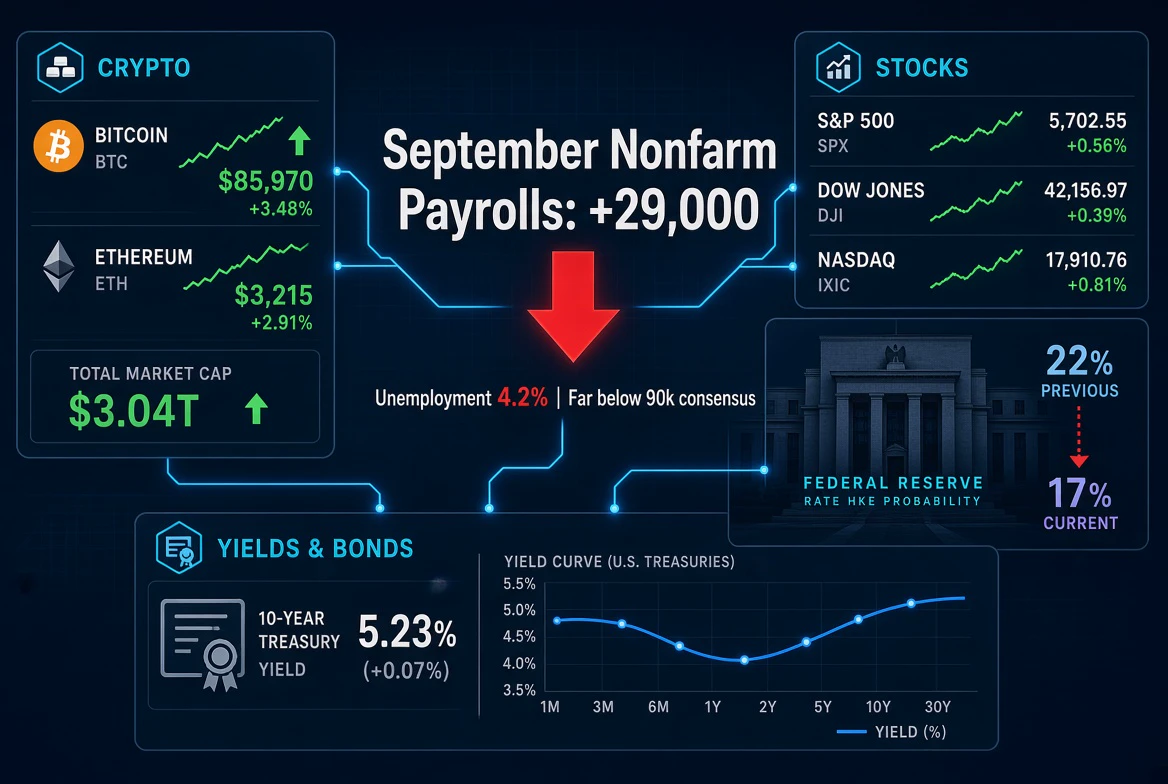
- 10-year Treasury yield jumped to roughly 5.11 to 5.13 percent, a level not seen since 2007
- The entire yield curve sold off (prices down, yields up)
- The US Dollar strengthened across the board
- Markets now price around 70 percent odds of an October rate HIKE, not a cut
Higher yields mean a higher risk-free rate, which raises the hurdle every other asset must clear.
IMPACT ON US STOCKS
It is a double-edged sword:
- Good news: strong PMI signals strong corporate earnings potential
- Bad news: higher yields compress valuations, especially for high-multiple growth and tech names
Near term, the discount-rate effect usually wins first. Expect pressure on growth and tech stocks, real estate, and other rate-sensitive sectors. Value, energy, and financials tend to hold up better. Watch for a rotation out of momentum into cyclicals and defensives.
IMPACT ON CRYPTO
Crypto felt it immediately — higher yields directly hit non-yielding risk assets.
- Bitcoin slid roughly 4 percent from its recent peak near 87,000 to an intraday low around 83,200 on September 23-24
- BTC now trades around 84,180 (up 0.23 percent over 24 hours)
- ETH around 2,679 (down 0.15 percent over 24 hours)
- SOL around 116.41 (up 1.33 percent over 24 hours)
The selloff flushed leveraged longs — a sharp yield spike tends to trigger cascading liquidations in the perpetuals market. Altcoins bore the brunt, with WLD and PEPE both posting double-digit 24-hour losses at one point.
Why it matters structurally:
- A roughly 5 percent risk-free Treasury yield raises the opportunity cost of holding zero-yield assets like BTC
- It also tightens global liquidity, the single most important driver of crypto cycles
- Short term, crypto remains hostage to the macro tape: good news for the economy is being read as bad news for risk assets
IMPACT ON GOLD AND SILVER
Precious metals took the hit too, despite their inflation-hedge narrative:
- Gold fell 1.53 percent to around 4,291 per ounce
- Silver fell 3.51 percent to around 64.71 per ounce
Rising real yields (nominal yields rising faster than inflation expectations) make gold, another zero-yield asset, less attractive. Some analysts note the same PMI report shows inflation pressures the gold market has not fully priced in yet, so the selloff could prove overdone.
THE BIGGER PICTURE: LIQUIDITY AND VOLUME SHIFT
The macro rotation right now is basically:
Strong growth → higher yields → stronger dollar → capital rotates toward cash and bonds → pressure on stocks, crypto, and gold
- Liquidity is being pulled toward short-duration US fixed income paying 5 percent or more
- Volume concentrates in rate-sensitive trades (Treasuries, FX, gold) while risk assets see positioning-driven selling
- Crypto derivatives see liquidation cascades that amplify short-term volatility
WHAT TO WATCH NEXT
1. Fed speakers and the October meeting — any pushback on the 70 percent hike pricing moves everything
2. Next CPI and PCE print — if inflation confirms the PMI cost signal, yields can go higher still
3. US dollar index (DXY) — sustained strength is the biggest headwind for BTC and gold
4. Crypto liquidations and funding rates — watch whether the flush is a shakeout or the start of deeper de-risking
BOTTOM LINE
58.4 is a genuinely strong number — great for the real economy, but a short-term headwind for risk assets. The immediate market reaction is not about weak growth; it is about growth being so strong that rates stay higher for longer. For crypto and stocks, macro once again calls the shots until the data or the Fed changes the story.
#GateSquareMidAutumnReunion
repost-content-media
🔥Mid-Autumn Festival event is in full swing|Come to Gate Live to win Mid-Autumn gifts
👀 Watch the livestream and complete interactive tasks to win gifts
✅The first 100 eligible users will receive 1–5 USDT in cash rewards
✅Lucky users will receive a Gate Mid-Autumn limited-edition gift box
🎙️ Become a streamer and go live for even more gifts
✅TOP 3 will receive a Gate Mid-Autumn limited-edition gift box
✅TOP 20 will share 5,000 USDT position trial vouchers
Watch the livestream, participate in interactions, and earn points; go live to discuss the market and climb the leaderboard—take home Mid
HighAmbition
🔥Mid-Autumn Festival event is in full swing|Come to Gate Live to win Mid-Autumn gifts
👀 Watch the livestream and complete interactive tasks to win gifts
✅The first 100 eligible users will receive 1–5 USDT in cash rewards
✅Lucky users will receive a Gate Mid-Autumn limited-edition gift box
🎙️ Become a streamer and go live for even more gifts
✅TOP 3 will receive a Gate Mid-Autumn limited-edition gift box
✅TOP 20 will share 5,000 USDT position trial vouchers
Watch the livestream, participate in interactions, and earn points; go live to discuss the market and climb the leaderboard—take home Mid-Autumn gifts!
Sign up now 👉 https://www.gate.com/zh/campaigns/6228
Go live now 👉https://www.gate.com/live
‍#GateLive #GateMid-Autumn #GateSquareMidAutumnReunion
repost-content-media
#中秋交易分享 #Gate广场中秋团圆局
My Mid-Autumn BLESS Trade
🎁🌕 My Mid-Autumn Trading Share:
Why I’m Still Watching $BLESS Closely
This Mid-Autumn Festival, instead of simply talking about what I want to buy, I want to share one of the trades
I have actually been following closely: $BLESS.
I genuinely enjoy trading BLESS because it is one of those assets that can move very quickly when liquidity and market attention return.
For me, BLESS is not just another random altcoin on the watchlist — I have actually traded it, held it, watched its volatility, studied its support and resistance zones, and contin
HighAmbition
#中秋交易分享 #Gate广场中秋团圆局
My Mid-Autumn BLESS Trade
🎁🌕 My Mid-Autumn Trading Share:
Why I’m Still Watching $BLESS Closely
This Mid-Autumn Festival, instead of simply talking about what I want to buy, I want to share one of the trades
I have actually been following closely: $BLESS.
I genuinely enjoy trading BLESS because it is one of those assets that can move very quickly when liquidity and market attention return.
For me, BLESS is not just another random altcoin on the watchlist — I have actually traded it, held it, watched its volatility, studied its support and resistance zones, and continued following its market structure through both rallies and pullbacks.
My recorded BLESS entry is $0.08963.
And I want to be completely transparent about this position: at the current market price around $0.0096, this position is significantly below my original entry. I am not going to hide that or pretend that I am sitting on profit.
That is exactly why I think sharing real trading experiences is more valuable than only posting screenshots of successful trades.
📊 BLESS MARKET SNAPSHOT
Current price: around $0.00960–$0.00962
24H change: approximately +7.4%
24H high: around $0.01013–$0.01030
24H low: around $0.00892–$0.00893
Recent close: around $0.00957
Recent market cap estimates:
roughly $17M–$24M, depending on the data provider and circulating-supply methodology.
24H trading volume: roughly $1.6M–$3.0M across tracked markets/data sources.
Gate BLESS/USDT volume was also reported around $900K on one tracked market snapshot, showing that BLESS has meaningful trading activity on Gate as well.
What immediately catches my attention is the recovery from the recent lower levels.
BLESS traded around $0.00782 on September 10, then moved toward the $0.00970 area by September 20, showing that this market can produce sharp percentage moves even within a relatively short period.
That volatility is exactly what makes BLESS interesting to me — but it is also exactly why risk management matters.
🔥 WHY I LIKE TRADING BLESS
The first reason is volatility.
BLESS is not a slow-moving asset.
When volume enters, the percentage moves can become much larger than what we normally see in major-cap assets.
The second reason is liquidity.
A market with millions of dollars in daily turnover gives traders more activity to monitor, although BLESS remains a much smaller-cap and higher-risk asset than BTC or ETH.
Current market data shows millions of dollars of daily BLESS trading activity across multiple venues.
The third reason is the recovery structure.
After trading near $0.0078–$0.0080 earlier this month, BLESS recovered back toward the $0.0095–$0.0097 region. That tells me buyers are still participating in the market rather than completely abandoning the asset.
📌 THE LEVELS I AM WATCHING
Current zone: $0.0095–$0.0097
Immediate support: $0.0090–$0.0092
Major support: $0.0087–$0.0089
Lower support: $0.0080–$0.0083
Critical downside zone: $0.0077–$0.0080
If BLESS loses the $0.0080 region with strong selling volume, I would become much more cautious.
On the upside, the first major area I want to see reclaimed is:
$0.0101–$0.0103
That zone is important because the recent high is around the $0.0101–$0.0103 area. A clean breakout above it with increasing volume would provide a stronger indication that buyers are attempting to push the market into a new range.
🚀 MY UPSIDE ROADMAP
If BLESS successfully breaks and holds above $0.0103, I would watch:
TP1: $0.0108
TP2: $0.0115
TP3: $0.0125
Extended target zone: $0.0135–$0.0150
These are not guaranteed prices.
They are simply the levels I would monitor if momentum, volume and broader altcoin conditions continue supporting the move.
The most important thing for me is not reaching a particular target overnight.
The important thing is whether BLESS can establish higher highs and higher lows while volume expands.
💰 MY BLESS TRADE
My entry: $0.08963
Current market: ~$0.0096
That means my original entry is currently far above the market, so I am carrying a substantial unrealized loss on this position.
I am sharing this openly because trading is not only about showing green P&L screenshots.
Sometimes the market moves against you.
Sometimes your entry is early.
Sometimes an asset takes much longer than expected to recover.
And sometimes the correct response is not emotional averaging, but reassessing the market structure and risk.
For me, the lesson from BLESS is simple:
A conviction trade still needs risk management.
📈 WHAT WOULD MAKE ME MORE BULLISH?
I want to see three things:
1️⃣ BLESS holds above $0.0090–$0.0092 during pullbacks.
2️⃣ Price breaks $0.0101–$0.0103 with meaningful volume.
3️⃣ After the breakout, the old resistance becomes support.
If those conditions develop together, the market structure would become more constructive from my perspective.
On the other hand, if BLESS repeatedly rejects around $0.0100–$0.0103 and volume starts disappearing, I would not chase the price.
⚠️ WHAT WOULD MAKE ME CAUTIOUS?
A breakdown below $0.0087 would make me more defensive.
A sustained move below $0.0080 would be even more important because that region has acted as a recent lower-price area.
I would rather wait for confirmation than blindly buy every dip.
That is especially important with smaller-cap altcoins where volatility can become extreme.
🌕 WHAT I WANT TO BUY NEXT
For the next trade, I am not looking only at the cheapest coin.
I want to see:
• Strong volume
• Improving liquidity
• Clear support
• A confirmed breakout
• Healthy market structure
• Increasing community attention
• BTC stability
• And preferably broader altcoin strength
If those conditions return, BLESS remains one of the assets I will continue monitoring closely.
🔥 MY BLESS THESIS
The interesting part about BLESS for me is the combination of volatility, relatively small market capitalization and the ability to generate significant percentage movements when trading activity increases.
But I also understand the other side.
Small-cap assets can move both ways extremely fast.
A +10% move can happen quickly.
A -10% move can happen just as quickly.
That is why I don't want to build my strategy around hype alone.
I want price + volume + liquidity + market structure to confirm the trade.
And right now, the most important battle for BLESS is around the $0.0100–$0.0103 resistance zone.
A successful breakout could open the door toward $0.0115, $0.0125 and potentially $0.0135–$0.0150.
But if price loses the $0.0080 area, the bullish structure would need to be reassessed.
🎁 MID-AUTUMN TRADING LESSON
This is what I like about trading events such as this one.
We don't have to pretend every trade is profitable.
We can share the real journey.
My BLESS trade is still a trade I am watching.
My entry is much higher than the current price, I know the risk, I know the volatility, and I am watching the market for confirmation rather than making emotional decisions.
For me, the next big question is simple:
Can BLESS turn the current recovery into a sustained breakout, or will resistance around $0.0100–$0.0103 send it back toward lower support?
That is the setup I will be watching.
And if the broader altcoin market starts strengthening, BLESS is definitely one of the coins I will keep on my radar.
🌕 Happy Mid-Autumn Festival to everyone in the Gate community.
Share your real trades.
Share your wins.
Share your losses.
Share what you are holding.
And most importantly, share what you are learning.
Because every trade — profitable or not — can teach us something.
#中秋交易分享 #Gate广场中秋团圆局
repost-content-media
BLESS-8.06%
BTC+0.04%