Square
Following
Hot
News
Profile

CcChenYifan

vip
Diamond Hands
Market Analyst
Futures Trading Strategist
Official partner analyst, long-term returns, just passing by, feel free to follow. Focused for 11 years, mainstream coin precise strategies updated daily in real-time.
0
Following
87
Followers
1.7k
Liked
Pin
#晒出我的合约收益#Go all-in directly, take profits and secure your gains, remind everyone every day that a rebound is just a fake, is it really a fake #BTC #ETH
BTC+1.23%
ETH+1.00%
  • 2
10.2 Analysis in the early hours of the day$BTC
Everyone has eaten quite a bit today, huh?
On the current 4-hour chart, BTC came under clear selling pressure and pulled back after surging to 85632, leaving a long upper wick, which indicates heavy overhead selling pressure. This surge looks more like a one-off pulse rebound rather than a trend reversal. The current price is fluctuating near the Bollinger middle band, while the upper band is trending downward, and upward momentum has clearly weakened.
The MACD red bars continue to shorten, DIF is struggling to move higher, and bullish momentum
BTC+1.20%
10.1$BTC Midday Analysis
· Short-term positive factor (PCE data): U.S. core PCE rose 3.0% year on year in August, below the expected 3.3%, cooling market bets on a Federal Reserve rate hike in October.
· Main pressure (U.S. Treasury yields): The U.S. 10-year Treasury yield remains elevated at around 5.28%. When Treasuries can offer risk-free returns of over 5%, the opportunity cost of holding zero-yield assets such as Bitcoin rises sharply, directly limiting Bitcoin’s valuation ceiling. Bollinger Bands (BOLL): The price (83857.1) is above the middle band (83537.1) but constrained by the upper
post-image
BTC+1.20%
October 1, $BTC early morning analysis
On the 4-hour timeframe, BTC surged to 85632 before coming under pressure and retreating. The long upper wick on the candlestick reveals heavy selling pressure above. This rally is a short-term impulse rebound, not a trend reversal. The current price has fallen back below the upper Bollinger Band, while the upper band has begun to turn downward, indicating that upward momentum is weakening.
Although MACD still shows red bars, the upward slope of DIF has slowed, and the red bars have begun to contract, indicating that bullish strength is fading. This is a
post-image
BTC+1.20%
September 30 $BTC Outlook
Technically, it is in an “intermediate state” where bearish momentum is fading but bulls have yet to take over—the shrinking MACD green bars suggest selling pressure is easing, while the narrowing Bollinger Bands indicate that a directional choice is approaching; meanwhile, the news presents a clear tug-of-war between two extremes: on one side, macro pressure from the start of the Fed’s rate-hike cycle, surging U.S. Treasury yields, and geopolitical risks; on the other, bottom support from record ETF inflows and continued institutional accumulation.
The net effect of
post-image
BTC+1.20%
Guys, this time around, I’m not calling for a takeoff—I’m telling you to fasten your seat belts. Don’t see the rally and immediately shout “the bull is back.” This looks more like giving those who haven’t exited a breath to escape, not handing tickets to those who haven’t boarded. When I said it would fall before, I wasn’t trying to scare anyone—the price-volume action and structure didn’t confirm it. The current bounce doesn’t mean the trend has reversed; it only means the bears are taking a temporary breather.
The bearish logic is simple:
First, the price-volume action is off. Volume expands
post-image
Everyone on the team, let’s all take off together. When it first started rising, I told everyone to stay firm and not panic. So, are you enjoying it now? The rebound is simply giving you a chance to do “kong.”#BTC #ETH #BTC走势分析
post-image
BTC+1.23%
ETH+1.00%
September 29 $BTC Evening Analysis
Macroeconomic pressure: The 10-year US Treasury yield broke above 5.2%, increasing the opportunity cost of holding non-yielding assets. Meanwhile, US PCE and nonfarm payrolls data are due to be released soon, and market expectations for another Fed rate hike have risen to around 70%, serving as the main source of pressure on the current rebound.
· Geopolitical risk: The US rejected Iran’s ceasefire proposal, sending Brent crude to around $107 and driving up inflation expectations, further pressuring risk assets.
· Divergence in liquidity: US spot Bitcoin ETF
BTC+1.23%
ETH+0.95%
BZ+4.15%
September 29 $ETH Analysis
CME data shows the probability of a rate hike in October has risen to 68.1%, while bond yields continue to climb. Meanwhile, geopolitical risks are heating up—Trump has not ruled out taking military action against Iran, putting overall risk assets under pressure. As part of the risk-asset class, the crypto market has been indirectly affected.
Retail position data shows that 72.7% of accounts are long, while top futures traders also have 60.3% of their positions held long. This excessively crowded long setup has historically often been resolved by "first clearing out
ETH+1.00%
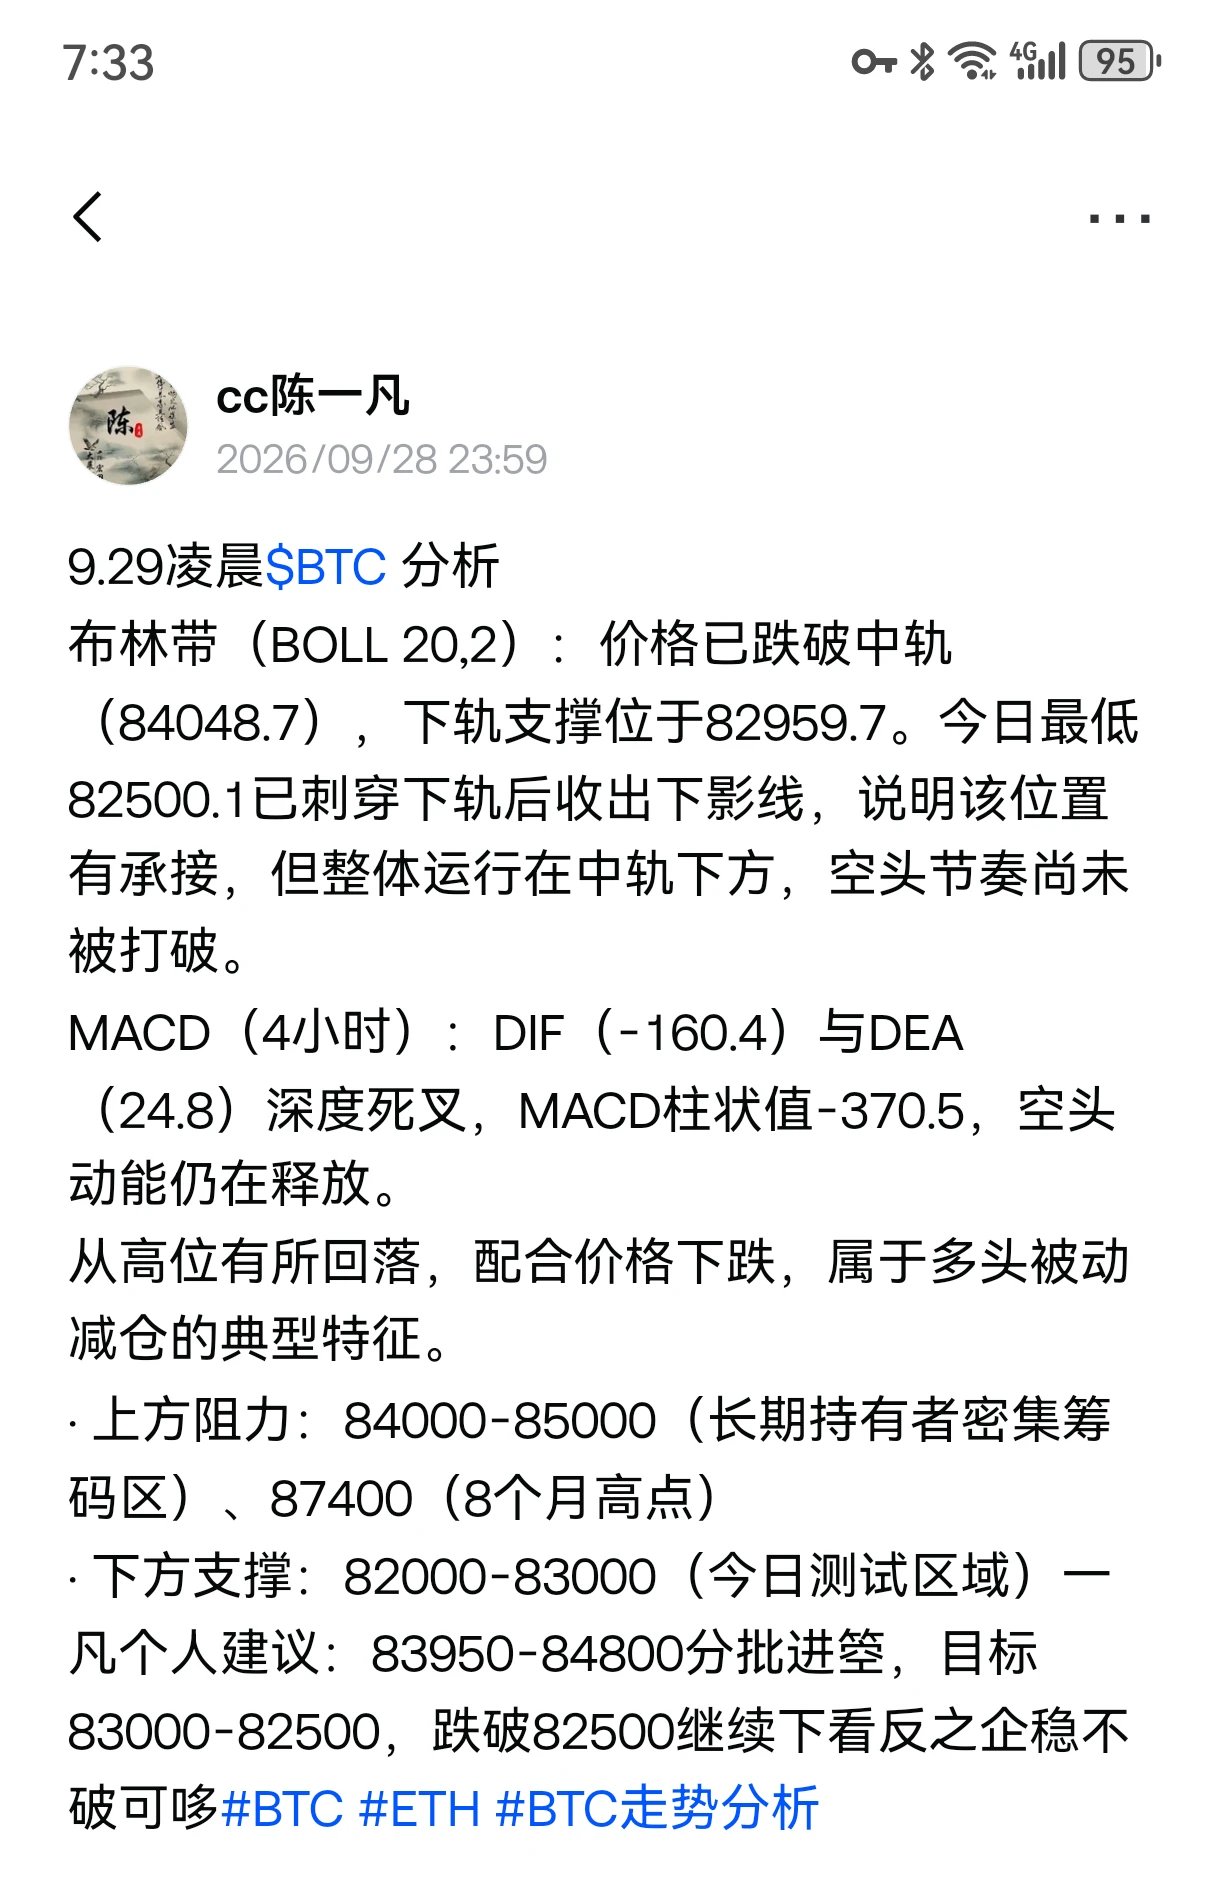
September 29 $BTC Morning Analysis
The hawkish remarks by Federal Reserve Governor Cook in the early hours triggered a hit to market sentiment, with selling pressure emerging and net capital outflows of $324 million. Large sell orders appeared on the order book, releasing short-term bearish sentiment without disrupting the broader market structure.
Technically, the price rebounded after bottoming at 82500.1, while the Bollinger Bands narrowed and the lower band at 82865.6 formed support. The MACD green bars gradually narrowed, indicating weakening downward momentum and a consolidation bottomi
post-image
BTC+1.20%
ETH+0.95%
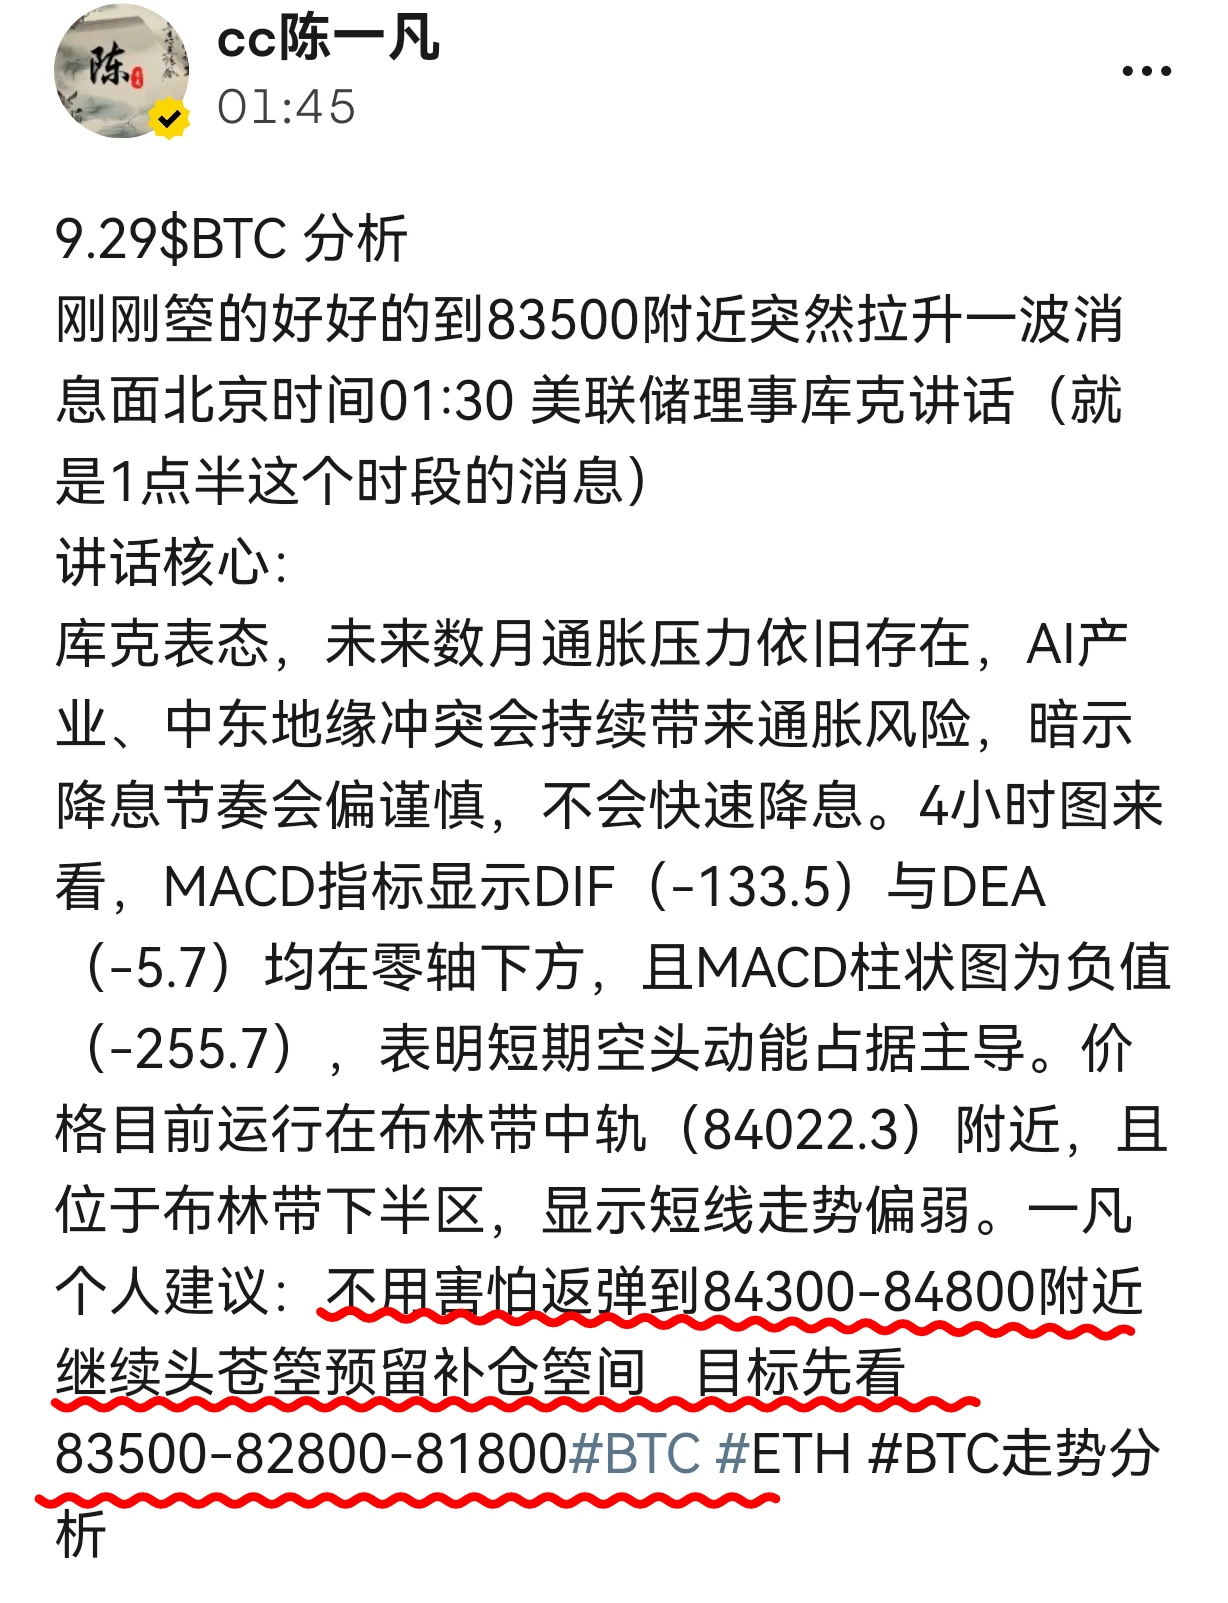
9.29$BTC Analysis
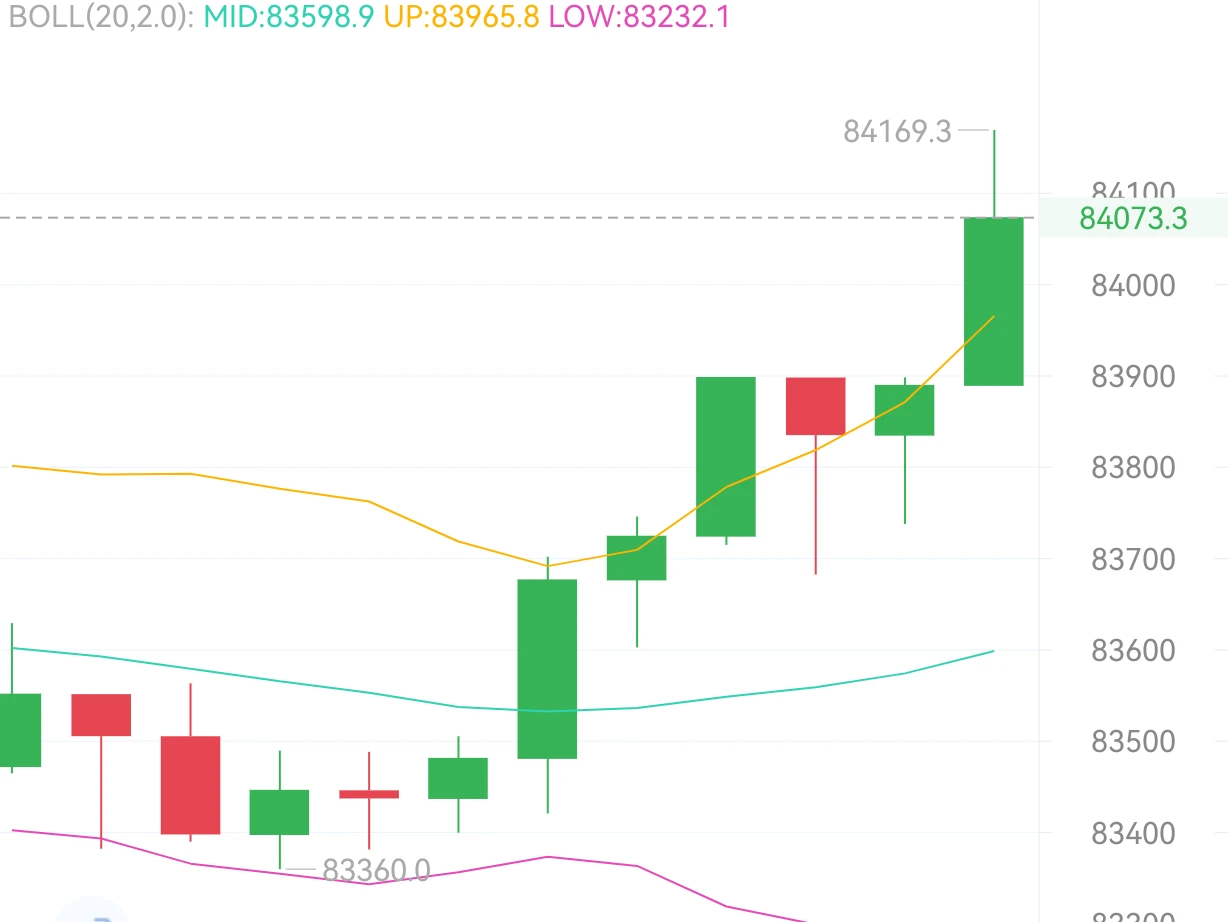
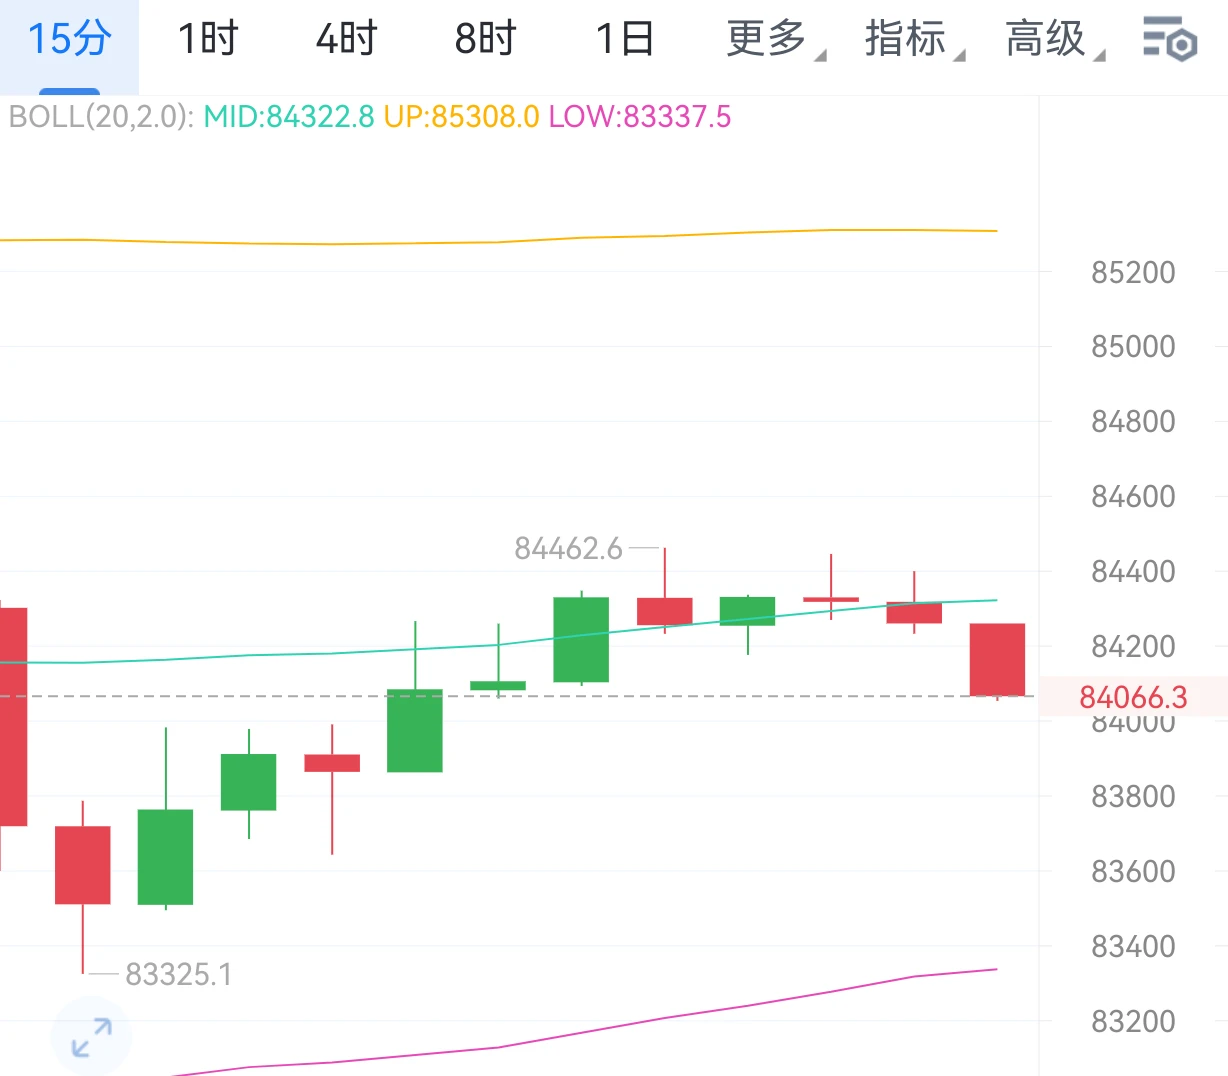
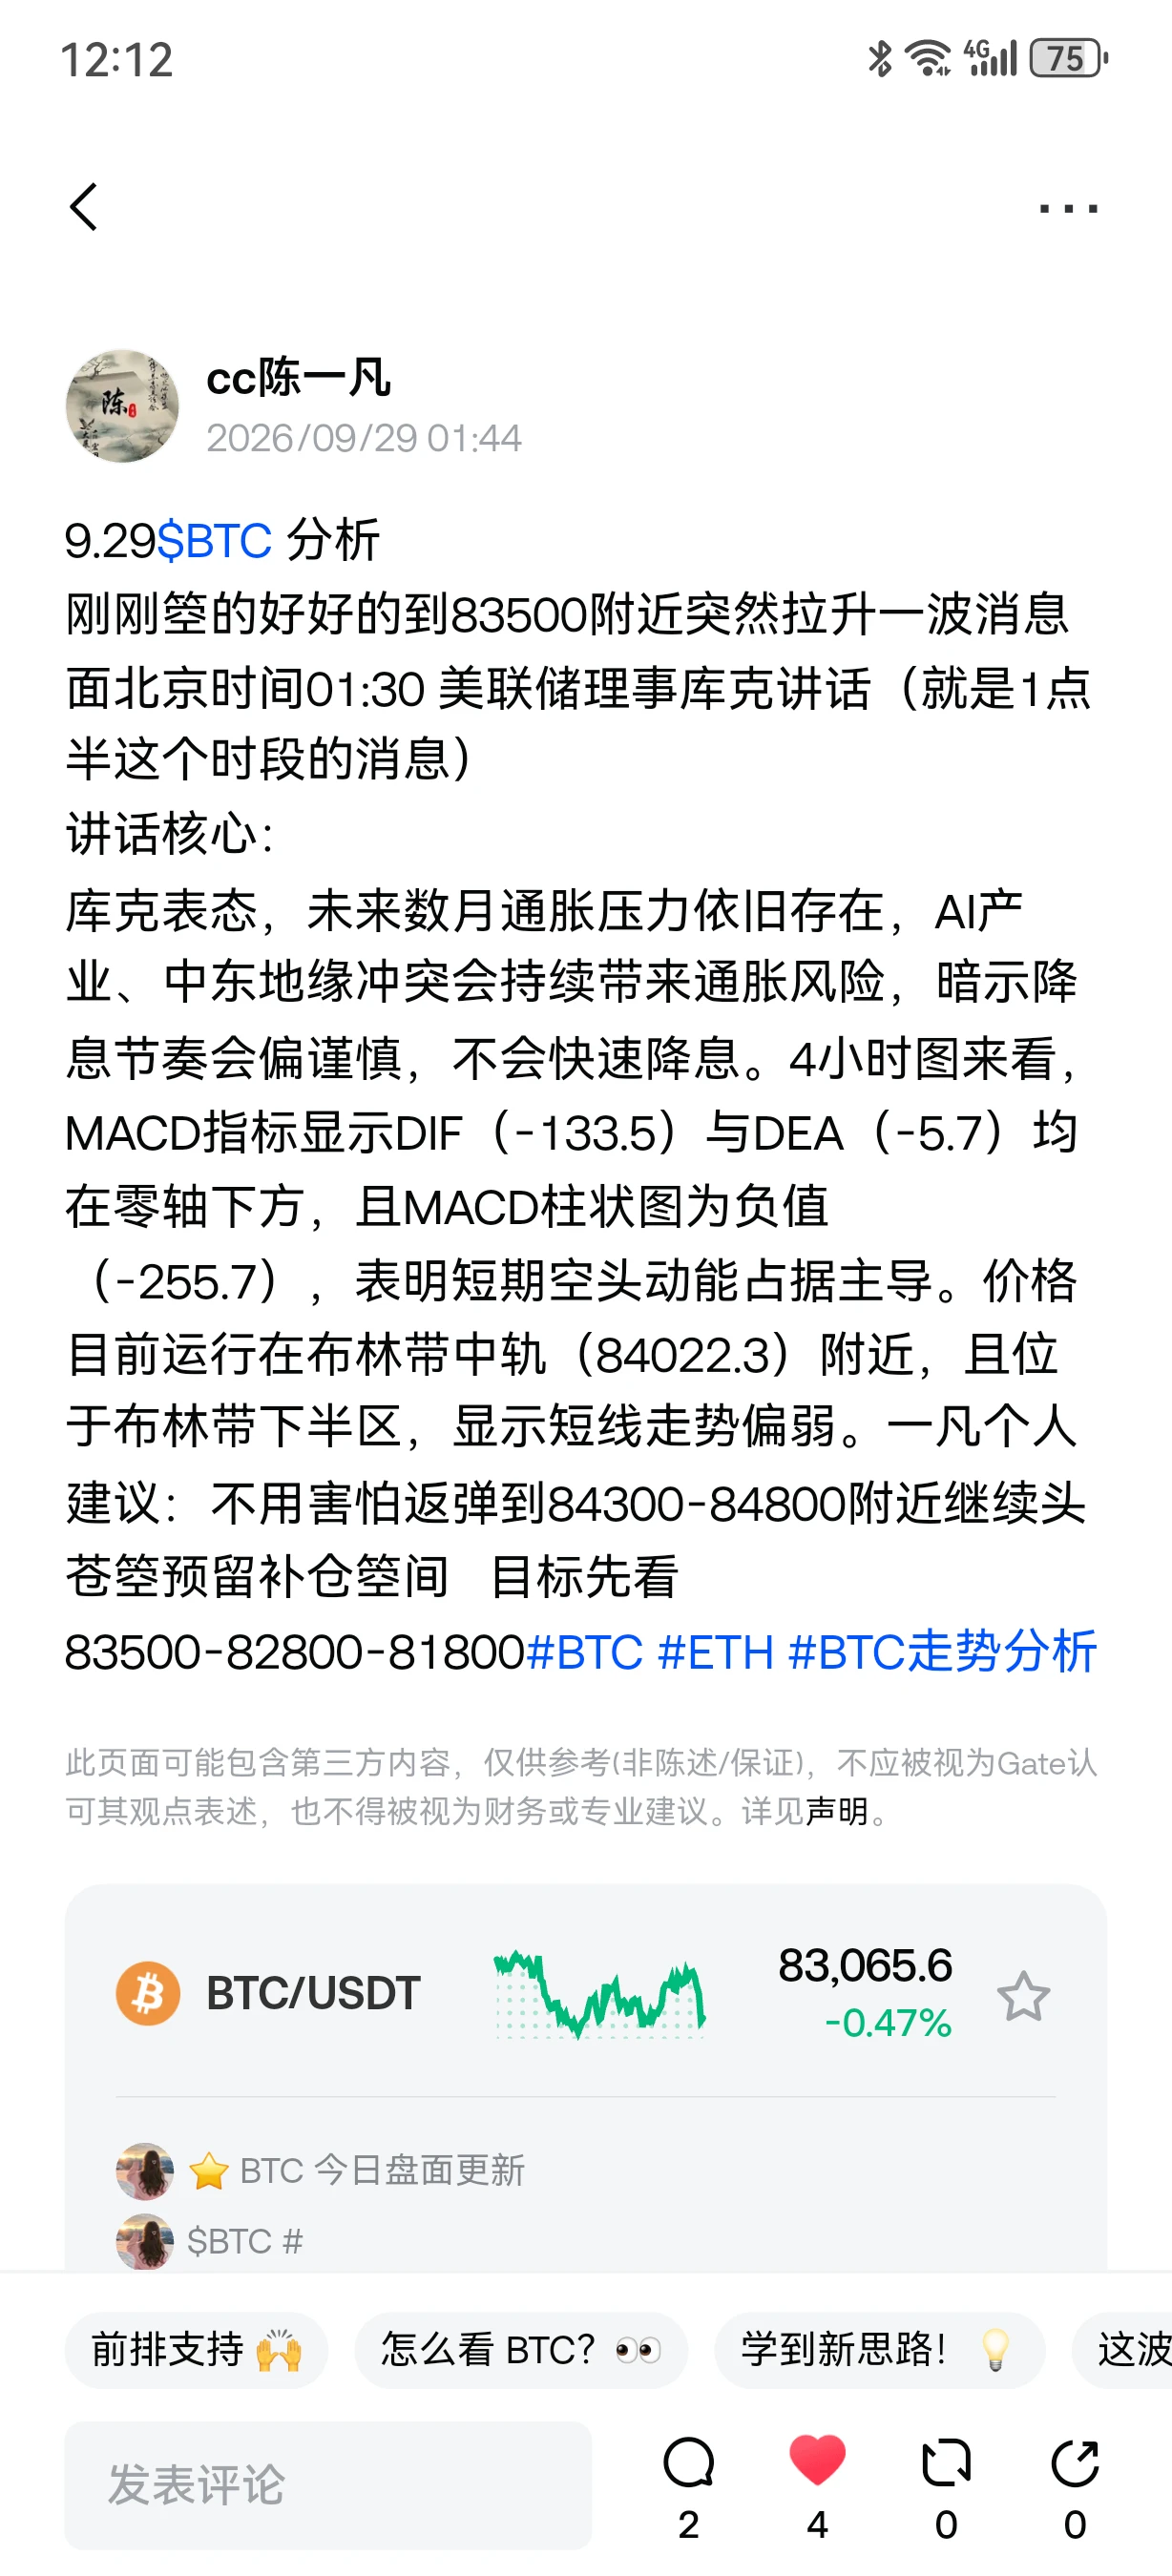
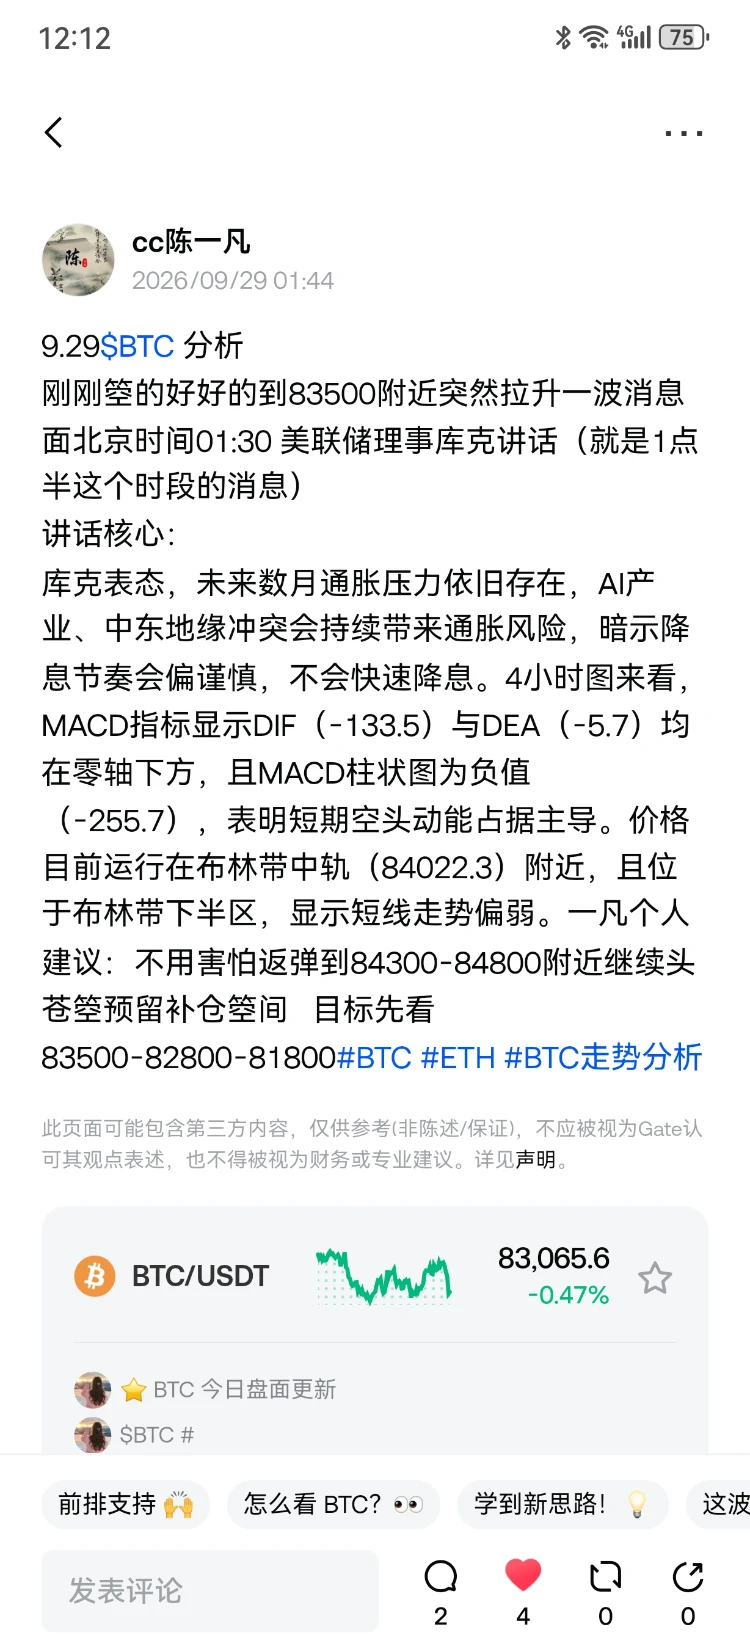
After shorting smoothly, the price suddenly surged near 83,500. News at 01:30 Beijing time: Federal Reserve Governor Cook spoke (the news during this 01:30 time slot).
Key points:
Cook stated that inflationary pressures will persist over the coming months, while the AI industry and geopolitical conflicts in the Middle East will continue to create inflation risks, implying that the pace of rate cuts will be cautious rather than rapid. On the 4-hour chart, the MACD indicator shows that both DIF (-133.5) and DEA (-5.7) are below the zero axis, while the MACD histogram is negativ
BTC+1.20%
  • 2
Three new friends, welcome! The one who came on Tuesday tried it for a few days, felt it was a great fit, and brought friends along too. Thank you for this support and trust—I, Yifan, definitely won’t let you down. With fire in our hearts and light in our eyes, we’ll walk together, and the road will only grow wider. Wow, let’s keep charging forward! #BTC #ETH #BTC走势分析
BTC+1.20%
ETH+0.95%
  • 2
A smooth start and a victorious first battle. Execution says it all: don’t wait and see, don’t procrastinate, act according to plan, keep pace, and the results will speak for themselves. A motivational reminder: Thinking only creates problems; taking action is the answer. Wherever there is action, there are gains. A narrow mindset can lead to losing big over small things; reserve your time and energy for those who truly care. #GateBTC现货交易量跻身前三 #BTC短线回调 #山寨币大幅回落
BTC+1.20%
  • 6
Guys, sorry, but I profited again this time. I went long in the early hours, took profits just now, and immediately opened a short; I’ve already laid out the analysis clearly for everyone, but whether you can catch the move is up to you. The market never lacks opportunities; what it lacks is the insight to recognize them and the courage to act decisively. When an opportunity comes, you don’t dare take it, and when the market moves, you regret it—no matter how good the analysis is, it can only become someone else’s profit. Every penny you earn is the realization of your understanding; every tim
post-image
BTC+1.23%
ETH+0.95%
  • 7
A big bullish candle—first take some profit on the long positions I gave everyone at dawn and bank it. From here, seize the opportunities; let’s keep pushing!#BTC #ETH #BTC走势分析
BTC+1.20%
ETH+0.95%
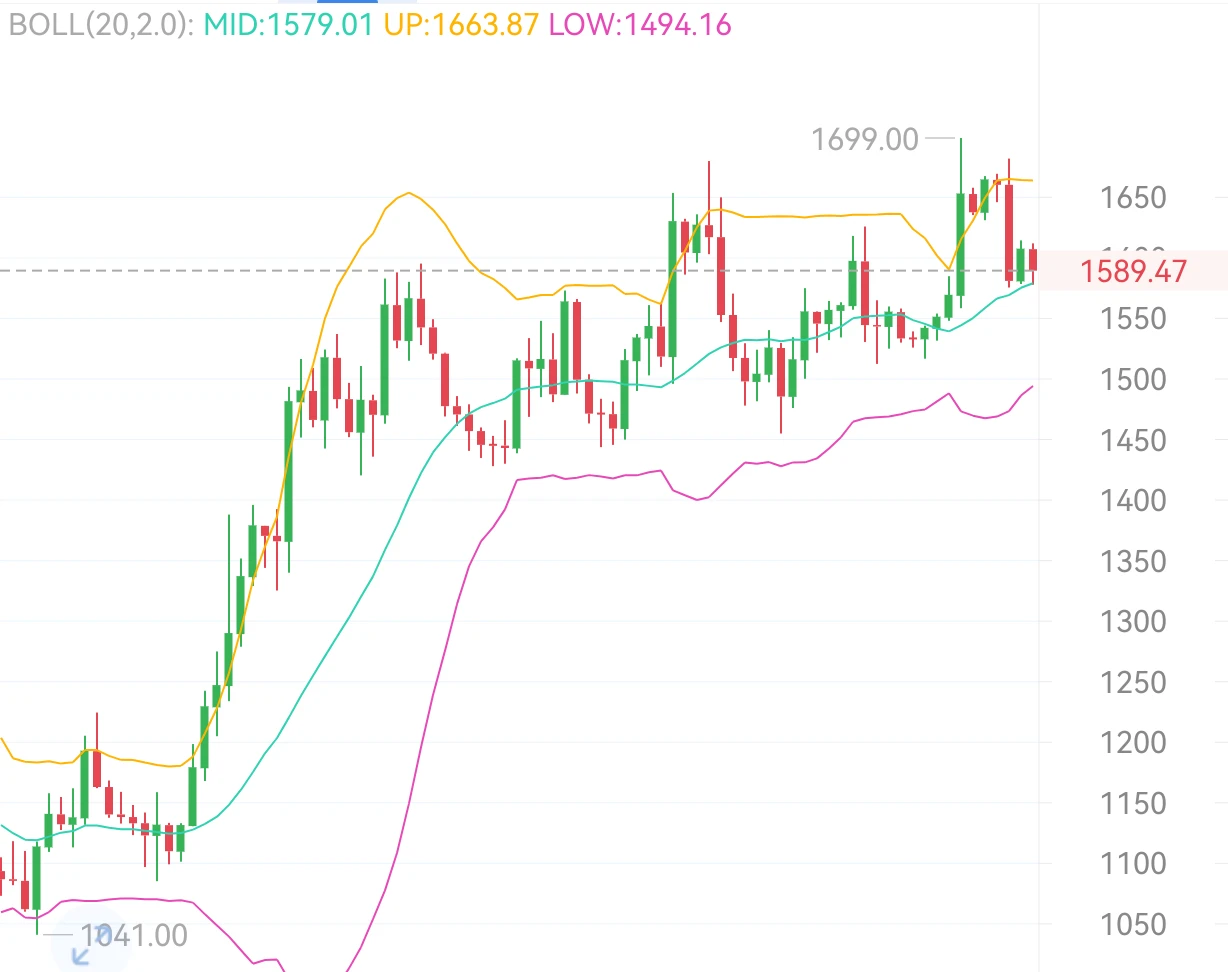
September 28 $ZEC Morning Analysis
ZEC is currently quoted at 1591.46. On the 4-hour chart, the overall uptrend remains intact. After rising to a high of 1699, it underwent a pullback and consolidation. On the news front, major players have placed tens-of-millions-of-dollars-level support buy orders, indicating defensive buying; short-term net outflows are merely profit-taking after the rise, while trend funds have not exited.
Technically, the price has retraced to around the Bollinger middle band at 1579.10, while the Bollinger Bands continue to open upward. The MACD lines are above the zero
post-image
ZEC-6.10%
BTC+1.20%
ETH+0.95%
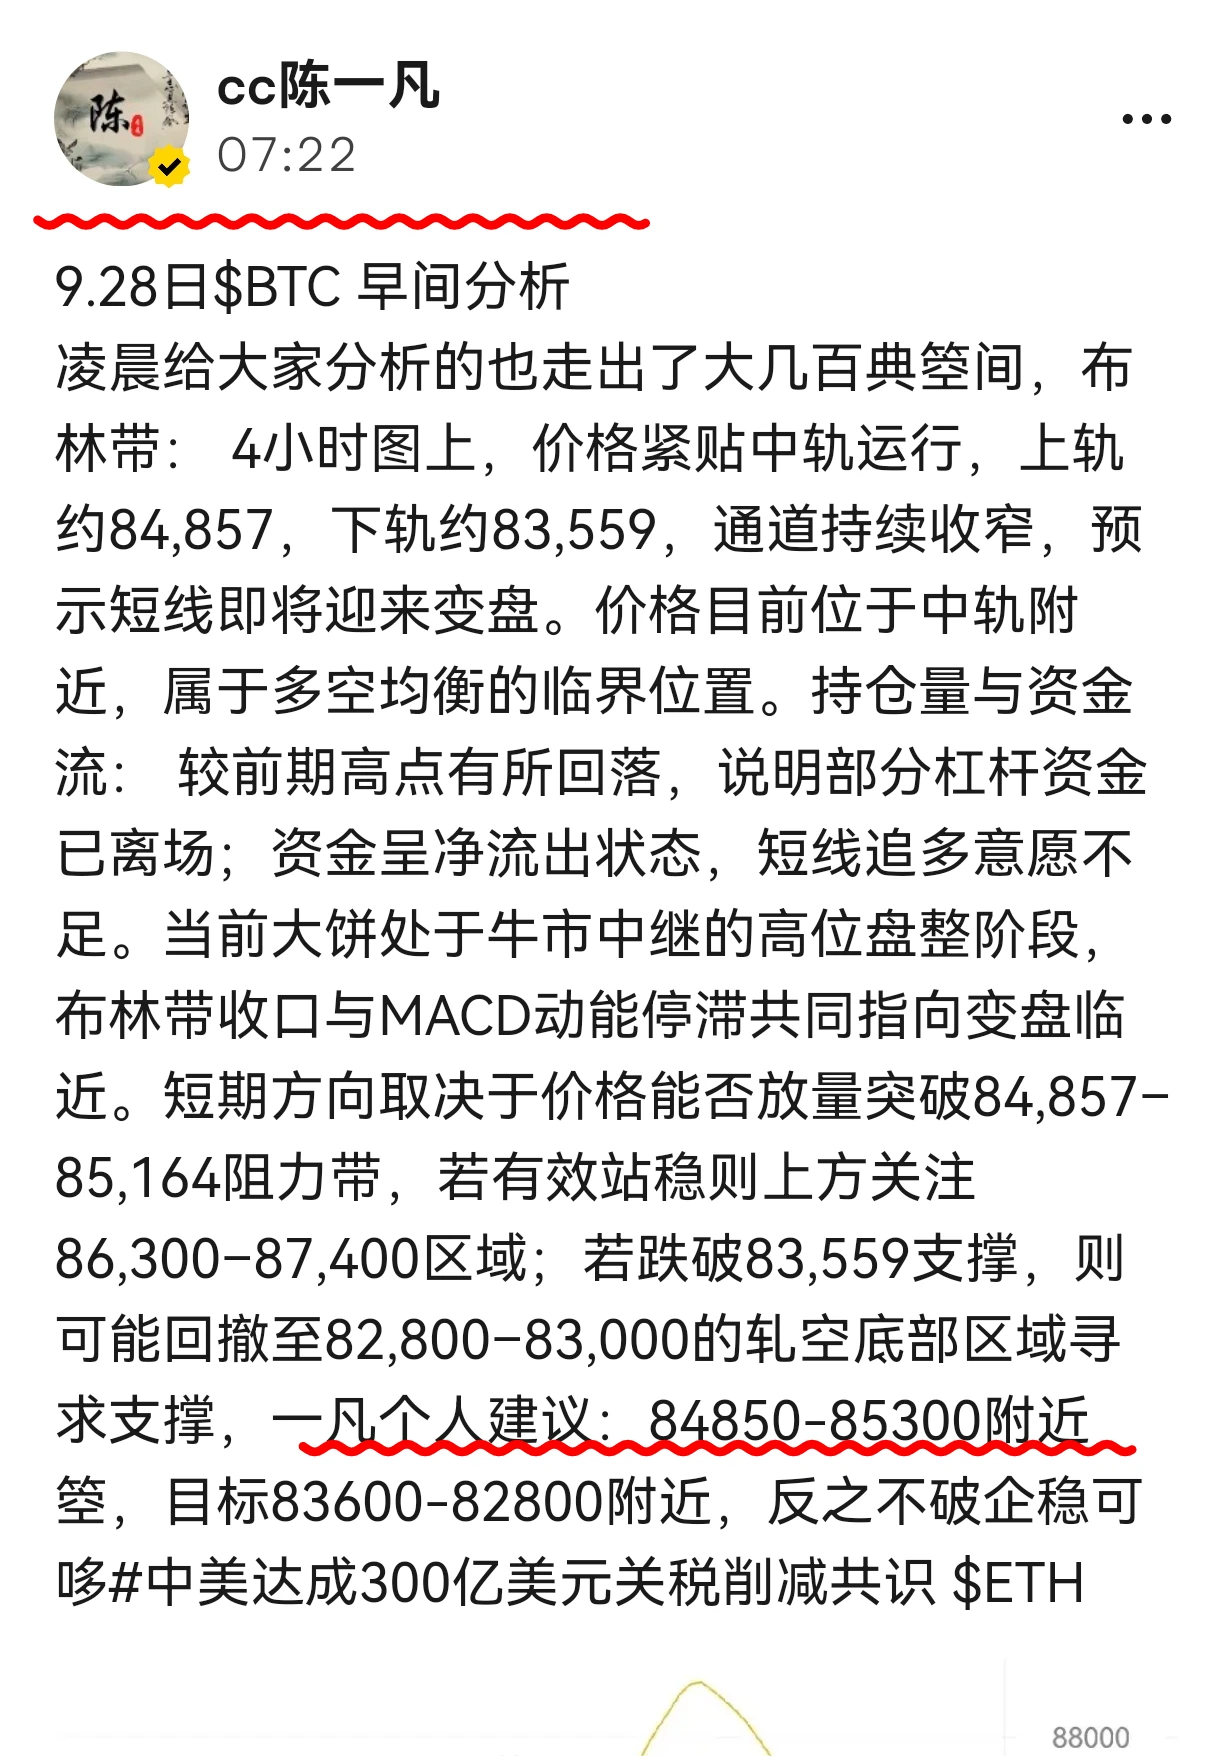
September 28 $BTC Morning Analysis
The setup analyzed for everyone in the early hours also played out with several hundred points of room. Bollinger Bands: On the 4-hour chart, the price is moving close to the middle band, with the upper band around 84,857 and the lower band around 83,559. The channel continues to narrow, signaling that a short-term market shift is approaching. The price is currently near the middle band, a critical point of balance between bulls and bears. Open interest and capital flows: They have declined from previous highs, indicating that some leveraged funds have exite
BTC+1.23%
9.28 $ETH Early Morning Analysis
After bottoming and stabilizing on the 4-hour chart, ETH has entered a period of range-bound recovery. On the news front, Ethereum’s staking scale remains stable, with expectations for the ecosystem’s fundamentals supporting prices. The slight short-term capital outflows are merely profit-taking after the surge, rather than an exit by major players.
Technically, the price is moving closely along the Bollinger middle band, while the bands are narrowing and building momentum. The MACD lines are nearing a bullish crossover, and bearish momentum continues to weaken
post-image
ETH+0.95%
BTC+1.20%