Square
Following
Hot
News
Notifications
Profile
Share your thoughts
placeholder
Article
Laying out the November candlesticks, the entry price for this move, $CYBER , was exactly the high on November 12.

Here’s how that stretch played out: On November 5, the exchange resumed withdrawals, and it rose 51% in a single day. On the 6th, it surged again, reaching around 0.40 intraday, then headed steadily downward. It fell 18.4% on the 7th, 9% on the 8th, and 11.6% on the 11th. On the 12th, it surged to 0.2637 but couldn’t hold. From the 13th to the 19th, it closed lower every day, grinding down from 0.24 to 0.20.

On the 20th, it hit an intraday low of 0.2001, a new all-time low. On t
post-image
CYBER-5.14%
BTC-0.65%
AKE+6.39%
  • 1
$PIPPIN 's moving averages are clearly defined: the 100-day MA is at 0.01872, and the 200-day MA is at 0.03959. The close on the 21st was around 0.017, failing to get above even the 100-day MA.

The resistance levels above are 0.0187 at the 100-day MA, around 0.0202 near the previous high, then 0.0234 further up, with 0.0543 much farther away. Below, 0.0148 is where the move kicked off on the 18th, and below that is the all-time low of 0.011.

One analysis put it plainly: to break above 0.0202, spot buying needs to come in first; derivatives alone won't get it there.

The project itself can't
post-image
PIPPIN-2.21%
ETH-1.23%
  • 1
Trenches
IDOL
I
bade
b
IDOL
0x3b...ab07
Market Cap
$.
Change
.
24h Vol
$.
Holders
.
PIEVERSE
P
bade
b
PIEVERSE
0x0e...25a9
Market Cap
$.
Change
.
24h Vol
$.
Holders
.
FIONA
F
bade
b
FIONA
B34n...pump
Market Cap
$.
Change
.
24h Vol
$.
Holders
.
Singularity
S
bade
b
Singularity
7R4M...pump
Market Cap
$.
Change
.
24h Vol
$.
Holders
.
CLAUDIA
C
bade
b
CLAUDIA
2j5S...W2ZM
Market Cap
$.
Change
.
24h Vol
$.
Holders
.
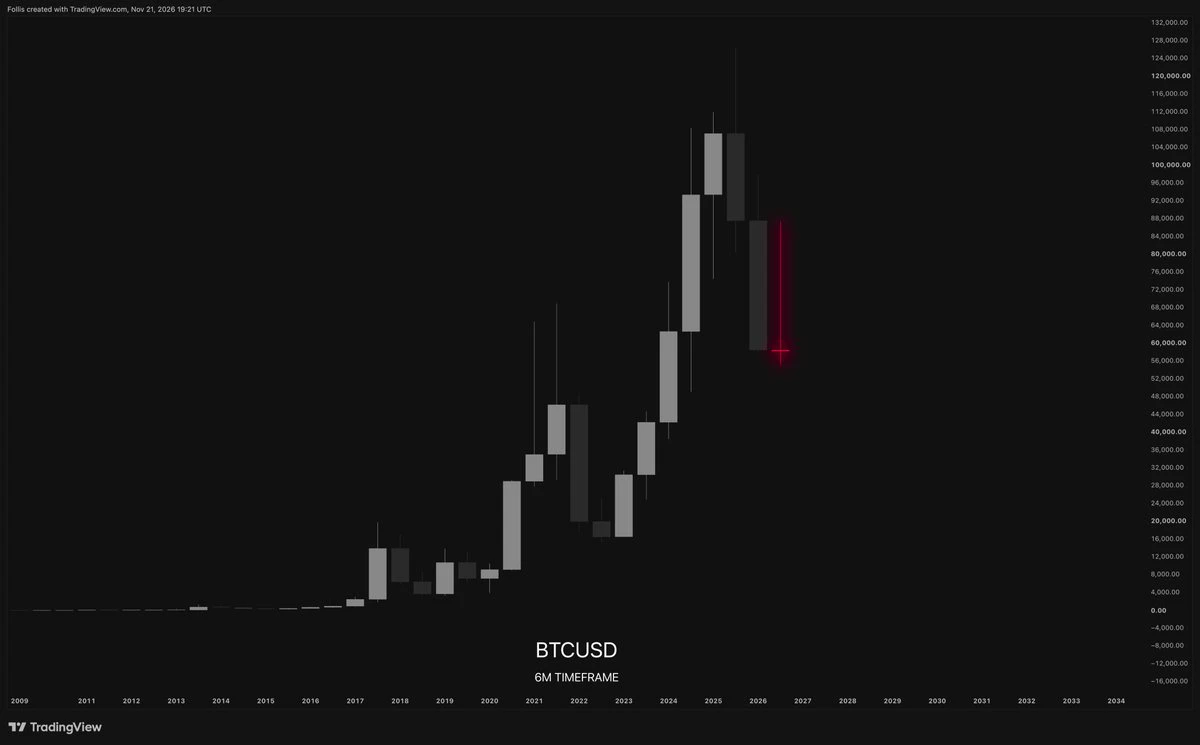
6M candle got me feeling a certain type of way
$BTC
post-image
BTC-0.67%
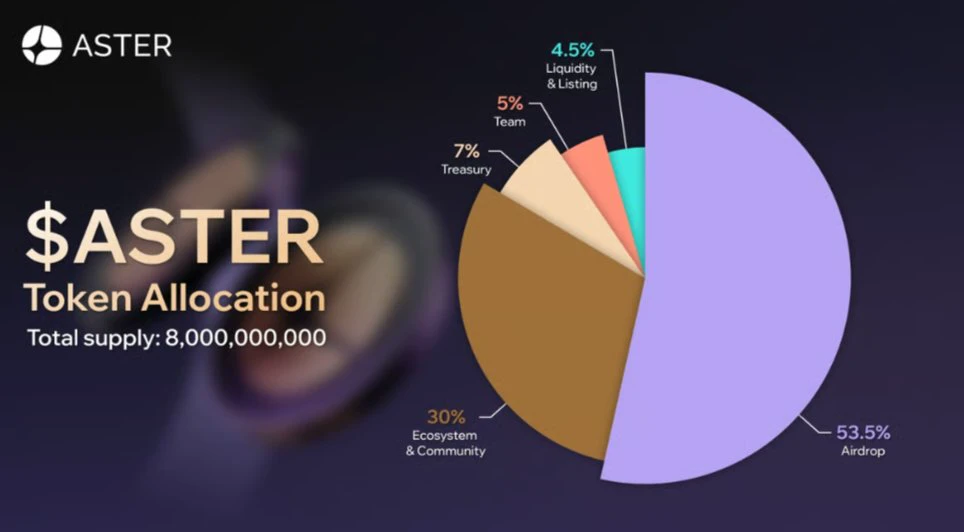
This is really legit $ASTER hurry and sign up for free
#airdrop
post-image
ASTER-0.07%
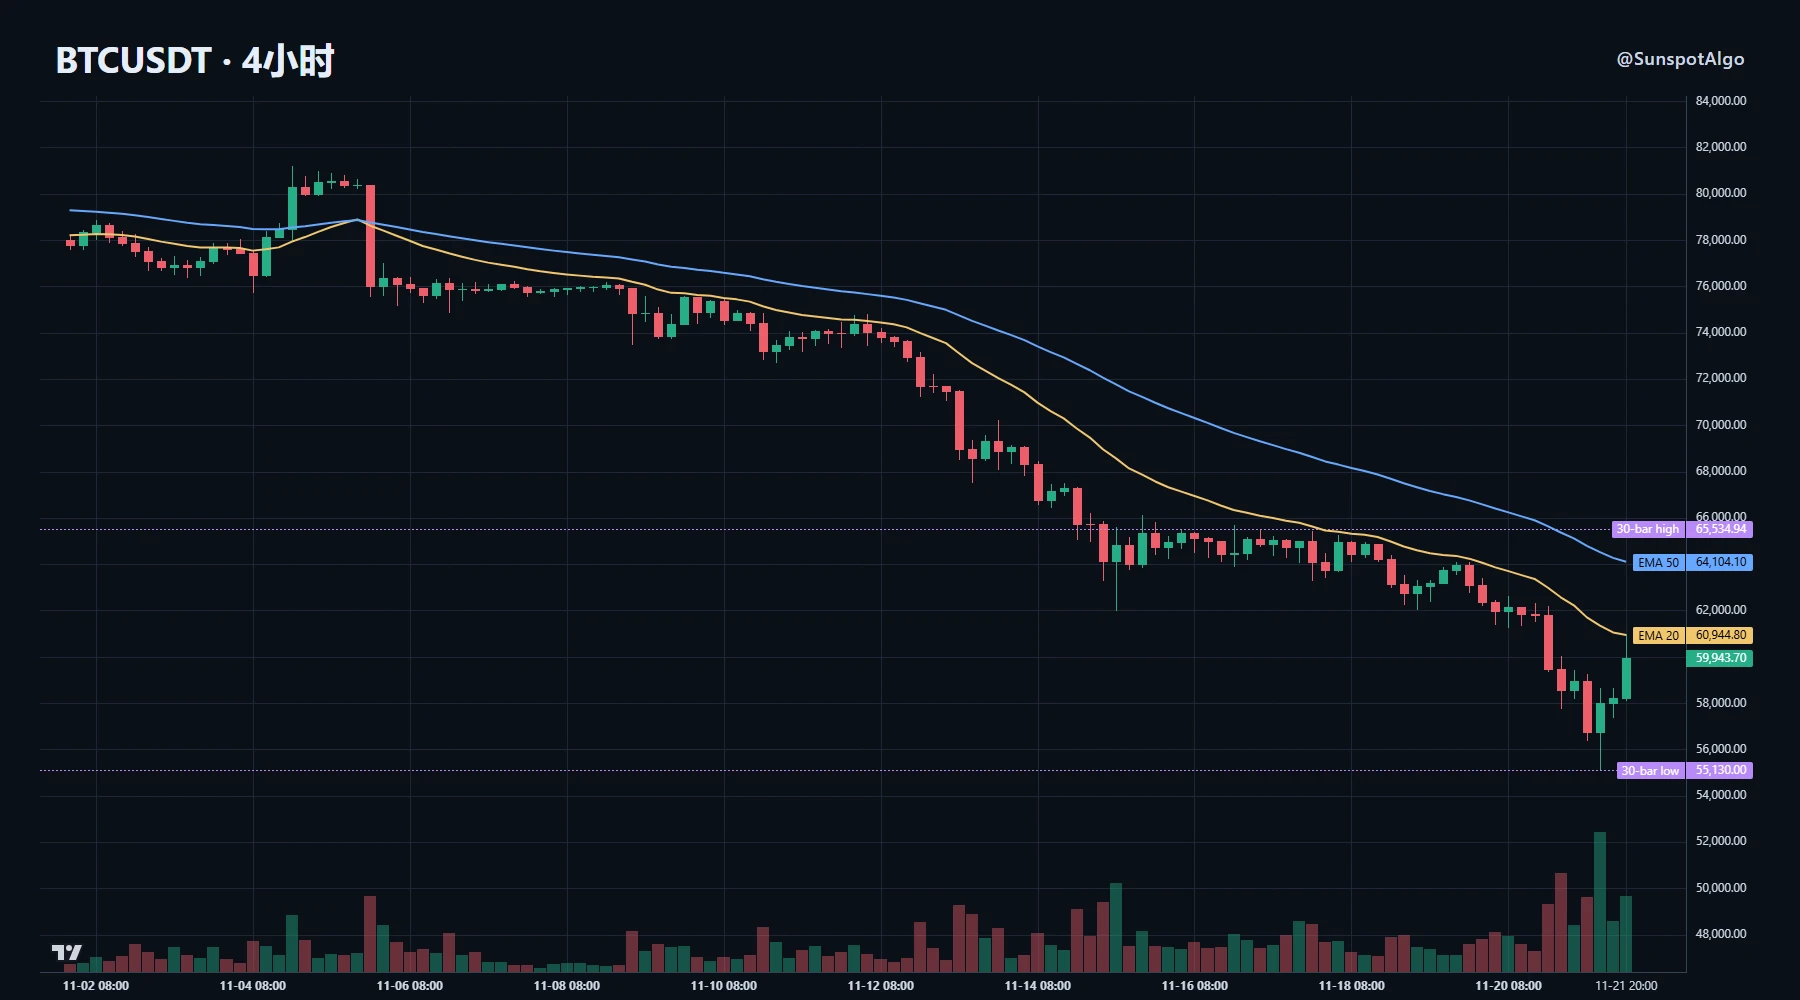
The past two days have been a classic chart trap: the daily chart is still in a bearish alignment, and the 4H chart keeps printing long wicks, making it look like a bottom.

First, the rhythm. After falling nearly 9.8% in 5 days, the price reached the 4.4th percentile of its 30-day range. The daily chart is capped by 69,500 and 74,500. The 4H candle closed at 59,900, with the short-term moving average at 60,900 overhead.

Open interest makes the rhythm clear. Open interest fell 4.3% over 24 hours, while the price staged a slight recovery; the funding rate was -0.0009%, near zero. Price up, ope
post-image
NAS100-4.60%
SPX+0.33%
VOLX+0.40%
XAUUSD-2.40%
$EVAA Do the names of these two coins imply they’ll rise to $600? 😃
post-image
EVAA-0.49%
I use these indicators
- RSI.
- 12/26 or 25 EMA
- OBV
post-image
[NEW streamer BTC]
live-cover
LIVE70
BTC-0.67%
ETH-1.26%
SOL-0.77%
$ICP One market detail is worth watching: the price hasn’t recovered, but contract positions have already climbed back.
At 9 p.m. on the 20th, Internet Computer was still at 2.061, with about 261.8 million contracts. When it plunged to a low of 1.865 at 2 p.m. on the 21st, contracts first fell to about 253.9 million. By 2 a.m. on the 22nd, it had closed at 1.919. The price hadn’t recovered at all, yet contracts had piled back up to about 263.1 million—well above the low and even slightly above the level from the evening of the 20th.
Contracts falling and then rising around the low only shows
post-image
ICP-1.14%
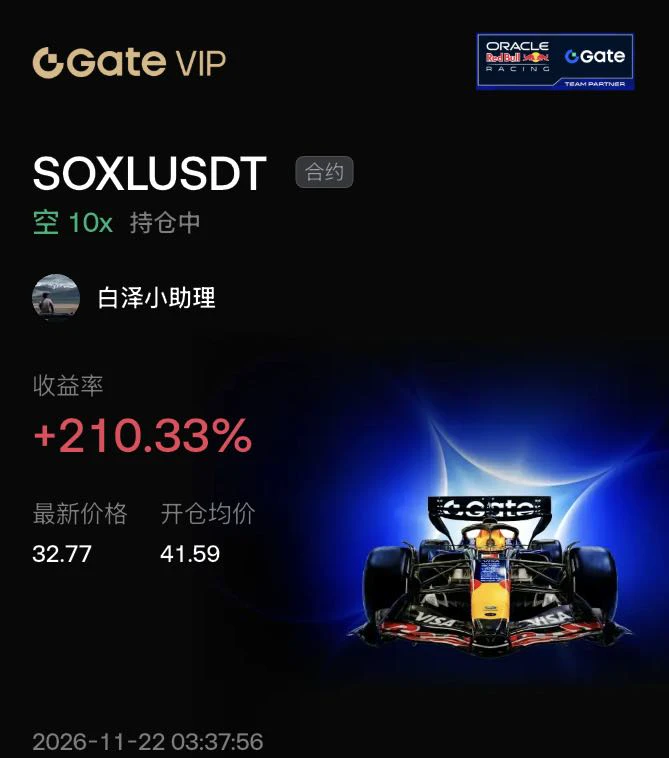
Have you checked $SOXL overhead supply?

In-depth analysis: Dense supply below 41.59 loosened, and after the neckline broke, buying collapsed, driving the price down to 32.77. I made 210% by trading the breakdown in supply. Fail to hold below the peak and it’s a guaranteed wipeout. Do you watch the lower edge of the vacuum when you trade? $ETH #BTC跌破6万美元关口 $BTC
post-image
SOXL-1.16%
ETH-1.23%
BTC-0.65%
  • 1
Whales Mves in Sync!
live-cover
LIVE23
BTC-0.67%
ETH-1.26%
ZEC+1.16%
SOL-0.77%
USDC+0.01%
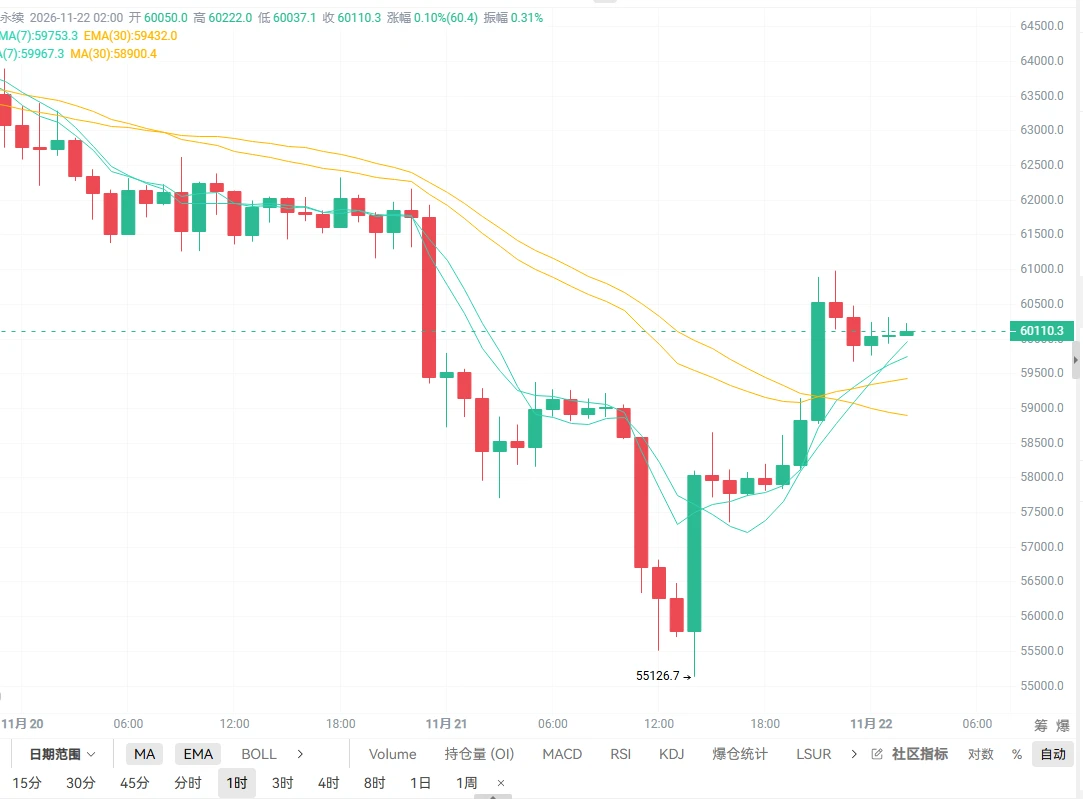
Yang Guang bit | Nov 22 $BTC Rebound nears mid-term resistance; short with the trend under pressure
【Today's Outlook】
Entry timing: Price rebounds to the 60900–61900 range
Stop loss: 62600
Take-profit targets:
First target: 59500–59000
Second target: 58000–57000
【Key Takeaway】
The fading geopolitical premium is the main factor supporting this oversold rebound, but the agreement has not been finalized, so setbacks remain possible. The impact of the U.S. stock market's Black Friday (11/20) crash is still being felt: the Nasdaq fell -5.28%, the S&P 500 -3.70%, and the Dow -1.93%. Markets suffered
post-image
BTC-0.65%
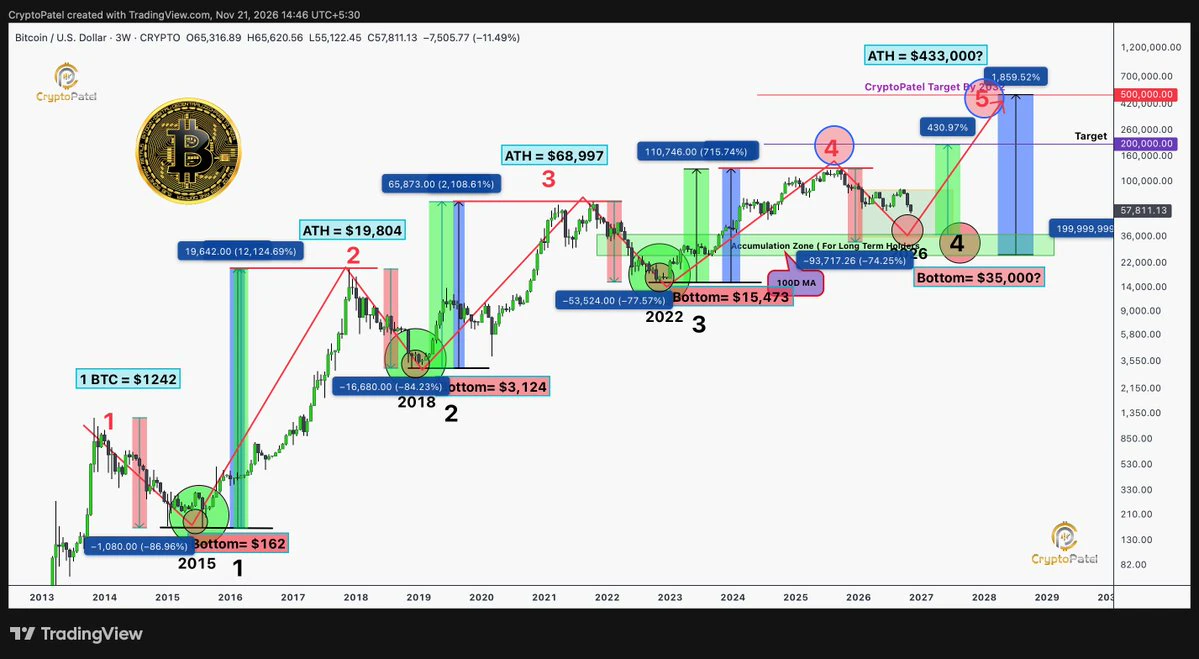
BITCOIN 2026–2029 CYCLE PREDICTION: NEXT BOTTOM & ATH TARGETS
After analyzing $BTC historical cycles and diminishing returns, here's my 2026–2029 projection:
➡️ Next bottom: $25K–$37K
➡️ Bottom window: Q4 2026–Q1 2027
➡️ 2029 ATH Target: $160K–$200K
➡️ Base case: $170K
TIME and PRICE models are giving different signals.
I'm preparing for the next accumulation phase, not trying to catch the exact bottom.
Think in cycles, not candles.
NFA.
post-image
BTC-0.67%
  • 1
Day two of copy trading—how’s the performance looking, guys? 🥳
Cat tax.
Continue scrolling.
post-image
Let’s go, GPU miners—keep giving it your all!
post-image
I haven't even had my coffee yet, and the timeline says Bitcoin is plunging hard $BTC
1. Bitcoin will have spent 11 months above $60,000
2. Ethereum will have spent 11 months above $1,500
3. And some coins are still far from their 2026 low
.. the lows haven't changed ..
And some coins have made a new low, 10% below the previous one
They still haven't had a sharp drop so far
post-image
BTC-0.67%
Don't rush to turn bearish; make sure you have enough ammunition
A falling market isn't necessarily all bad. For those who haven't built positions yet, this crash is essentially a repricing. If U.S. stocks and crypto markets really get brutal enough to wash out 95% of retail investors, quality tech stocks and major crypto assets will still be dragged down by panic and battered into a hole.
So don't rush to call a crash right now, and don't rush to catch a falling knife either. Save cash, work hard to make money, treat cash flow as ammunition, and prepare your watchlist in advance. The key leve
post-image
NAS100-4.60%
SPYX+0.01%
BTC-0.67%
$NVDA This stretch of the move was “leaking” down, not “getting dumped”: it opened a notch lower and closed another notch lower, with not a single bearish candle worth screenshotting for over ten hours. A dump comes with emotion and rebounds; a leak has no emotion and just inches down one tick at a time. Three rebounds, each lower than the last; the second was only half the first. The layer of sell orders overhead went from a wall to a sheet of paper. The bands are tightening. But for individual stock tokens, tightening is an after-hours effect, not structure—so the only real evidence is that
NVDA-13.84%
  • 1
Load More

Join 40 M users in our growing community

⚡️ Join 40 M users in the crypto craze discussion

💬 Engage with your favorite top creators

👍 See what interests you

Trending Topics

BTCBreaksBelow60K

2.1M Views29.9K Discussing

BTC fell below $60,000 on November 20 for the first time since July, alongside a tech stock selloff and broader pressure on risk assets. Will $60K become resistance, or can BTC quickly reclaim it? What price or volume signals would convince you that selling pressure is easing?

GateDirectIPOPhase3ANTAllocates92100Shares

786K Views4.9K Discussing

NvidiaDropsNearly14Percent

329.2K Views7.6K Discussing

View More