Square
Following
Hot
News
Notifications
Profile
Share your thoughts
placeholder
Article
#PCEAndGDPDataNextWeek: How Will Macroeconomic Data Affect Gold and Cryptocurrencies

Important macroeconomic data due next week are likely to determine the next moves across major markets. The US will release October personal income and outlays data, as well as the second estimate of third-quarter GDP, on November 25 at 13:30 (UTC). These inflation and economic growth figures are crucial to understanding the interest rate outlook, especially after the recent sell-off.

On the XAUT/USDT daily chart, gold is currently trading near 3,531. Technical indicators show a clear downtrend. The price is
NVDAG-0.24%
XAUT+0.30%
BTC-0.67%
market update
live-cover
LIVE2,012
BTC-0.67%
SOL-0.77%
XRP-1.15%
USDC+0.01%
ETH-1.26%
Trenches
IDOL
I
bade
b
IDOL
0x3b...ab07
Market Cap
$.
Change
.
24h Vol
$.
Holders
.
JAGENT
J
bade
b
JAGENT
0x8e...ae15
Market Cap
$.
Change
.
24h Vol
$.
Holders
.
PIEVERSE
P
bade
b
PIEVERSE
0x0e...25a9
Market Cap
$.
Change
.
24h Vol
$.
Holders
.
CLAUDIA
C
bade
b
CLAUDIA
2j5S...W2ZM
Market Cap
$.
Change
.
24h Vol
$.
Holders
.
mihao
m
bade
b
mihao
4Cxj...pump
Market Cap
$.
Change
.
24h Vol
$.
Holders
.
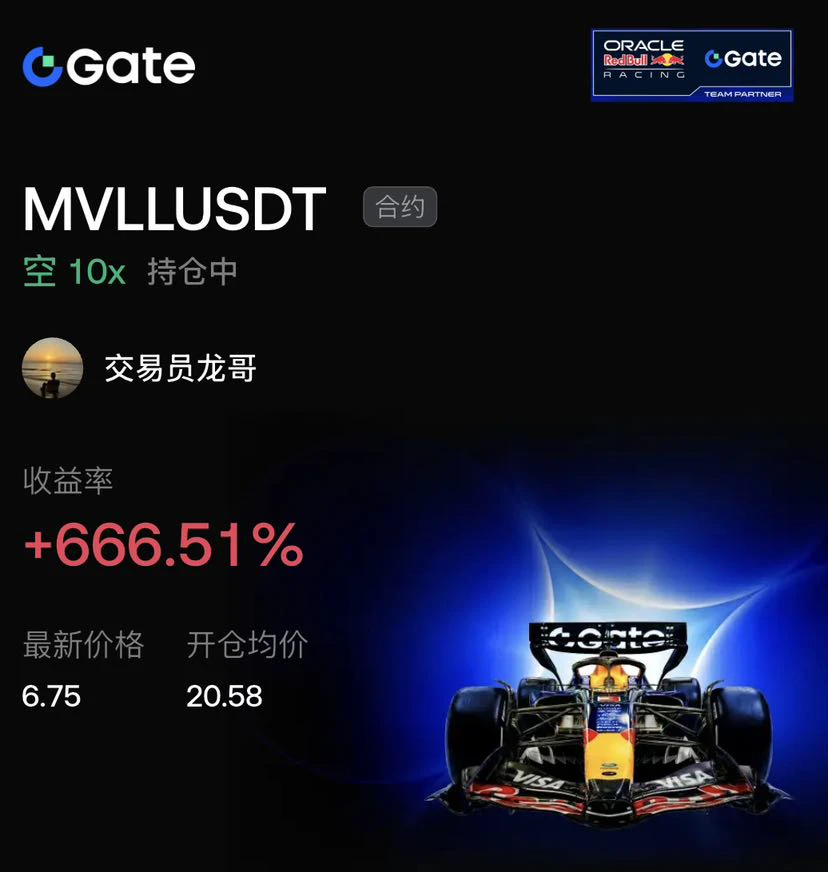
When everyone was buying the dip around 20.58$MVLL , I chose to reverse and go short.

The daily-chart double top was already crystal clear, with every rebound accompanied by declining volume and the moving averages fully aligned bearishly. In this environment, so-called “support levels” looked more like bull traps. Following the trend is far safer than trying to guess tops and bottoms.

Holding the position was no easy ride. From 20.58 to 6.75, there were several high-volume rebounds along the way, and watching unrealized profits pull back under 10x leverage was a real test of discipline. For
post-image
MVLL-1.56%
BTC-0.65%
ETH-1.23%
One candlestick swallowed the previous six, and $AKE plunged straight from 0.0059 to 0.0025, with 156 million in 24-hour trading volume. The structural support that held yesterday didn’t even get a bounce today.
This move has little to do with the market itself. Large on-chain transfers have become noticeably more frequent lately, with several concentrated outflows occurring during the U.S. session, right in the hours when USD liquidity is tightest. The transmission path isn’t complicated: short-term rates remain stubbornly high on the macro front, so market makers are forced to cut their mark
AKE+6.07%
  • 1
  • 1
Now this is the real JDM vibe...
Too bad that in a few more years, nobody will remember what JDM even is. Once in a while, some old geezer will bring it up, and the young punks will just say, “What kind of junk is that? It can’t even outrun a Qin😂”
  • 1
  • 1
He didn’t disappoint—he still managed to roast me right on target. Keep it coming
post-image
  • 2
  • 2
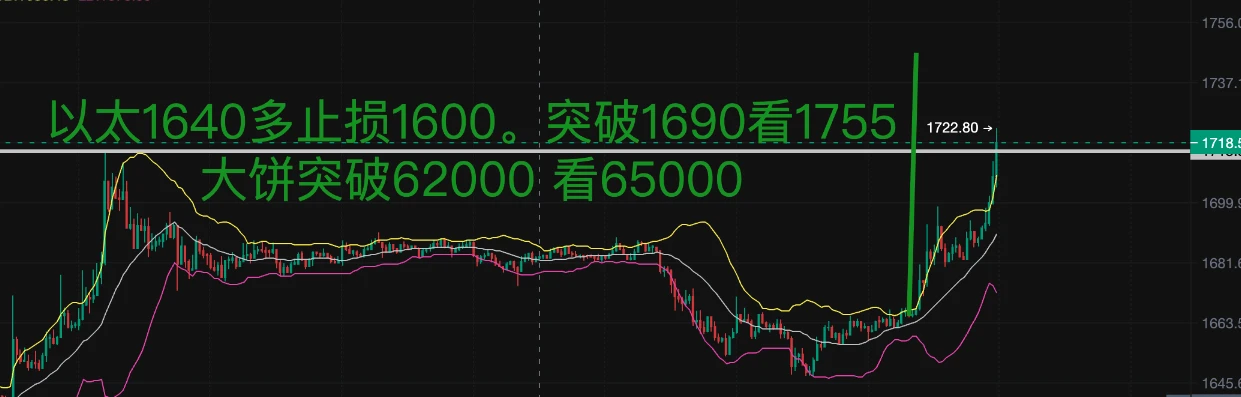
Is ETH going up or down? Someone in the know, help me take off
post-image
ETH-1.26%
  • 2
🔹 BNB Surpasses 540 USDT with a Narrowed 4.43 Decrease in 24 Hours
live-cover
LIVE3,146
BTC-0.67%
ETH-1.26%
ZEC+1.16%
SOL-0.77%
USDC+0.01%
$ETH From 1,550.45 to 1,712.00, the underlying moved 10.42%. At 200x, the theoretical gain should be +2083%, but the card says +1812%.

Not a single point of that gap was taken by the market; it was collected along the way: funding fees are charged on notional, and at 200x, the notional is 200 times the margin, so one funding period’s rent equals someone else’s twenty; opening eats one tier, and closing eats another; the gap between the mark price and the latest price opens wide during a sharp rally.

At low leverage, these three things are rounding errors. At 200x, they add up to 270 points.
ETH-1.23%
BTC-0.65%
SNDK-0.18%
  • 3
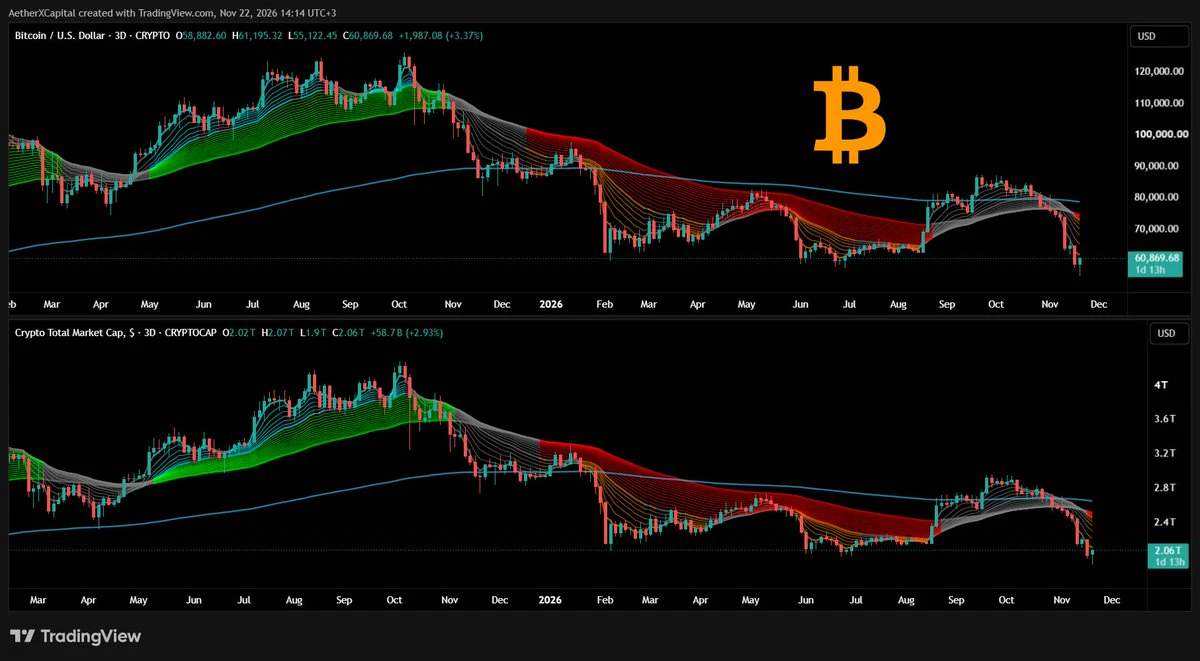
The SuperGuppy indicator has turned bearish on $BTC and TOTAL on the 3-day time frame.
It's one of those indicators that can't be ignored even if it points out something you don't want.
post-image
BTC-0.67%
2026-11-22 18:00
$BTC 61,082.70 (+3.28%)
4H range · 15m RSI 91 · Wait; RSI extremely overbought and flattening, don't chase
$ETH 1,715.99 (+3.03%)
4H range · 15m RSI 92 · Wait; RSI extremely overbought and flattening, don't chase
$SKHYNIX 781.65 (+2.11%)
4H bearish · 15m RSI 86 · Strong short; 4H bearish + 15m overbought rebound. Reference 781.49 for short
META 575.17 (+0.71%)
4H bearish · 15m RSI 85 · Strong short; 4H bearish + 15m overbought rebound. Reference 574.93 for short
#BTC #ETH #SKHYNIX
⚠ For reference only, not investment advice$ETH ‌
post-image
ETH-1.23%
President Tinubu has approved the distribution of over three million bags of subsidised fertiliser to farmers across the country ahead of the dry season, supporting agricultural activities and efforts to increase food production.
#ArewaForAsiwaju
In Mława County, 759 people have been laid off, 460 of them from LG Electronics alone—nearly 60% of the cuts this time around. Let’s put that number out there first, but don’t rush to post “the tech industry is finished.” It’s certainly a striking figure, especially for one county. The bus stop outside the factory, the cafeteria, nearby rental housing, and logistics will all feel the chill. But a striking figure isn’t a verdict on the entire industry.

First, question the source: this comes from the local labor office, not national statistics. A wave of layoffs in one county can show that part
post-image
LG-1.67%
  • 1
  • 1
$SOL 65.17 to 70.82, the first level, 66.63 (today’s low), is already underfoot; the second, 68.74, has become the floor, and the third is the current level.

Above, in order: 71.08 (today’s high) → 72.78 (former support turned resistance) → 75.3 (liquidation level for $6.3 million in shorts) → 75.85 (50-period) → the dense wall at 76–77 → 91.97 (200-period, the cost basis of those who bought in January 2025).

Below: 68.74 → 66.63 → 64.87 (the wick low = my liquidation line) → 58.95 (the lower weekly Bollinger Band).

The ETF column offers no reassurance: the $11.6 million inflow on 11/17 end
SOL-0.74%
BTC-0.65%
ETH-1.23%
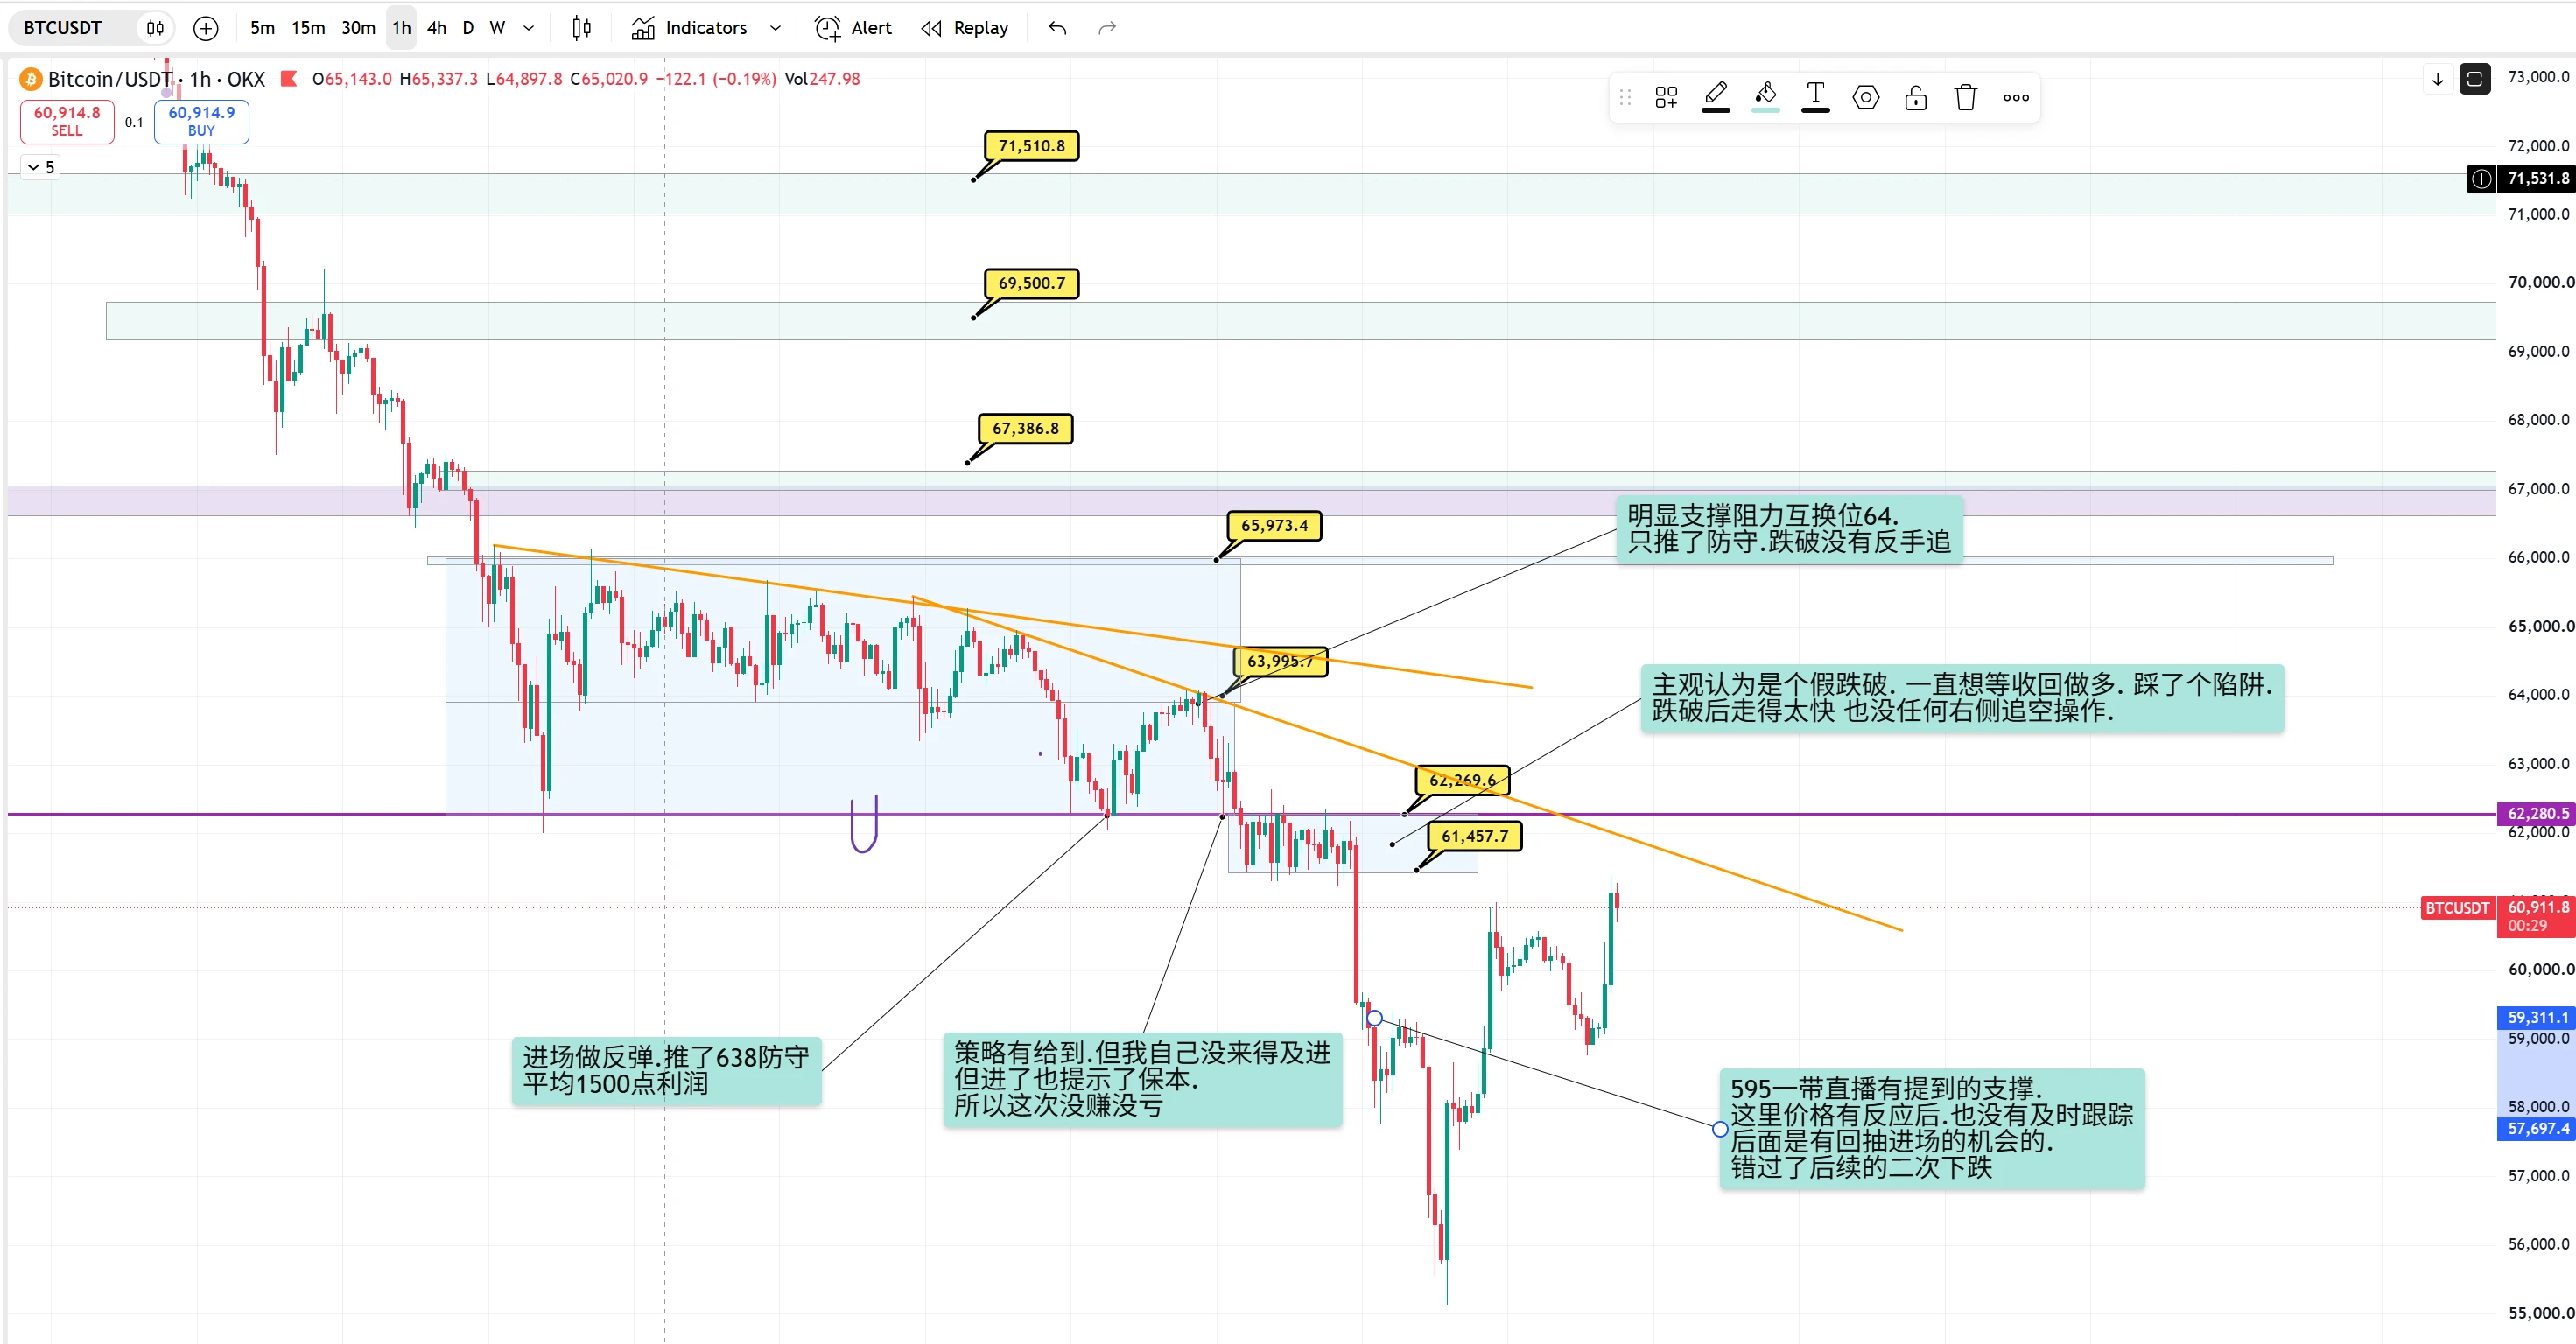
Although I didn't lose money during this downtrend, I really did miss out.
Looking back, I was still too subjective and stuck in habitual thinking.

As for my current outlook, objectively speaking, in the short term I'll wait to see how price reacts around the trendline at 62. Unless 66 is reclaimed on the 4-hour timeframe, the structure remains bearish.
Also, weekend trading tends to involve less participation from major players, so price hasn't reached my target. I'll stay out of the market for now~$BTC #BTC反弹后再争6万美元关口
post-image
BTC-0.65%
  • 2
330U Copy Ao Ying Capital | Day 46 · Evening Report

Good evening, one last look at today's results before calling it a day.
These are copied positions, not Ao Ying himself—please use your judgment (^v^)
Starting capital: 330U; return: 211.15%; current capital: 626.80U. (400U has been withdrawn during this period)

Just a quick update today:

Currently holding one BTC long position.
This trade is finally in profit; Ao Ying hasn't exited yet, so let's see how it goes.

📊 Today's recap: capital 614.66U → 626.80U, floating PnL +12.14U

See you tomorrow! 🦅
post-image
BTC-0.65%
$BTC ETFs are still running, but not as hard as yesterday. BlackRock’s IBIT daily outflow narrowed to $125 million from $582 million the previous day, as selling pressure hit the brakes.

Previously, plenty of people saw headlines about “four consecutive weeks of outflows and $3.5 billion in monthly losses” and kept shorting around 56,000. But marginal outflows are slowing, and with gold and crude oil prices rising in after-hours trading, the foundation of the bearish thesis has weakened.

I didn’t wait for ETF flows to turn positive completely. I went long only after the price pulled back to
BTC-0.65%
ETH-1.23%
SNDK-0.18%
  • 1
$BTC 200x short, holding, 176%.
Bitcoin plunged to a low of 55,000 today, and the entire market was awash in red. The Fear Index has been stuck in extreme fear for several days, U.S. stocks are also falling, rate hike expectations are weighing on the market, and money is still flowing out of ETFs.
#BTC反弹后再争6万美元关口
BTC-0.65%
  • 2
  • 2
Another pleasant weekend is about to end. Just thinking about the market opening again tomorrow instantly takes away half the relaxation. Open this latest liquidation heatmap: before the market opens tomorrow, the big players’ playbook is already laid out in plain sight. Don’t charge in foolishly!

$BTC The current price is 59750, stuck awkwardly in the middle. Looking up, the green glow around 61000 is glaring—short positions are lined up there. But look further down: between 58500 and 59000, long positions are piled up as thick as a fortress wall. What does that mean? The big players have pl
BTC-0.65%
ETH-1.23%
SOL-0.74%
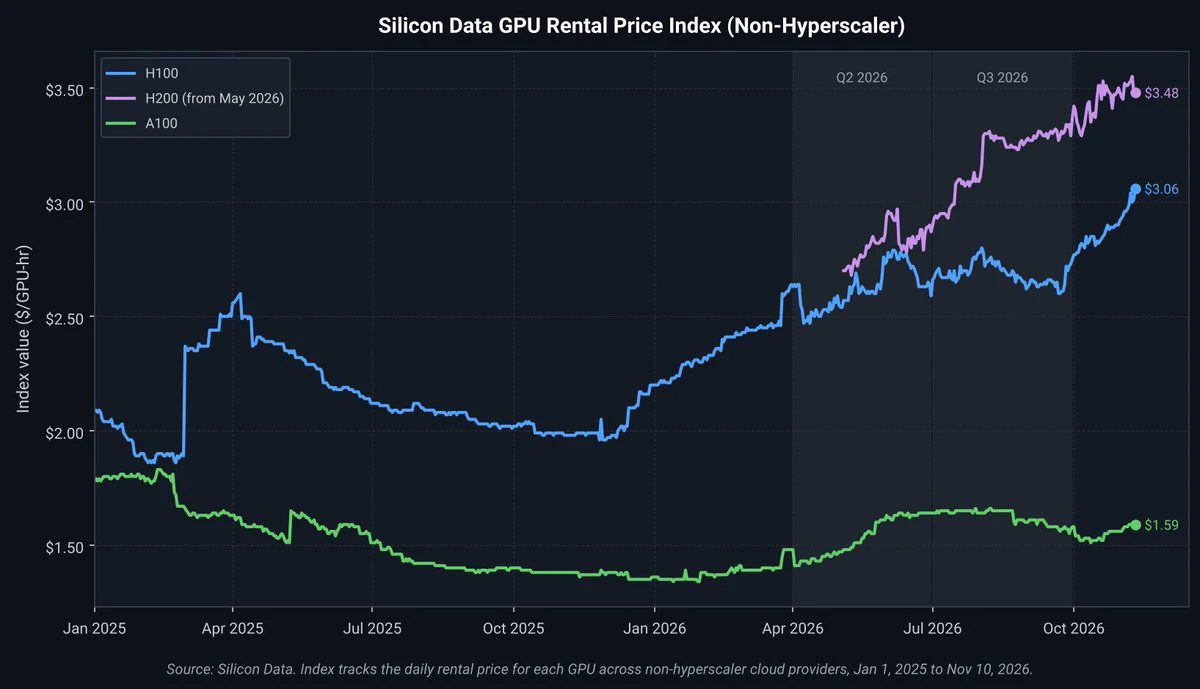
$CRWV is down 75%+ from its high and $NVDA has lost 40%+ this month.
Meanwhile, H100 rental prices just hit their highest level in nearly two years.
Pretty strange disconnect between the stocks and the actual demand for the hardware right now.
H100 is an old chip and in a normal hardware market it would be getting cheaper every month. Instead it's getting more expensive, because every time token prices drop people find more work to throw at the models.
Hopper capacity is being re-signed at up to 2x its original price.
The bear case is that it's VC-funded startups overpaying for spot. I'd bu
post-image
CRWV-12.10%
NVDA-13.84%
H100+0.41%
Load More

Join 40 M users in our growing community

⚡️ Join 40 M users in the crypto craze discussion

💬 Engage with your favorite top creators

👍 See what interests you

Trending Topics

BTCReboundFaces60KTest

2.1M Views30.1K Discussing

BTC rebounded from around $55,300 on November 21, briefly reclaiming $60,000 before pulling back to around $59,300. The $60K level is back in focus as traders assess whether the recovery can last. Is this rebound a sign of stabilization or a short-lived recovery? Would reclaiming and holding $60K be enough, or do you need confirmation from trading volume and fund flows?

PCEAndGDPDataNextWeek

259.2K Views2.6K Discussing

GateDirectIPOPhase3ANTAllocates92100Shares

831.8K Views5K Discussing

View More