
$NEAR USDT - 5.367 +9.37%
NEAR is leading the altcoin run today.
Spot at 5.367 +9.37%, perp at 5.3652 +9.37%, 24h high 5.500, low 4.763, volume 8.00M NEAR, turnover 41.15M. This move is a continuation of what started mid-September.
From September 1 to 15, NEAR was grinding between 2.28 and 2.82. Then it broke. On September 15 it was 2.34, on September 18 it hit 3.45, a 45% move in three days. The full impulse was from 2.29 on September 16 to 4.8 on September 23, a 110% rally in less than 10 days, levels not seen since February. The driver is on-chain, not hype: NEAR Intents, its cross-chain routing system, processed 29.3 billion dollars cumulatively, including 842 million in the past week alone, with a record day above 300 million on September 18 versus 406 million for all of July. Intents generated 5.01 million in fees over 30 days, retaining 1.58 million net revenue.
TVL is approaching 300 million fueled by Ondo partnership bringing tokenized stocks, and AI narrative around NEAR as AI-native blockchain hub. Bitwise even floated a long-term model of 155.85 if roadmap executes.
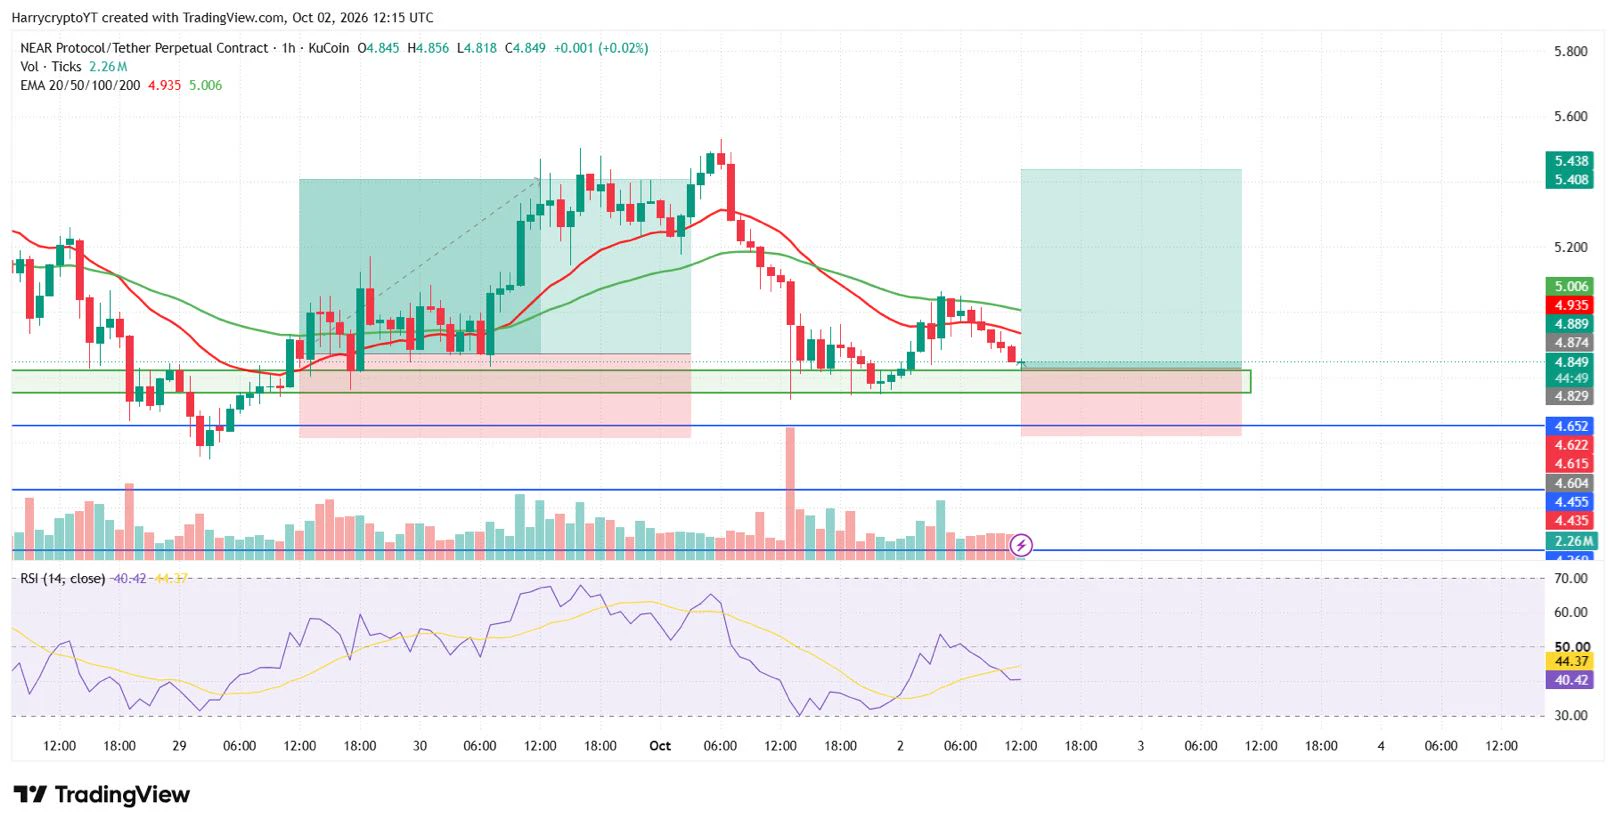
Your chart shows the second leg starting after a dip to 4.587.
What The 4H Chart Shows
Base at 2.298 on Sept 14, vertical to 5.579 around Sept 27, small pullback to 4.587, then immediate re-acceleration to 5.514 today, now 5.367.
EMA5 5.221 / EMA10 5.116 / EMA30 4.961 - perfect bullish stack, price above all three, EMAs rising. The 4.961 EMA30 is the trend backbone; it has not been broken since Sept 19.
MFI 66.542 - bullish, not yet overbought. On the previous top, MFI was above 95. Now at 66, there is room. The dip to 4.587 flushed MFI down to 12-20 area, which reset momentum.
Performance confirms strength: Today 7.84%, 7 days 22.28%, 30 days 185.63%, 90 days 177.51%, 180 days 340.82%, 1 year 102.76%. 30-day at 185% shows this is not a one-day pump.
Immediate support: 5.221 EMA5 and 5.116 EMA10. That 5.11-5.22 zone is first defense for intraday.
Second support: 4.961 EMA30 and 4.922 level on chart. Holding above 4.96 keeps the second leg intact.
Major support: 4.587 purple line, the low of the last pullback. Break below would mean a deeper reset toward 3.938.
Resistance: 5.514 and 5.579 recent highs, then 5.500 today's 24h high and 5.907 measured. A 4H close above 5.579 opens 5.907.
What To Watch
• Volume 8.00M NEAR with 41.15M turnover is strong but not blow-off. Previous top around 5.579 also had high volume. Current push is on similar volume, so buyers are real.
• NEAR is inching close to its 52-week high. Previous reports flagged 3.34 as 52-week high on Sept 19, now we are at 5.36, so that high is already broken and acting as support far below.
• MFI rising from 12 to 66 in three days shows money flow returning fast after the dip. If MFI pushes above 75 with price above 5.514, momentum could accelerate toward 5.90.
• Risk: NEAR is up 340% in 180 days. Any failure to hold 5.11 would trigger fast move to 4.96 then 4.58. Chasing at 5.36 without confirmation above 5.514 is risky.
Bias stays up while above 4.961. For new entries, waiting for hold above 5.221-5.116 or a retest of 4.961 offers better risk.
Snapshot:
NEAR/USDT 5.367 +9.37% / Perp 5.3652 +9.37%
High 5.500 / Low 4.763 / Vol 8.00M / Turnover 41.15M
EMA5 5.221 / EMA10 5.116 / EMA30 4.961 / MFI 66.542
Not Financial Advice.
NEAR is leading the altcoin run today.
Spot at 5.367 +9.37%, perp at 5.3652 +9.37%, 24h high 5.500, low 4.763, volume 8.00M NEAR, turnover 41.15M. This move is a continuation of what started mid-September.
From September 1 to 15, NEAR was grinding between 2.28 and 2.82. Then it broke. On September 15 it was 2.34, on September 18 it hit 3.45, a 45% move in three days. The full impulse was from 2.29 on September 16 to 4.8 on September 23, a 110% rally in less than 10 days, levels not seen since February. The driver is on-chain, not hype: NEAR Intents, its cross-chain routing system, processed 29.3 billion dollars cumulatively, including 842 million in the past week alone, with a record day above 300 million on September 18 versus 406 million for all of July. Intents generated 5.01 million in fees over 30 days, retaining 1.58 million net revenue.
TVL is approaching 300 million fueled by Ondo partnership bringing tokenized stocks, and AI narrative around NEAR as AI-native blockchain hub. Bitwise even floated a long-term model of 155.85 if roadmap executes.
Your chart shows the second leg starting after a dip to 4.587.
What The 4H Chart Shows
Base at 2.298 on Sept 14, vertical to 5.579 around Sept 27, small pullback to 4.587, then immediate re-acceleration to 5.514 today, now 5.367.
EMA5 5.221 / EMA10 5.116 / EMA30 4.961 - perfect bullish stack, price above all three, EMAs rising. The 4.961 EMA30 is the trend backbone; it has not been broken since Sept 19.
MFI 66.542 - bullish, not yet overbought. On the previous top, MFI was above 95. Now at 66, there is room. The dip to 4.587 flushed MFI down to 12-20 area, which reset momentum.
Performance confirms strength: Today 7.84%, 7 days 22.28%, 30 days 185.63%, 90 days 177.51%, 180 days 340.82%, 1 year 102.76%. 30-day at 185% shows this is not a one-day pump.
Immediate support: 5.221 EMA5 and 5.116 EMA10. That 5.11-5.22 zone is first defense for intraday.
Second support: 4.961 EMA30 and 4.922 level on chart. Holding above 4.96 keeps the second leg intact.
Major support: 4.587 purple line, the low of the last pullback. Break below would mean a deeper reset toward 3.938.
Resistance: 5.514 and 5.579 recent highs, then 5.500 today's 24h high and 5.907 measured. A 4H close above 5.579 opens 5.907.
What To Watch
• Volume 8.00M NEAR with 41.15M turnover is strong but not blow-off. Previous top around 5.579 also had high volume. Current push is on similar volume, so buyers are real.
• NEAR is inching close to its 52-week high. Previous reports flagged 3.34 as 52-week high on Sept 19, now we are at 5.36, so that high is already broken and acting as support far below.
• MFI rising from 12 to 66 in three days shows money flow returning fast after the dip. If MFI pushes above 75 with price above 5.514, momentum could accelerate toward 5.90.
• Risk: NEAR is up 340% in 180 days. Any failure to hold 5.11 would trigger fast move to 4.96 then 4.58. Chasing at 5.36 without confirmation above 5.514 is risky.
Bias stays up while above 4.961. For new entries, waiting for hold above 5.221-5.116 or a retest of 4.961 offers better risk.
Snapshot:
NEAR/USDT 5.367 +9.37% / Perp 5.3652 +9.37%
High 5.500 / Low 4.763 / Vol 8.00M / Turnover 41.15M
EMA5 5.221 / EMA10 5.116 / EMA30 4.961 / MFI 66.542
Not Financial Advice.