Share your thoughts
placeholder
Article
Everyone’s watching ASTER’s range—but the 4h chart just whispered a secret most traders missed.

$ASTER /USDT - SHORT

Trade Plan:
Entry: 0.7760 – 0.7838
SL: 0.8173
TP1: 0.7519
TP2: 0.7332
TP3: 0.7051

Why this setup?
- RSI at 47.8 on the 15m shows zero bullish momentum, just dead air before the drop.
- ATR (0.0156) is coiling tight—this range is a spring, and shorts are the trigger.
- Why now? Entry ref 0.7799 sits mid-range, but TP1 at 0.7519 is only 3.6% away—low risk, high probability.
- Trend 1D is “range,” but range lows always break when RSI flattens like this.

Debate:
Are we
post-image
ASTER-7.01%
$BTC is hovering around $80,000.
But the real battle is happening at the 50W MA.
This weekly close could be one of the most important closes of the cycle.
📈 Close above the 50W MA → strong confirmation that the bottom may be in.
📉 Rejection → more downside risk remains.
#Bitcoin is at a decision point.
Watch the weekly close.
post-image
BTC+0.13%
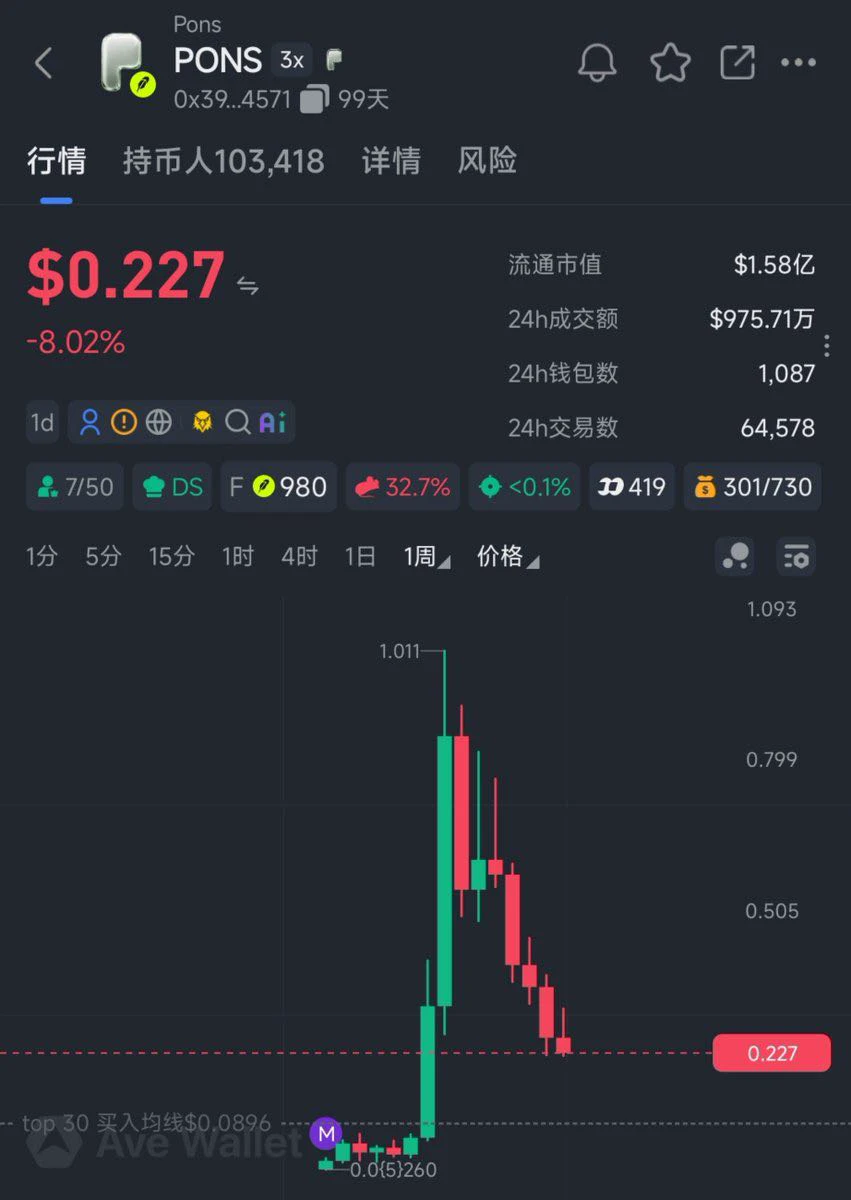
Bonk Guys PONS holdings achieved returns of over 150x, while the portfolio surpassed $27 million to
live-cover
LIVE2,133
Could it reach 3.6?? #METIS.
Everyone, please don't chase, because I'm in profit.
post-image
METIS+21.37%
Bonk Guys PONS holdings achieved returns of over 150x, while the portfolio surpassed $27 million to
live-cover
LIVE2,106
The hand that set the stop-loss a few days ago trembled slightly; this morning I found that was unnecessary filial piety. The last thing I saw before bed, $AAVE /AAVE was still grinding along the lower boundary, but the buy orders were getting more solid with each wave.

The buying strengthened, and support was clearly stronger too. Once the pullback reached the right level, I opened a long, with the entry price recorded at 127.72. At that moment, I had just one thought: I was still bullish; if it hadn't broken down, why run?

And the result is clear to everyone: the current price has climbed
post-image
AAVE+3.33%
ETH+1.38%
DOGE+2.40%
I originally wanted to cut my losses and sacrifice them to the heavens, but the ritual never happened—the meat cooked itself. When I checked the charts after lunch, $ETH was still stuck around 2111.16. Some said it was weak, but to me it looked more like funds were quietly entering. The pullback held, buying pressure strengthened—this was a spot worth trying once.
I went long right away without expecting an immediate rally. Then market sentiment improved, and ETH has now reached 2498.89, throwing a +3192.55% return straight in my face. This feels amazing. With a trend like this, I don't even h
post-image
ETH+1.38%
DOGE+2.40%
SOL+2.90%
$EIGEN EIGEN Could Be Preparing for Another Pump! (2H)
EIGEN appears to be forming a large triangle pattern and is currently in wave D of this triangle. Wave D appears to be developing as a Zigzag Diametric pattern.
If the price reaches the green zone, it could potentially move toward the marked targets.
We are looking for buy/long opportunities within the green zone.
A 4-hour candle close below the invalidation level would invalidate this analysis.
If you have a coin or altcoin you want analyzed, first hit the like button and then comment its name so I can review it for you.
Do you think EIGE
post-image
EIGEN+2.66%
I originally wanted to sell at a loss and sacrifice the position to the heavens, but before I could make the sacrifice, the meat cooked itself.
$TAO 's rebound this time was something I truly didn't expect to come so fast. While it was grinding along the bottom intraday, everyone was shouting about a breakdown. I panicked too, but after taking a look at 225.0, it was clear that real money was entering and support hadn't broken, so I decided to hold on a little longer instead of selling at the bottom.
A few days ago, it was the last thing I saw before bed, and I was still hesitating. When I woke
post-image
TAO+2.91%
BTC+0.14%
ADA+0.97%
#ZEC Major sell signal, with multiple sell signals stacking up—go straight short! If the move continues, add to your position at 1350 and 1250!
Only those who can't see the situation clearly are going long—seize this move.
post-image
ZEC+16.12%
#‌$NVDA NVDA AT $231: NVIDIA REMAINS ONE OF THE STRONGEST AI STOCKS — FULL MARKET ANALYSIS, NFP IMPACT & TRADING PLAN
NVIDIA remains one of the most powerful names in the global technology market, and in my view NVDA continues to deserve serious attention because the AI infrastructure story is far from finished. With NVDA around the $231 area, the stock is sitting in an important decision zone where momentum, fundamentals, AI demand, macroeconomic pressure and valuation are all coming together. The latest verified Friday close was approximately $230.36, after NVDA traded as high as $234.76 and
$Niu Lai Niu Lai, I happen to be free now. Shall we chat?
post-image
牛来-17.10%
📅 Snowball Check-in | Day 54 #Building a Position | Total Return: +91%
💰 Principal: 6000U | Current: 11300U
⚖️ Position: 60%
🪙 Holdings: Spot $HYPE $ZEC $UAI
💡 Strategy: BTC is rising, creating a certain profit-making effect, so I increased my position. Before I knew it, two months had passed. Overall, it is close to doubling, but overall profits are not as good as those in the long-term account left untouched. The current trend and the coordinated rise among major coins look much like the early to mid-stages of a bull market, so there should still be some good opportunities ahead. Stay p
HYPE+3.76%
ZEC+16.14%
UAI+11.81%
Everyone’s staring at USELESS while the 4h chart quietly prints a 95% long setup.

$USELESS /USDT - LONG

Trade Plan:
Entry: 0.22366 – 0.23278
SL: 0.18441
TP1: 0.26108
TP2: 0.28299
TP3: 0.31585

Why this setup?
Why now? The 1D trend is bullish, but the 15m RSI (44.53) just reset—buyers reloaded before the breakout. Entry zone: 0.22822 (low 0.22366). Target ladder: TP1 0.26108 (+14%), TP2 0.28299 (+24%), TP3 0.31585 (+38%). ATR (0.018) says volatility is compressed—spring is loaded. Stop at 0.18441 keeps risk tight.

Debate:
Is USELESS the next 2x runner, or does the 0.14884 invalidation tr
USELESS-8.87%
SPCX is sitting on an event-driven setup. AMZN is showing a much quieter recovery structure.
That difference matters more than simply comparing which stock is “more bullish.”
Market Snapshot
$SPCX / USDT • Price: $147.95 • 24H: -1.20% • Volume: 48.57M shares • Range: $147.32–$150.85
$AMZN / USDT • Price: $258.51 • 24H: -0.15% • Volume: ~29.9M shares • Range: $255.29–$261.12
SPCX data: AMZN data:
Why It Matters
SPCX just went through its second Gate Pre-IPO stock-unlock cycle on September 3. Gate says the round represented 7% of the target-company allocation, equivalent to 8.75% of current SPCX
SPCX+0.75%
AMZN+0.09%
Going long this time was actually quite uncomfortable. Right after entering, I got caught by a false-breakout wick, which nearly took out my stop-loss at a key level. I didn’t cut the position at the key level because volume hadn’t expanded; instead, it looked more like a shakeout. The market then saw a series of small bullish candles, and the battle between bulls and bears quickly shifted in favor of the bulls. When the price reached around 2.3738, I took profit on 70% of the position and moved the stop-loss on the remainder above breakeven. Profit is currently at +1901.7%, and the remaining
post-image
LAB-3.00%
BTC+0.14%
$GT ‌ ‌GateToken is the native exchange token of Gate.io ecosystem and Gate Chain gas asset.
• Utility Model: Fee discount up to 30%, VIP level multiplier, Launchpad and HODLer Airdrop eligibility, Gate Chain PoS staking and gas. Quarterly burn from exchange profit creates deflationary supply. • Market Position: Tagged NO.1 Exchanges and GT Eco. Exchange tokens are beta to BTC plus exchange volume alpha. GT at 9.24 trading +28.8% above Avg Price 7.17 indicates average position is in profit, reducing overhead selling pressure compared to August. • Relative Performance: 30d +39.79% vs BTC +∼12%
post-image
GT+1.32%
  • 1
This 4h chart is screaming something most BNB holders refuse to hear.

$BNB /USDT - SHORT

Trade Plan:
Entry: 756.48 – 758.82
SL: 768.84
TP1: 749.26
TP2: 743.67
TP3: 735.28

Why this setup?
Why now? The 1D trend is ranging, but the 4h structure just armed a SHORT signal with 55% confidence. Entry sits at 757.65, with TP1 at 749.26 and TP2 at 743.67—a clean 1.8% downside before support gets real. RSI on the 15m is at 46.9, meaning no oversold bounce is coming to save bulls yet. ATR on the 1h is 4.66, so moves are tight but directional—this isn't a fakeout zone; it's a coil. The invalid level
BNB-1.98%
JUST IN: HYPE trades above $88 for a fresh all-time high, +4.21% over 24h. This adds upside tilt as momentum heats up in the memecoin-ish space. $HYPE
post-image
HYPE+3.76%
My hand trembled slightly when setting the stop-loss a few days ago, only to realize this morning that the extra caution had been unnecessary. The last thing I saw before bed was $ARB hovering around 0.10885. I judged that the pullback had held, with buyers indeed entering quietly, so I casually placed a long order and turned off the lights.

When I opened the chart this morning, this candle jolted me wide awake. ARB surged straight to 0.19477, with gains of +4532.11%. Those already on board should have woken up laughing; the hesitation from a few days ago instantly turned into relief.

The
post-image
ARB+42.24%
ETH+1.38%
LAB-3.00%
Load More

Join 40 M users in our growing community

⚡️ Join 40 M users in the crypto craze discussion

💬 Engage with your favorite top creators

👍 See what interests you

View More