ALEXKHAN

vip
Age 1.6 Year
Peak Tier 0
No content yet
#GrayscaleBuysAndStakesOver510KHYPE
A major institutional development is unfolding in the crypto market where Grayscale is reported to have accumulated and staked over 510,000 HYPE tokens from the Hyperliquid ecosystem.
This is not a random market purchase. It is a structured, strategic, and highly calculated institutional positioning event that reflects multiple layers of intent:
Long-term exposure building in a high-growth trading ecosystem
ETF preparation and inventory accumulation strategy
Staking-based yield generation for compounding returns
Supply reduction in circulating markets
Parti
HighAmbition
#GrayscaleBuysAndStakesOver510KHYPE
A major institutional development is unfolding in the crypto market where Grayscale is reported to have accumulated and staked over 510,000 HYPE tokens from the Hyperliquid ecosystem.
This is not a random market purchase. It is a structured, strategic, and highly calculated institutional positioning event that reflects multiple layers of intent:
Long-term exposure building in a high-growth trading ecosystem
ETF preparation and inventory accumulation strategy
Staking-based yield generation for compounding returns
Supply reduction in circulating markets
Participation in decentralized financial infrastructure
At a market valuation range of approximately $50 – $56 per HYPE, this accumulation represents roughly $25 million to $29 million+ in deployed capital, depending on execution timing and price fluctuations.
The most important detail is not just the size of the purchase, but the fact that the tokens were immediately staked, meaning they were locked into the network rather than being kept liquid for trading.
This alone changes the market structure because it removes supply from circulation while increasing long-term holding pressure.
2. What Is HYPE?
HYPE is the native token of the Hyperliquid ecosystem, which is one of the most advanced decentralized trading infrastructures currently operating in the blockchain sector.
Unlike typical DeFi tokens, Hyperliquid is built as a full Layer-1 trading-focused blockchain, designed specifically for high-performance financial execution.
It supports:
Perpetual futures trading at scale
Spot trading markets with deep liquidity
Lending and borrowing protocols
High-frequency on-chain order book execution
Emerging real-world asset (RWA) integration frameworks
The network is powered by a specialized consensus mechanism called HyperBFT, which is optimized for:
Extremely fast block finality
Low latency trade execution
High throughput under heavy trading volume
Institutional-grade system performance
This makes Hyperliquid not just a DeFi protocol, but a full decentralized exchange infrastructure layer competing with centralized exchanges in performance terms.
3. HYPE Tokenomics — Structural Supply & Utility Model
The tokenomics of HYPE are designed around both utility and deflationary pressure:
Maximum supply: ~1 billion HYPE
Circulating supply: ~240M – 255M HYPE
Market capitalization: ~$12B – $14.5B+
FDV potential range: ~$40B – $50B+ in strong cycles
Core utility functions include:
Network staking for validation and reward generation
Governance participation in protocol upgrades
Fee settlement across trading infrastructure
Collateral usage in lending and derivatives systems
Ecosystem participation across DeFi modules
One of the strongest structural features is the buyback-and-burn mechanism, where protocol-generated revenue is used to continuously reduce circulating supply.
This creates a long-term deflationary environment where demand expansion directly impacts scarcity.
4. Market Performance & Price Behavior (May 2026)
HYPE has been one of the strongest performing large-cap altcoins in the current cycle.
Recent market structure shows:
Price range: $45 → $57+ intraday volatility swings
Current trading region: $55 – $57 zone
Market cap: $12B – $14.5B+ range
Year-to-date performance: approximately +100% to +120%+ growth
Intraday volatility: often 10% – 20% movements during news cycles
The asset consistently reacts strongly to:
ETF announcements
Institutional accumulation reports
Staking integration updates
Whale wallet movements
Market-wide liquidity expansions
This makes HYPE a high-beta institutional narrative asset within the current crypto cycle.
5. Institutional Strategy Behind Grayscale Position
Grayscale’s involvement is part of a larger ETF-driven capital strategy.
This includes:
Early accumulation before ETF approval
Building inventory for structured ETF products
Preparing staking-enabled yield generation exposure
Custody framework alignment with institutional standards
Long-term positioning in decentralized trading infrastructure
This shows a shift in institutional behavior:
Institutions are no longer just buying crypto assets—they are building financial products around crypto yield systems.
6. Why Staking 510K+ HYPE Is a Structural Market Event
Staking such a large amount of HYPE creates multiple cascading effects:
Supply Reduction Effect
A large portion of circulating supply is locked, reducing immediate sell pressure.
Scarcity Expansion Effect
Reduced liquidity increases sensitivity to demand spikes.
Institutional Commitment Signal
Staking indicates long-term conviction rather than short-term speculation.
Yield Compounding Effect
Staked assets generate rewards that increase total holdings over time.
Network Security Reinforcement
Large stakers contribute directly to protocol stability and validation strength.
This combination creates a multi-layer bullish structural environment for price discovery cycles.
7. ETF Competition Landscape — Major Catalyst Engine
The HYPE ETF ecosystem is rapidly evolving with multiple competing issuers:
21Shares ETF (early market entry, first mover advantage)
Bitwise ETF (staking-enabled yield structure)
Grayscale ETF (largest institutional brand influence, pending approval)
ETF flows are already showing strong momentum:
Multi-million dollar daily inflows during peak trading sessions
Rapid volume expansion across ETF-linked instruments
Demand exceeding some protocol-level supply reduction mechanisms
Continuous accumulation pressure from fund rebalancing cycles
This creates a structural imbalance where institutional demand continuously absorbs available supply.
8. Why Hyperliquid Is Attracting Massive Institutional Capital
Hyperliquid is not a typical crypto project. It functions as a real revenue-generating decentralized trading engine.
Key strengths include:
Dominance in decentralized perpetual futures trading
Extremely high trading volume across on-chain markets
Strong protocol revenue generation
Buyback-and-burn tokenomic cycle
Expanding ecosystem into RWAs and structured finance
High efficiency compared to traditional DeFi systems
At peak activity levels, Hyperliquid has accounted for a significant share of blockchain fee generation across the entire crypto ecosystem, highlighting real economic usage rather than speculative activity alone.
9. Whale Activity & Institutional Flow Expansion
Beyond Grayscale, multiple large-scale actors are actively accumulating:
Institutional custody withdrawals into cold storage systems
Multi-million dollar whale entries in single execution blocks
Venture capital-linked wallets increasing exposure positions
ETF seed capital deployment strategies across exchanges
Off-exchange accumulation patterns indicating long-term holding
Some transactions exceed 100K–500K HYPE per execution batch, showing clear institutional-scale accumulation behavior.
10. Market Risks & Structural Limitations
Despite strong momentum, several risks remain:
ETF approval is not guaranteed and depends on regulatory decisions
Staking integration inside ETFs remains conditional in certain jurisdictions
High volatility with potential for sharp corrections
Liquidity concentration risk during institutional accumulation phases
Competition from emerging decentralized trading platforms
These factors can cause sudden shifts in momentum even during strong bullish cycles.
11. Trading Strategy Section — How Traders Can Benefit From This Event
This institutional event creates multiple trading opportunities depending on strategy type.
1. Spot Accumulation Strategy (Long-Term Traders)
Build positions during market pullbacks instead of chasing highs
Accumulate gradually in structured price zones rather than full entry
Hold through medium-term cycles driven by ETF expansion narratives
Consider staking exposure if available for yield compounding
Focus on long-term structural growth rather than short-term volatility
This strategy benefits from supply tightening due to staking and ETF accumulation.
2. Breakout Momentum Strategy (Active Traders)
Enter positions only after confirmed breakout above key resistance zones ($55 – $58 range)
Wait for volume confirmation before entering trades
Target next liquidity zones during strong upward momentum phases
Take partial profits during extended moves to lock gains
Avoid entering during overextended news spikes
This strategy captures fast ETF-driven price expansions.
3. Swing Trading Strategy (News Cycle Traders)
Trade ETF announcements and staking news cycles
Capture 15% – 50% volatility swings in short-term movements
Enter after pullbacks instead of chasing green candles
Use structured stop-loss levels below support zones
Re-enter during consolidation phases for next momentum wave
This is one of the most effective approaches in high-volatility assets like HYPE.
4. Risk Management Strategy (Essential Layer)
Avoid high leverage during ETF-driven volatility
Always use stop-loss protection to reduce downside exposure
Diversify portfolio exposure instead of single-asset concentration
Reduce position size during major news events
Track Bitcoin trend as macro directional confirmation
Risk control becomes critical in institutional flow-driven markets.
5. Advanced Flow Strategy (Professional Traders)
Monitor ETF inflow data as a leading price indicator
Track whale accumulation wallets for early signals
Analyze staking supply changes for liquidity pressure shifts
Follow protocol revenue and burn rates as supply-demand signals
Align trades with macro crypto market liquidity cycles
This approach focuses on flow-based trading rather than price-only analysis.
12. Future Outlook (2026–2030)
If current momentum continues, Hyperliquid and HYPE may evolve into:
Core infrastructure for decentralized derivatives trading
Major ETF-backed institutional crypto exposure asset
High-yield staking-based financial instrument
Cross-chain liquidity aggregation hub
Integrated RWA trading and settlement environment
Potential price trajectory scenarios (depending on adoption):
Short-term expansion cycles: $60 – $80 range movements
Strong bullish cycles: $100+ speculative zone potential
Extreme adoption scenarios: higher valuations tied to ETF expansion
However, volatility and corrections will remain part of the long-term structure.
Final Conclusion — Structural Market Transformation
The accumulation and staking of over 510K HYPE by Grayscale represents a major turning point in crypto market structure.
It highlights a transition where:
Institutional capital is actively entering decentralized trading systems
ETFs are becoming dominant demand engines
Staking is transforming assets into yield-generating instruments
Liquidity is shifting from retail-driven to institution-driven cycles
Blockchain trading infrastructure is becoming a core financial layer
For traders, this environment offers high opportunity but also requires disciplined strategy, strict risk management, and awareness of rapid volatility cycles driven by institutional flows and ETF-based demand expansion.
repost-content-media
  • Reward
  • 1
  • Repost
  • Share
HighAmbition:
2026 GOGOGO 👊
#SpaceXOfficiallyFilesforIPO
On May 20, 2026, SpaceX officially filed its S-1 registration statement with the U.S. Securities and Exchange Commission (SEC), marking the formal beginning of its Initial Public Offering (IPO) process.
This event is one of the most significant milestones in modern financial and technological history because it represents the transition of SpaceX from a privately controlled aerospace company into a publicly traded global corporation.
The filing confirms that SpaceX is preparing to raise massive public capital through stock market listing, allowing institutional an
HighAmbition
#SpaceXOfficiallyFilesforIPO
On May 20, 2026, SpaceX officially filed its S-1 registration statement with the U.S. Securities and Exchange Commission (SEC), marking the formal beginning of its Initial Public Offering (IPO) process.
This event is one of the most significant milestones in modern financial and technological history because it represents the transition of SpaceX from a privately controlled aerospace company into a publicly traded global corporation.
The filing confirms that SpaceX is preparing to raise massive public capital through stock market listing, allowing institutional and retail investors worldwide to gain direct exposure to its space exploration, satellite internet, and AI infrastructure businesses.
The IPO is expected to be one of the largest ever recorded in global markets, both in valuation scale and investor demand intensity.
2. What is SpaceX? Full Structural Breakdown
SpaceX, officially known as Space Exploration Technologies Corp., was founded in 2002 by Elon Musk with a long-term vision of reducing space transportation costs and enabling human life beyond Earth.
The company operates across multiple highly advanced industries, making it not just a rocket company but a multi-sector space, communications, and AI infrastructure ecosystem.
Core Business Segments:
1. Rocket Launch Services SpaceX operates some of the most advanced reusable rocket systems in the world:
Falcon 9 → most reliable reusable orbital rocket with hundreds of successful missions
Falcon Heavy → heavy-lift launch system for large payload missions
Starship → next-generation fully reusable spacecraft designed for Mars colonization, Moon missions, and global point-to-point transport
Launch costs have been drastically reduced due to reusability, making SpaceX the global leader in commercial space launches.
2. Starlink Satellite Internet Starlink is one of the fastest-growing satellite internet constellations in the world, providing:
High-speed broadband internet globally
Coverage for rural, remote, and underserved regions
Maritime, aviation, and defense connectivity solutions
Starlink has now become the largest revenue-generating division of SpaceX, with 10.3 million+ subscribers (March 2026) and rapidly expanding enterprise adoption.
3. Government & Defense Contracts SpaceX is a critical contractor for:
NASA crew and cargo missions to the International Space Station
U.S. Department of Defense satellite launches
Artemis lunar program missions
National security payload deployments
This segment provides stable, long-term revenue streams.
4. AI & Emerging Infrastructure Expansion SpaceX is also expanding into:
AI compute infrastructure
Space-based data centers
Integration with Elon Musk’s AI ecosystem including xAI
This positions SpaceX as a hybrid company combining space + telecom + AI infrastructure.
3. IPO Details: Structure, Size & Market Expectations
The SpaceX IPO is structured as one of the most ambitious public offerings ever recorded.
Key IPO Parameters:
Ticker Symbol: SPCX
Exchange: Nasdaq & Nasdaq Texas
Target capital raise: $75B – $80B
Expected valuation: $1.75 trillion – $2 trillion+
Share type: Class A common stock (1 vote per share)
Control structure: Elon Musk retains control via Class B shares (10 votes per share)
Underwriters:
Goldman Sachs
Morgan Stanley
JPMorgan Chase
Citigroup
Bank of America Securities
Expected Timeline:
Roadshow: Early June 2026
Pricing date: Around June 11, 2026
Market debut: Around June 12, 2026 (expected accelerated listing)
4. Financial Performance: Deep Breakdown from S-1 Filing
The financial structure of SpaceX shows a high-growth but capital-intensive business model.
Revenue & Earnings:
Q1 2026 Revenue: $4.69 billion
2025 Annual Revenue: $18.5B – $18.7B
Starlink contribution: ~60%+ of total revenue
NASA & government contracts: ~$1B+ annually
Profit & Loss Structure:
Q1 2026 Net Loss: approximately $4.28 billion
Loss drivers:
Starship development costs
AI infrastructure expansion
Massive Starlink satellite deployment
Capital-intensive global scaling
Balance Sheet:
Cash reserves: $15.8 billion
Bitcoin holdings: 18,712 BTC (~$1.3B – $1.5B value range depending on market price)
This makes SpaceX one of the largest corporate Bitcoin holders entering public markets.
5. Starlink: The Core Valuation Engine
Starlink is widely considered the primary valuation driver of SpaceX.
Key metrics:
Subscribers: 10.3 million+
Strong global expansion across aviation, maritime, and enterprise markets
Rapid scaling in underserved regions
Increasing government and military adoption
Revenue growth from Starlink is expected to significantly outpace traditional rocket launch income in the long term.
6. xAI Merger & AI Expansion Strategy
In 2026, SpaceX merged with Elon Musk’s AI company xAI, creating a combined ecosystem of:
Rocket technology
Satellite communication networks
AI infrastructure and compute systems
Additionally:
Anthropic signed a $1.25 billion per month contract (through 2029) for compute infrastructure
SpaceX is evolving into a global AI + space computing infrastructure provider
This significantly expands its valuation beyond aerospace into multi-industry technological dominance.
7. Market Valuation Context & Investor Expectations
At a valuation range of $1.75 trillion to $2 trillion+, SpaceX becomes one of the most valuable companies ever to go public.
Market justification factors:
Starlink global scaling potential
Starship’s future interplanetary transport capability
AI infrastructure monetization
Government defense contracts
Satellite internet monopoly potential in emerging markets
However, valuation also implies extremely high expectations for execution.
8. Risk Factors & Structural Challenges
Despite massive potential, several risks exist:
High capital expenditure requirements
Starship development delays
Regulatory and space policy constraints
Competition in satellite internet (OneWeb, Amazon Kuiper)
Execution complexity across multiple industries
Profit volatility due to expansion-heavy strategy
The company remains highly dependent on long-term scaling success.
9. Trading & Investment Strategy Perspective (Post-IPO Focus)
Once listed under SPCX, market behavior is expected to be highly volatile in early trading phases.
1. IPO Entry Strategy (Retail Investors)
Avoid chasing initial listing hype spikes
Wait for post-IPO price stabilization phase
Accumulate during early consolidation periods
Focus on long-term growth rather than short-term volatility
2. Momentum Trading Strategy
Trade breakout zones after IPO stabilization
Use volume confirmation for entries
Capture volatility cycles (10%–40% swings common early)
Exit partially during strong institutional inflow spikes
3. Long-Term Investment Strategy
Focus on Starlink revenue growth curve
Hold through multi-year expansion cycles
Treat SpaceX as a multi-sector tech + infrastructure asset
Ignore short-term volatility noise
4. Risk Management Strategy
Avoid over-leveraging IPO volatility
Use strict stop-loss levels in early trading phases
Diversify exposure across sectors
Monitor macro market conditions (rates, liquidity cycles)
10. Future Outlook (2026–2035)
If execution remains successful, SpaceX could evolve into:
Global satellite internet monopoly leader
Core space transportation infrastructure provider
AI compute backbone for global systems
Mars and lunar mission logistics provider
Multi-trillion dollar diversified tech-space conglomerate
Potential long-term scenarios:
Base case: $2T – $3T valuation range stability
Bullish case: $3T – $5T+ expansion cycle
Extreme scenario: interplanetary infrastructure dominance
o A Financial & Technological Turning Point
The SpaceX IPO filing (SPCX) represents one of the most important financial events in modern history, marking the transition of humanity’s most advanced private aerospace company into global public markets.
It is not just an IPO—it is the financial unlocking of:
Space infrastructure
Satellite internet dominance
AI compute integration
Government defense contracts
Interplanetary exploration technology
For investors, this creates a rare opportunity—but also demands careful risk management due to extreme valuation expectations and execution complexity.
SpaceX is now moving from a visionary private company into a public global infrastructure powerhouse shaping the future of space, internet, and AI systems simultaneously.
repost-content-media
  • Reward
  • Comment
  • Repost
  • Share
#PolymarketLaunchesPrivateCompanyPredictionMarkets
In May 2026, Polymarket introduced private company prediction markets that represent a major evolution in global financial thinking because they transform how future expectations about companies are formed, shared, and priced across the world. Instead of relying only on analysts, venture capital firms, or delayed financial reports, this system allows global participants to continuously express their beliefs about the future of high-impact private companies through real-time probability-based trading.
By including companies such as OpenAI, Ant
HighAmbition
#PolymarketLaunchesPrivateCompanyPredictionMarkets
In May 2026, Polymarket introduced private company prediction markets that represent a major evolution in global financial thinking because they transform how future expectations about companies are formed, shared, and priced across the world. Instead of relying only on analysts, venture capital firms, or delayed financial reports, this system allows global participants to continuously express their beliefs about the future of high-impact private companies through real-time probability-based trading.
By including companies such as OpenAI, Anthropic, SpaceX, Stripe, and Databricks, Polymarket has effectively created a system where the future of innovation is no longer only discussed—it is continuously priced by global collective intelligence in real time.
This is important because it marks a shift from traditional financial markets, which price current assets, toward forecasting markets, which price future outcomes directly.
2. Core Idea: Converting Global Expectations Into Live Probability Pricing
At the heart of this system is a very simple but powerful idea: every future event can be represented as a probability, and that probability can be traded like a financial asset.
Instead of asking “What is the value of a company today?”, the market asks:
Will this company reach a certain valuation?
Will it go public within a timeframe?
Will it outperform another competitor?
Each contract price reflects collective belief. For example, if a market trades at $0.75, it means the global consensus assigns a 75% chance that the event will happen. This turns abstract expectations into structured, measurable, and continuously updated financial signals.
The result is a system where information, speculation, and analysis merge into one dynamic pricing engine.
3. System Architecture: Blockchain Execution and Transparent Settlement
Polymarket operates on the Polygon blockchain, which provides a scalable and low-cost infrastructure for continuous trading activity. This ensures that users from anywhere in the world can participate without friction, delays, or high transaction fees.
All markets are structured as binary outcomes:
Yes = $1 payout if event happens
No = $1 payout if event does not happen
Between entry and resolution, prices fluctuate based on supply and demand, reflecting changing expectations.
All transactions are settled using USDC stablecoin, which removes volatility from the settlement layer and ensures that the focus remains purely on prediction accuracy rather than currency fluctuations.
This architecture makes the system transparent, verifiable, and globally accessible.
4. Trust Layer: Nasdaq Private Market Integration for Data Accuracy
A critical strength of this ecosystem is its integration with Nasdaq Private Market, which provides verified private company valuation data used to resolve market outcomes.
This matters because private companies traditionally operate in a highly opaque environment where valuation updates, funding rounds, and secondary transactions are not always publicly transparent or standardized.
By anchoring resolution to institutional-grade data sources, Polymarket ensures that:
Market outcomes are verifiable
Valuation data is consistent
Disputes are minimized
Trust in settlement logic is strengthened
This transforms prediction markets from opinion-based speculation into data-backed forecasting systems.
5. Market Structure: What Users Are Actually Predicting
These markets are designed to capture multiple layers of private company evolution, allowing participants to express views on different dimensions of growth and success.
A. Valuation Growth Markets
These markets focus on whether companies will cross specific valuation milestones within a defined timeframe. They effectively translate long-term growth expectations into real-time pricing signals that reflect how the world perceives the trajectory of innovation.
B. IPO Timing and Public Listing Markets
Participants can trade predictions on when companies like OpenAI or Stripe will eventually go public. This creates a continuous market-based timeline for IPO expectations rather than relying on rumors or speculation.
C. Competitive Ranking Markets
These markets allow users to compare companies directly, such as whether Anthropic will surpass competitors in valuation or market dominance. This introduces a direct comparative intelligence layer between major industry players.
D. Private Market Activity Forecasts
These include predictions about funding rounds, employee liquidity events, and secondary share sales, giving insight into internal financial momentum that is usually hidden from public view.
6. Why This Matters: Democratizing Access to Private Market Intelligence
Historically, private company insights were reserved for venture capital firms, institutional investors, and insiders with access to confidential deal flow. Retail participants had almost no visibility into how these companies were valued or how fast they were growing.
Polymarket changes this by allowing anyone to participate in forecasting the future of these companies through simple financial contracts.
This does not give ownership, but it gives something equally powerful in modern finance: access to expectations and sentiment about the future of innovation.
This democratization turns private market intelligence into a global, open-access forecasting system.
7. Real-Time Intelligence Engine: How Markets Process Global Information
These prediction markets act as continuous intelligence systems that absorb global information such as:
Funding announcements
AI model breakthroughs
Regulatory developments
Macroeconomic changes
Corporate partnerships
Whenever new information enters the system, prices adjust instantly, reflecting updated collective expectations.
This creates a continuously evolving probability model of the future, where the market behaves like a distributed brain constantly recalculating the likelihood of major global events.
8. Emerging Trading Behavior: How Participants Use the System
As the system grows, new types of trading strategies are emerging that blend analysis, speculation, and narrative understanding.
1. Narrative-Driven Positioning
Traders align positions with major global themes such as AI expansion, space exploration, fintech disruption, and defense technology growth, using markets to express long-term belief in structural economic shifts.
2. Event-Based Reaction Trading
Short-term movements occur around funding announcements, product launches, leadership changes, and industry news, creating fast-moving opportunities based on information flow.
3. Relative Value Comparison
Participants compare companies like OpenAI and Anthropic to identify mispricing between competitors operating in similar domains.
4. Liquidity and Sentiment Inefficiency Trading
Advanced traders exploit temporary mispricing caused by low liquidity, delayed reactions, or overreactions to news events.
9. Risks and Structural Challenges
While highly innovative, the system also introduces important risks.
Regulatory uncertainty remains a key concern because private valuation speculation intersects with retail financial participation, creating questions around classification and oversight.
Information asymmetry is another challenge because individuals with early or non-public knowledge may influence pricing more effectively than general participants.
Liquidity differences across markets can also create inefficiencies, especially in newly launched contracts with limited participation.
Finally, prediction markets inherently carry the risk of total capital loss if outcomes are misjudged, making disciplined risk management essential.
10. Crypto Ecosystem Impact: Strengthening On-Chain Financial Intelligence
This development strengthens the broader crypto ecosystem by increasing USDC transaction usage and expanding activity on the Polygon network, while also reinforcing the role of blockchain systems as infrastructure for global forecasting rather than only payments or trading.
It also bridges decentralized finance with venture capital logic, as private company expectations are now expressed through transparent, blockchain-based instruments that operate continuously without centralized control.
This transforms crypto into a global probability pricing system for innovation-driven economies.
11. Long-Term Vision: A Global Forecasting Economy
If this model continues to evolve, prediction markets could become a foundational layer of global intelligence where not only companies, but entire industries, technologies, and geopolitical outcomes are continuously priced in real time.
In such a world, platforms like Polymarket would function as distributed forecasting networks that convert human belief, information flow, and analytical reasoning into structured probability systems that reflect the collective understanding of the future.
This would represent a major shift in human financial behavior, where uncertainty itself becomes a continuously traded and globally accessible asset class.
The Birth of Continuous Future Pricing
Polymarket’s private company prediction markets represent a major evolution in financial systems because they transform private company expectations into live, tradable probability signals powered by blockchain infrastructure and institutional-grade data.
By combining global participation, transparent settlement, and real-time sentiment aggregation, the system creates a continuously updating intelligence layer that prices the future of the world’s most influential private companies.
Ultimately, this is not just a trading innovation—it is the beginning of a global forecasting economy where expectations, information, and probability merge into a single dynamic financial system that operates 24/7 across the world.
repost-content-media
  • Reward
  • Comment
  • Repost
  • Share
#PYTHUnlocks2.13BillionTokens
#PYTHUnlocks
The recent PYTH token unlock cycle, including both the 2.13 billion token unlock (confirmed allocation-based release) and the broader 3.13 billion token market interpretation scenario, represents one of the most significant liquidity expansion events in the history of Pyth Network, and it has created a powerful macro-level discussion across crypto markets regarding supply absorption, valuation stability, and long-term ecosystem strength.
This event is not just a routine vesting release but a structural redistribution of token supply that directly a
  • Reward
  • 1
  • Repost
  • Share
HighAmbition:
thank you 👍
#GateSquarePizzaDay
Bitcoin Pizza Day 2026 marks one of the most iconic anniversaries in financial history, celebrating the legendary 10,000 BTC pizza transaction that transformed Bitcoin from an experimental digital concept into a real-world medium of exchange. In 2026, with Bitcoin trading around $77,688, that same transaction is now valued at approximately $776 million+, making it one of the most expensive purchases ever recorded in human history.
1. The Original Transaction: A Turning Point in Financial History
On May 22, 2010, early Bitcoin developer Laszlo Hanyecz completed the first k
BTC-3.58%
HighAmbition
#GateSquarePizzaDay
Bitcoin Pizza Day 2026 marks one of the most iconic anniversaries in financial history, celebrating the legendary 10,000 BTC pizza transaction that transformed Bitcoin from an experimental digital concept into a real-world medium of exchange. In 2026, with Bitcoin trading around $77,688, that same transaction is now valued at approximately $776 million+, making it one of the most expensive purchases ever recorded in human history.
1. The Original Transaction: A Turning Point in Financial History
On May 22, 2010, early Bitcoin developer Laszlo Hanyecz completed the first known real-world Bitcoin purchase by paying 10,000 BTC for two pizzas. At that time, Bitcoin had almost no monetary value, extremely low liquidity, and was largely considered an experimental digital system used only by a small group of cryptography enthusiasts.
What seemed like a simple food order actually became the first proof that Bitcoin could function as a real payment system, turning theoretical digital money into practical economic utility for the first time in history.
2. Value Explosion Over Time
The most striking aspect of Bitcoin Pizza Day is the exponential increase in value over time:
2010: ~$41 total value
2013: ~$10 million+
2017: ~$190 million+
2021: ~$690 million+
2026: ~$776 million+ (BTC ≈ $77,688)
This progression highlights one of the most extreme examples of financial appreciation ever seen, driven by global adoption, institutional entry, and increasing scarcity perception.
3. Why This Event Still Matters in 2026
Bitcoin Pizza Day is not just a historical memory; it represents the moment Bitcoin proved real-world functionality. Without this transaction, Bitcoin may have remained a theoretical system rather than evolving into a global financial asset.
It demonstrated:
Bitcoin can be used for real payments
Decentralized money can function outside banks
Digital scarcity can carry real economic value
Peer-to-peer transactions are possible without intermediaries
This single event helped shape the foundation of today’s crypto economy.
4. Bitcoin 2026 Market Context
In 2026, Bitcoin operates in a completely different financial environment compared to 2010. With price stability around $77,688, Bitcoin now behaves as a macro-driven asset influenced by institutional flows, ETF activity, global liquidity conditions, and monetary policy expectations.
Key market levels:
Support: $75,000
Resistance: $80,000
Breakout zone: $85,000
Long-term target: $100,000+
Unlike early years, Bitcoin is now deeply integrated into global finance rather than existing as a niche digital experiment.
5. Institutional Era vs Early Era
The contrast between 2010 and 2026 is extreme:
2010:
Hobby mining
No institutions
No liquidity depth
No global awareness
2026:
Institutional adoption
Spot Bitcoin ETFs
Corporate treasury holdings
Sovereign-level interest
Global derivatives markets
Bitcoin has evolved from an internet experiment into a recognized global financial asset class.
6. Market Psychology Behind Pizza Day
Bitcoin Pizza Day also serves as a powerful psychological lesson for investors:
Early technologies often look insignificant
Small experiments can become global revolutions
Conviction plays a major role in long-term wealth outcomes
Real-world usage drives adoption more than theory
The emotional value of this event continues to shape investor mindset in every market cycle.
7. Gate Square Pizza Day Campaign
The #GateSquarePizzaDay campaign transforms this historical moment into a global community event, combining crypto culture, creativity, and engagement across the ecosystem.
Participants engage through:
Meme creation and storytelling
Trading reflections and market predictions
AI-generated artwork and visuals
“What if I held 10,000 BTC?” scenarios
Nostalgic crypto journey posts
The campaign runs globally from May 18–May 24, 2026, making it a full-week cultural celebration rather than a single-day event.
8. Rewards & Engagement Structure
Gate Square enhances participation through structured incentives:
Creative top contributors receive exclusive Pizza Day rewards
Selected posts earn USDT bonuses (up to 10 USDT per reward tier)
New participants may receive trading trial funds
Community engagement boosts visibility and recognition
This structure encourages both creativity and participation, strengthening community interaction.
9. Why Pizza Day Still Impacts Market Sentiment
Although Pizza Day is symbolic, it continues to influence sentiment because it highlights Bitcoin’s long-term exponential growth narrative. At $77,688 per BTC, the original transaction becomes a constant reminder of scarcity, early adoption advantage, and long-term conviction.
It reinforces key market ideas:
Long-term holding matters
Innovation compounds over time
Digital assets can reshape global wealth structures

Bitcoin Pizza Day 2026 is more than a historical celebration; it is a reflection of Bitcoin’s transformation from an experimental digital currency into a globally recognized financial asset worth trillions in market cycles. With the original 10,000 BTC transaction now valued at approximately $776 million, the event symbolizes the extreme power of early adoption and long-term conviction.
In today’s market environment, Bitcoin Pizza Day stands as both a cultural milestone and a financial lesson, reminding investors that small experiments can evolve into world-changing innovations when adoption, utility, and time converge.@Gate_Square @Gate广场_Official
repost-content-media
  • Reward
  • Comment
  • Repost
  • Share
#GateSquareMayTradingShare
Ethereum vs Solana in 2026
As of May 2026, Ethereum is trading around $2,300–$2,380, while Solana is trading around $80–$85. On the surface, this looks like a simple price gap, but in reality, it reflects two completely different stages of market maturity, capital inflow behavior, and ecosystem development. Ethereum sits in a mid-to-large cap institutional-grade valuation zone, while Solana operates in a high-beta growth expansion zone where percentage moves matter more than absolute price.
Ethereum’s valuation structure places it in a market capitalization range o
HighAmbition
#GateSquareMayTradingShare
Ethereum vs Solana in 2026
As of May 2026, Ethereum is trading around $2,300–$2,380, while Solana is trading around $80–$85. On the surface, this looks like a simple price gap, but in reality, it reflects two completely different stages of market maturity, capital inflow behavior, and ecosystem development. Ethereum sits in a mid-to-large cap institutional-grade valuation zone, while Solana operates in a high-beta growth expansion zone where percentage moves matter more than absolute price.
Ethereum’s valuation structure places it in a market capitalization range of approximately $230B–$280B, while Solana typically fluctuates around $45B–$80B depending on market cycles. This difference is critical because Ethereum behaves like a macro liquidity anchor asset, while Solana behaves like a growth multiplier asset that expands faster during bullish phases but also corrects more aggressively during risk-off conditions.
From a price structure perspective, Ethereum at $2,380 is sitting inside a major equilibrium zone. Immediate support is found around $2,300–$2,250, with stronger structural support near $2,200 and $2,000. These levels represent high liquidity accumulation zones where long-term buyers typically step in. On the upside, Ethereum faces resistance at $2,450–$2,500, followed by a stronger supply barrier at $2,600–$2,750, and a macro breakout zone beyond $3,000, which historically acts as a major psychological and technical expansion threshold.
Solana at $80–$85 shows a very different structure. Its immediate support lies around $75–$70, with deeper accumulation zones near $60–$55, which historically act as high-demand reversal regions. On the upside, Solana faces resistance at $90–$100, followed by a psychological breakout zone at $120–$130, and in strong bull cycles, expansion levels can extend toward $150–$180+, depending on liquidity conditions and ecosystem growth momentum.
Ethereum’s price movement is heavily influenced by macro liquidity cycles and institutional capital flow. When global liquidity is expanding and interest rates are stable or declining, Ethereum tends to move toward higher resistance zones like $2,600 → $2,800 → $3,000+. In contrast, when liquidity tightens or the US dollar strengthens, Ethereum often remains in consolidation between $2,200 and $2,500, reflecting reduced risk appetite.
Solana, however, reacts more aggressively to market sentiment shifts. In bullish environments, Solana can move from $80 to $100+ rapidly, and in strong momentum phases, it can extend toward $120–$150 much faster than Ethereum in percentage terms. However, during corrections, Solana can also retrace quickly toward $70, $60, or even lower liquidity zones, reflecting its higher volatility structure.
Ethereum’s dominance in DeFi is also reflected in price stability. With over $50B–$75B in DeFi TVL, Ethereum acts as the core liquidity settlement layer of decentralized finance. This deep liquidity base stabilizes price behavior even during volatility phases. Solana, with approximately $6B–$10B TVL, operates more as a high-speed trading and retail activity chain, where volume is high but capital depth is comparatively lower.
Supply dynamics further explain long-term price behavior. Ethereum has a significant portion of its supply locked in staking, often around 28–30% of total ETH supply, which reduces circulating liquidity and creates long-term upward pressure when demand increases. Solana also has high staking participation, often between 60–70% of supply, but its inflation dynamics and reward structure make it more sensitive to short-term staking flows and validator incentives.
From a trading perspective, Ethereum at $2,380 represents a compression phase between $2,200 and $2,600, where liquidity is being accumulated on both sides. This means price frequently moves between $2,300 support sweeps and $2,500 resistance tests, creating false breakouts and fake breakdowns. Traders often get trapped between these zones because the market is actively hunting liquidity before a larger directional move toward $3,000+ or lower liquidity resets near $2,000.
Solana at $80–$85 shows a similar structure but on a more volatile scale. It frequently oscillates between $70–$100 ranges, with sharp expansion phases during bullish momentum and equally sharp corrections during risk-off periods. This makes Solana more attractive for short-term traders seeking percentage gains, while Ethereum remains more stable for long-term positioning.
In terms of ecosystem growth, Ethereum continues to dominate institutional adoption, Layer-2 scaling ecosystems, DeFi infrastructure, and tokenized real-world assets, which collectively support long-term price stability in the $2,000–$4,000+ macro range over cycles. Solana, meanwhile, is rapidly expanding in consumer crypto, memecoins, NFT trading, mobile-first applications, and high-frequency on-chain activity, which drives explosive but cyclical price movements between $60–$150+ zones depending on market sentiment
Three major market scenarios define their interaction:
In a strong risk-on bull market, Solana often outperforms in percentage terms, moving from $80 → $100 → $120 → $150+, while Ethereum expands from $2,300 → $2,600 → $3,000+, but with smoother and more structured growth.
In a risk-off or macro tightening phase, Ethereum tends to hold its structure between $2,200–$2,400, while Solana may retrace more sharply toward $70–$60 zones, reflecting higher volatility sensitivity.
In a multi-cycle long-term structure, both assets coexist. Ethereum stabilizes as a $3,000–$5,000+ macro settlement asset over time, while Solana evolves as a $100–$300+ high-performance execution asset, depending on adoption cycles and liquidity expansion.
From an investment perspective, Ethereum at $2,380 represents stability, institutional trust, and long-term structural growth potential, with key upside levels beyond $3,000 and $4,000+ in future expansion cycles. Solana at $80–$85 represents high-beta growth exposure, where moves toward $100, $120, and $150+ can happen rapidly during bullish phases, but with equally sharp downside volatility toward $70 or $60 during corrections.
Ultimately, the Ethereum vs Solana dynamic in 2026 is not about one replacing the other. It is about two different price architectures:
Ethereum = $2,300–$3,000 consolidation base → $3,500–$5,000+ long-term macro potential
Solana = $60–$100 range base → $120–$200+ high volatility expansion cycles
Both are structurally important, both serve different capital flows, and both respond differently to global liquidity conditions.
Final Insight: Ethereum is the capital anchor, Solana is the growth accelerator. The market is not choosing one — it is pricing both according to their role in the next phase of blockchain expansion.
repost-content-media
  • Reward
  • Comment
  • Repost
  • Share
#BitcoinSpotVolumeNewLow
INTRODUCTION: THE QUIET SIGNAL THAT PRECEDES BIG MARKET MOVES
In May 2026, Bitcoin is displaying one of the most important yet under-discussed structural conditions in modern crypto market cycles:
While price remains relatively stable in the $78,000 to $82,500 consolidation zone, spot trading volume has dropped to multi-week lows across major exchanges.
This divergence between stable price action and declining real market participation is not just a statistical anomaly — it reflects a deeper liquidity contraction phase occurring beneath the surface of the market struc
HighAmbition
#BitcoinSpotVolumeNewLow
INTRODUCTION: THE QUIET SIGNAL THAT PRECEDES BIG MARKET MOVES
In May 2026, Bitcoin is displaying one of the most important yet under-discussed structural conditions in modern crypto market cycles:
While price remains relatively stable in the $78,000 to $82,500 consolidation zone, spot trading volume has dropped to multi-week lows across major exchanges.
This divergence between stable price action and declining real market participation is not just a statistical anomaly — it reflects a deeper liquidity contraction phase occurring beneath the surface of the market structure.
Historically, such phases rarely persist for long.
They tend to precede: Strong directional breakouts
Volatility expansion cycles
Liquidity-driven stop hunts
Institutional re-positioning phases
Macro-driven trend shifts
The critical point is not price stability — but the weakening depth of real participation supporting that price.
SPOT VOLUME DEFINITION: WHY IT MATTERS MORE THAN PRICE
Spot volume represents actual Bitcoin bought and sold without leverage. It reflects: Real buyer demand
Real seller distribution
Organic capital inflow
Genuine market participation
Unlike derivatives markets, spot markets cannot be inflated through leverage or synthetic exposure. This makes spot volume one of the purest indicators of:
“True conviction in the market”
When spot volume declines while price holds steady, it usually indicates participation fatigue or liquidity compression rather than healthy accumulation alone.
CURRENT MARKET STRUCTURE (MAY 2026)
Bitcoin Price: ~$78K – $82.5K
Spot Volume: ↓ 30%–55% below 90-day average
Volatility: Compressed
Futures Open Interest: Stable to slightly elevated
Order Book Depth: Gradually thinning on spot side
Liquidity Behavior: Increasingly passive
This environment defines what professionals often describe as:
“Low Participation Equilibrium Phase”
A state where price remains stable, but underlying market engagement weakens.
WHY SPOT VOLUME IS DECLINING (STRUCTURAL DRIVERS)
1. GLOBAL MACRO LIQUIDITY DEFENSIVE MODE
Global capital conditions remain cautious: Uncertain interest rate direction
Mixed inflation expectations
Geopolitical risk fluctuations
Uneven institutional inflows
Result: capital prefers preservation over deployment.
Spot markets feel this first due to direct capital requirement.
2. POST-RALLY SUPPLY ABSORPTION PHASE
Following previous expansion cycles: Early investors realized profits
Long-term holders slowed accumulation
Market absorbed large supply blocks
This naturally reduces turnover and spot activity.
3. DERIVATIVES-LED MARKET DOMINANCE
A structural shift continues in 2026: Futures markets dominate short-term trading
Leverage replaces spot positioning
Hedging becomes more common than accumulation
Liquidity is increasingly synthetic rather than organic
Result:
Spot exchanges show reduced activity despite active market speculation elsewhere.
4. RETAIL PARTICIPATION COOLDOWN
Retail-driven volume is weakening due to: Sideways price frustration
Lack of breakout confirmation
Fear of false moves
Reduced social momentum
This creates a natural decline in organic demand.
5. INSTITUTIONAL ACCUMULATION SHIFT (OFF-EXCHANGE FLOW)
Institutions continue participating, but differently: Execution via OTC desks
Avoidance of visible exchange order books
Algorithmic staggered accumulation
Long-duration positioning strategies
This results in: Lower visible spot volume despite ongoing accumulation pressure.
MICROSTRUCTURE ANALYSIS (ORDER BOOK DYNAMICS)
ORDER BOOK CONDITIONS
Liquidity thinning below $78K support
Heavy resistance liquidity near $82K–$83K
Reduced passive limit orders on both sides
Increased sensitivity to low-volume moves
MARKET MAKER BEHAVIOR
In low-volume environments, market makers typically: Widen spreads
Reduce liquidity provision
Exploit stop clusters
Amplify small flows into larger moves
This increases the probability of: Sharp wicks
False breakouts
Liquidity sweeps
ON-CHAIN BEHAVIOR SIGNALS (STRUCTURAL SUPPORT)
Typical accompanying on-chain conditions include: Declining exchange inflows
Rising dormant supply
Stable long-term holder conviction
Reduced retail transaction activity
Neutral funding rates
Interpretation: The market is not exiting — it is compressing into inactivity.
PRICE STRUCTURE IMPACT
Low spot volume creates a fragile equilibrium:
1. WEAK PRICE FOUNDATION
Small orders can disproportionately move price.
2. FALSE BREAKOUT ENVIRONMENT
Low liquidity allows temporary directional spikes
.
3. LIQUIDITY SWEEP CONDITIONS
Price tends to: Break below support to trap longs
Break above resistance to trap shorts
4. VOLATILITY COMPRESSION
Energy builds internally like a coiled spring.
WHY THIS PHASE MATTERS MORE THAN IT LOOKS
Historically, low participation phases often act as:
Pre-volatility expansion zones
Re-accumulation structures
Macro decision points
The market is not inactive — it is transitioning.
CATALYSTS FOR SPOT VOLUME RECOVERY
1. MACRO LIQUIDITY EXPANSION
Interest rate easing
Inflation stabilization
Risk-on sentiment return
2. INSTITUTIONAL ETF FLOW ACCELERATION
Sustained inflows
Reduced redemption pressure
Large capital allocations
3. TECHNICAL BREAKOUT CONFIRMATION
Break above $83K with strong volume
Acceptance above resistance level
Momentum participation returns
4. RETAIL RE-ENTRY CYCLE
Social engagement revival
Increased FOMO behavior
Exchange onboarding spikes
5. MARKET INFRASTRUCTURE INCENTIVES
Lower trading fees
Exchange campaigns
Regional adoption growth
TRADING STRATEGY IN LOW VOLUME CONDITIONS
1. AVOID OVER-LEVERAGE
Low liquidity increases: Slippage risk
Stop hunting probability
False move frequency
2. RANGE-BOUND STRUCTURE TRADING
Key levels: Support: $78K
Resistance: $82K–$83K
Focus on reaction-based trading.
3. DIVERGENCE MONITORING
Critical signal: Rising futures open interest + falling spot volume
= potential liquidation-driven expansion move
4. ACCUMULATION APPROACH (LONG-TERM)
Gradual entry strategy
DCA into weakness zones
Avoid emotional positioning
5. RISK MANAGEMENT PRIORITY
Wider stops required
Smaller position sizing
Avoid chasing volatility spikes
SCENARIO OUTLOOK
BULLISH EXPANSION CASE
Spot volume returns
Break above $83K
Momentum acceleration
Target: $88K – $92K
BEARISH LIQUIDITY BREAKDOWN
Continued volume decline
Break below $78K
Move toward $72K – $75K
BASE CASE (MOST LIKELY)
Extended consolidation between $75K–$83K
Low participation continues
Market waits for catalyst
FINAL STRUCTURE CONCLUSION
Bitcoin’s current environment is defined not by fear or euphoria — but by liquidity compression and participation decline.
Key insight: Price stability is masking weakening underlying engagement.
This phase represents: Institutional patience
Retail hesitation
Derivatives dominance
Spot market inactivity
Historically, such conditions do not mark the end of a trend — but rather the buildup phase before volatility expansion.
FINAL THOUGHT
The Bitcoin market in May 2026 is effectively operating in a low participation equilibrium structure.
No major breakdown is confirmed yet — but internal energy is accumulating.
The next major directional move will depend on one key factor: Return of real spot demand and liquidity expansion.
Until then, disciplined positioning and structural awareness remain the dominant edge in the market.
repost-content-media
  • Reward
  • Comment
  • Repost
  • Share
#GateSquareMayTradingShare
Ethereum vs Solana in 2026
As of May 2026, Ethereum is trading around $2,300–$2,380, while Solana is trading around $80–$85. On the surface, this looks like a simple price gap, but in reality, it reflects two completely different stages of market maturity, capital inflow behavior, and ecosystem development. Ethereum sits in a mid-to-large cap institutional-grade valuation zone, while Solana operates in a high-beta growth expansion zone where percentage moves matter more than absolute price
Ethereum’s valuation structure places it in a ma
HighAmbition
#GateSquareMayTradingShare
Ethereum vs Solana in 2026
As of May 2026, Ethereum is trading around $2,300–$2,380, while Solana is trading around $80–$85. On the surface, this looks like a simple price gap, but in reality, it reflects two completely different stages of market maturity, capital inflow behavior, and ecosystem development. Ethereum sits in a mid-to-large cap institutional-grade valuation zone, while Solana operates in a high-beta growth expansion zone where percentage moves matter more than absolute price
Ethereum’s valuation structure places it in a market capitalization range of approximately $230B–$280B, while Solana typically fluctuates around $45B–$80B depending on market cycles. This difference is critical because Ethereum behaves like a macro liquidity anchor asset, while Solana behaves like a growth multiplier asset that expands faster during bullish phases but also corrects more aggressively during risk-off conditions
From a price structure perspective, Ethereum at $2,380 is sitting inside a major equilibrium zone. Immediate support is found around $2,300–$2,250, with stronger structural support near $2,200 and $2,000. These levels represent high liquidity accumulation zones where long-term buyers typically step in. On the upside, Ethereum faces resistance at $2,450–$2,500, followed by a stronger supply barrier at $2,600–$2,750, and a macro breakout zone beyond $3,000, which historically acts as a major psychological and technical expansion threshold
Solana at $80–$85 shows a very different structure. Its immediate support lies around $75–$70, with deeper accumulation zones near $60–$55, which historically act as high-demand reversal regions. On the upside, Solana faces resistance at $90–$100, followed by a psychological breakout zone at $120–$130, and in strong bull cycles, expansion levels can extend toward $150–$180+, depending on liquidity conditions and ecosystem growth momentum
Ethereum’s price movement is heavily influenced by macro liquidity cycles and institutional capital flow. When global liquidity is expanding and interest rates are stable or declining, Ethereum tends to move toward higher resistance zones like $2,600 → $2,800 → $3,000+. In contrast, when liquidity tightens or the US dollar strengthens, Ethereum often remains in consolidation between $2,200 and $2,500, reflecting reduced risk appetite
Solana, however, reacts more aggressively to market sentiment shifts. In bullish environments, Solana can move from $80 to $100+ rapidly, and in strong momentum phases, it can extend toward $120–$150 much faster than Ethereum in percentage terms. However, during corrections, Solana can also retrace quickly toward $70, $60, or even lower liquidity zones, reflecting its higher volatility structure
Ethereum’s dominance in DeFi is also reflected in price stability. With over $50B–$75B in DeFi TVL, Ethereum acts as the core liquidity settlement layer of decentralized finance. This deep liquidity base stabilizes price behavior even during volatility phases. Solana, with approximately $6B–$10B TVL, operates more as a high-speed trading and retail activity chain, where volume is high but capital depth is comparatively lower
Supply dynamics further explain long-term price behavior. Ethereum has a significant portion of its supply locked in staking, often around 28–30% of total ETH supply, which reduces circulating liquidity and creates long-term upward pressure when demand increases. Solana also has high staking participation, often between 60–70% of supply, but its inflation dynamics and reward structure make it more sensitive to short-term staking flows and validator incentives
From a trading perspective, Ethereum at $2,380 represents a compression phase between $2,200 and $2,600, where liquidity is being accumulated on both sides. This means price frequently moves between $2,300 support sweeps and $2,500 resistance tests, creating false breakouts and fake breakdowns. Traders often get trapped between these zones because the market is actively hunting liquidity before a larger directional move toward $3,000+ or lower liquidity resets near $2,000
Solana at $80–$85 shows a similar structure but on a more volatile scale. It frequently oscillates between $70–$100 ranges, with sharp expansion phases during bullish momentum and equally sharp corrections during risk-off periods. This makes Solana more attractive for short-term traders seeking percentage gains, while Ethereum remains more stable for long-term positioning
In terms of ecosystem growth, Ethereum continues to dominate institutional adoption, Layer-2 scaling ecosystems, DeFi infrastructure, and tokenized real-world assets, which collectively support long-term price stability in the $2,000–$4,000+ macro range over cycles. Solana, meanwhile, is rapidly expanding in consumer crypto, memecoins, NFT trading, mobile-first applications, and high-frequency on-chain activity, which drives explosive but cyclical price movements between $60–$150+ zones depending on market sentiment
Three major market scenarios define their interaction:
In a strong risk-on bull market, Solana often outperforms in percentage terms, moving from $80 → $100 → $120 → $150+, while Ethereum expands from $2,300 → $2,600 → $3,000+, but with smoother and more structured growth.
In a risk-off or macro tightening phase, Ethereum tends to hold its structure between $2,200–$2,400, while Solana may retrace more sharply toward $70–$60 zones, reflecting higher volatility sensitivity
In a multi-cycle long-term structure, both assets coexist. Ethereum stabilizes as a $3,000–$5,000+ macro settlement asset over time, while Solana evolves as a $100–$300+ high-performance execution asset, depending on adoption cycles and liquidity expansion
From an investment perspective, Ethereum at $2,380 represents stability, institutional trust,
and long-term structural growth potential, with key upside levels beyond $3,000 and $4,000+ in future expansion cycles. Solana at $80–$85 represents high-beta growth exposure, where moves toward $100, $120, and $150+ can happen rapidly during bullish phases, but with equally sharp downside volatility toward $70 or $60 during corrections
Ultimately, the Ethereum vs Solana dynamic in 2026 is not about one replacing the other. It is about two different price architectures:
Ethereum = $2,300–$3,000 consolidation base → $3,500–$5,000+ long-term macro potential
Solana = $60–$100 range base → $120–$200+ high volatility expansion cycles
Both are structurally important, both serve different capital flows, and both respond differently to global liquidity conditions
Final Insight: Ethereum is the capital anchor, Solana is the growth accelerator. The market is not choosing one — it is pricing both according to their role in the next phase of blockchain expansion.
repost-content-media
  • Reward
  • Comment
  • Repost
  • Share
#PolymarketHundredUWarGodChallenge .
How I Predict Market Moves Using CPI / Fed / Macro Events on Polymarket
#PolymarketHundredUWarGodChallenge
Introduction: Why Macro Events Control Crypto Markets
In modern financial markets, especially crypto, price movements are not random. They are heavily influenced by macro-economic events, global liquidity conditions, and institutional expectations.
Platforms like Polymarket allow traders to convert these expectations into predictive positions, making macro analysis extremely powerful.
My approach focuses on three major drivers:
CPI (Consumer Price In
HighAmbition
#PolymarketHundredUWarGodChallenge .
How I Predict Market Moves Using CPI / Fed / Macro Events on Polymarket
#PolymarketHundredUWarGodChallenge
Introduction: Why Macro Events Control Crypto Markets
In modern financial markets, especially crypto, price movements are not random. They are heavily influenced by macro-economic events, global liquidity conditions, and institutional expectations.
Platforms like Polymarket allow traders to convert these expectations into predictive positions, making macro analysis extremely powerful.
My approach focuses on three major drivers:
CPI (Consumer Price Index) data releases
Federal Reserve (Fed) interest rate decisions
Broader macroeconomic sentiment (liquidity, risk appetite, dollar strength)
By combining these factors, I build short-term probability-based predictions for BTC and ETH movements.
CPI Data Impact on BTC & ETH Markets
CPI measures inflation. It directly influences risk asset pricing, including cryptocurrencies.
When CPI is HIGH (Inflation above expectations):
Market expects tighter monetary policy
Fed increases interest rate pressure
USD strength increases
Risk assets like BTC/ETH face selling pressure
Market behavior:
Short-term bearish volatility
Liquidations increase
Traders reduce exposure to risk
When CPI is LOW (Inflation cooling):
Market expects policy easing
Liquidity expectations increase
Risk appetite returns
Market behavior:
BTC and ETH often rally
Capital flows into crypto markets
Momentum trading increases
My Prediction Logic on Polymarket:
I treat CPI outcomes as binary probability events:
CPI > forecast = bearish probability increases (60–75%)
CPI < forecast = bullish probability increases (55–70%)
Instead of guessing direction, I assign probability weight to each outcome.
Fed Decisions and Market Reaction Dynamics
The Federal Reserve is the most powerful driver of crypto market direction.
Key Fed Factors I Track:
Interest rate decisions
FOMC statements
Powell speeches
Forward guidance (future expectations)
Hawkish Fed (Rate hikes / strict tone):
Liquidity tightens
USD strengthens
Crypto volatility increases downward
BTC/ETH behavior:
Sharp corrections
Fake breakouts followed by dumps
Lower risk appetite
Dovish Fed (Rate cuts / soft tone):
Liquidity increases
Risk assets become attractive
Institutional inflows rise
BTC/ETH behavior:
Strong bullish breakouts
Trend continuation rallies
Higher market confidence
My Fed-Based Prediction Strategy
On Polymarket, I don’t trade emotion. I trade probability shifts before the event.
My method:
Analyze market expectation (FedWatch tools, sentiment)
Compare expected vs actual scenario
Assign probability:
Hawkish surprise: 65% bearish impact
Neutral: 50/50 volatility zone
Dovish surprise: 70% bullish impact
This allows me to position before volatility expansion.
Short-Term BTC & ETH Prediction Framework
For short-term trading (1–7 days), I combine:
1. Market Structure
Support & resistance zones
Liquidity pools
Breakout or rejection patterns
2. Macro Catalyst Timing
CPI release dates
Fed speeches
Economic reports
3. Sentiment Condition
Fear vs greed index
Funding rates
Open interest spikes
Example Scenario:
If BTC is trading near $81,000:
CPI coming in 24–48 hours
Market uncertainty high
Liquidity low
Possible outcomes:
Bullish scenario (55%)
CPI comes below expectations
BTC breaks resistance → $84K–$88K
Bearish scenario (45%)
CPI higher than expected
BTC retests $78K–$75K zone
Instead of guessing, I prepare for both directions with weighted probability.
Polymarket Strategy: How I Use Prediction Markets
Polymarket is not gambling if used correctly. It is a probability pricing system.
My approach:
I treat each event as a binary probability trade
I enter positions when market odds are mispriced
I exit when probability aligns with reality
Key Principle:
“The goal is not to be right. The goal is to be early where probability is mispriced.”
Risk Management Framework
Even with strong macro analysis, risk control is essential.
My rules:
Never risk more than 5–10% on a single prediction
Diversify across multiple macro outcomes
Hedge opposite scenarios when uncertainty is high
Avoid over-leverage during CPI/Fed events
Execution Strategy (Polymarket Workflow)
Identify upcoming macro event (CPI/Fed)
Analyze market expectation vs reality gap
Assign probability weights (bullish/bearish/neutral)
Enter position on Polymarket based on mispricing
Exit when event resolves or probability corrects
Final Outlook: Why This Strategy Works
Crypto markets are not driven by charts alone. They are driven by:
Liquidity cycles
Macro economic decisions
Institutional positioning
Market psychology
By combining CPI, Fed policy, and sentiment analysis, I build a structured prediction model that aligns with real-world market behavior.
Polymarket simply converts this analysis into tradable probability outcomes.
Conclusion
Macro events like CPI and Fed decisions are the backbone of crypto volatility. Traders who understand these drivers gain a significant edge over purely technical traders.
My prediction approach is based on:
Probability modeling
Macro event analysis
Structured risk management
Sentiment evaluation
This is how I interpret and trade market moves on Polymarket.
repost-content-media
  • Reward
  • Comment
  • Repost
  • Share
#WCTCTradingKingPK
WCTC S8 Trading Strategy Expansion
Most traders reach a certain level where they understand basic concepts like support and resistance, trendlines, and simple indicators, but they still struggle to achieve consistency because they fail to understand that in the current market environment, execution quality matters far more than knowledge, and the real difference between profitable traders and struggling traders is not what they know but how patiently and accurately they apply it in live conditions where emotions, volatility, and uncertainty are constantly testing their dec
HighAmbition
#WCTCTradingKingPK
WCTC S8 Trading Strategy Expansion
Most traders reach a certain level where they understand basic concepts like support and resistance, trendlines, and simple indicators, but they still struggle to achieve consistency because they fail to understand that in the current market environment, execution quality matters far more than knowledge, and the real difference between profitable traders and struggling traders is not what they know but how patiently and accurately they apply it in live conditions where emotions, volatility, and uncertainty are constantly testing their decisions.
Entry confirmation is one of the most ignored yet powerful aspects of trading, because many traders believe that once price reaches a key level such as support or resistance, it is enough to take a position, whereas in reality, that approach turns trading into guessing, and a more refined method is to wait for clear confirmation signals such as strong rejection wicks indicating liquidity grab, a shift in lower timeframe structure showing a potential reversal, or a sudden increase in volume at a critical zone, because these factors collectively increase the probability that the level will actually hold rather than break.
Another major improvement in trading accuracy comes from multi-timeframe analysis, where instead of relying on a single chart, a trader aligns higher timeframe direction with mid timeframe structure and then refines entries on lower timeframes, because when the daily or four-hour trend supports the direction, the one-hour chart provides structural clarity, and the five to fifteen minute chart offers precise entry timing, the trade becomes significantly stronger, whereas ignoring this alignment often leads to confusion and conflicting signals.
Timing also plays a critical role, yet it is often underestimated, because markets behave very differently depending on the session, and high liquidity periods such as the London and New York opens tend to produce cleaner and more decisive moves, while low volume hours often result in slow, choppy, and deceptive price action that traps impatient traders, so focusing on the right timing alone can dramatically improve both win rate and confidence.
When it comes to breakout trading, the common mistake most traders make is entering immediately when price breaks a level, assuming momentum will continue, but in many cases, these breakouts are designed to trap traders and capture liquidity, so a more disciplined approach is to wait for the breakout to occur, observe whether price can hold above or below the level, and then enter on a confirmed retest, because this reduces false entries and aligns the trade with stronger market intent.
Risk-to-reward ratio is another fundamental pillar that separates professional thinking from amateur behavior, because instead of focusing only on how often they win, experienced traders focus on how much they gain when they are right compared to how much they lose when they are wrong, ensuring that even with a moderate win rate, a minimum of one-to-two or ideally one-to-three risk-to-reward ratio allows overall profitability to remain positive over time.
Position sizing is a subtle but powerful tool that many traders ignore, as they tend to risk the same amount on every trade regardless of setup quality, whereas a smarter approach is to adjust position size based on confidence, reducing exposure in uncertain conditions and slightly increasing it when multiple confluences align, which helps in maintaining balance between aggression and protection.
There are also phases in the market where the best decision is to reduce activity, because when price becomes highly unpredictable or lacks clear direction, switching into a capital preservation mode by lowering risk, reducing frequency, and even staying out of trades entirely can protect both capital and mental clarity, as not trading during bad conditions is often more profitable than forcing trades.
Journaling is one of the most overlooked habits among traders, yet it is one of the most effective ways to improve, because by consistently reviewing entries, exits, reasoning, and emotional state, a trader begins to identify repeating mistakes and patterns in behavior, which over time leads to better decision-making and stronger discipline.
At the same time, over-complicating strategies by adding too many indicators or constantly changing systems creates confusion rather than clarity, so maintaining a simple framework based on structure, liquidity, and confirmation allows for better focus and faster decision-making without unnecessary noise.
Many traders continue to struggle because they repeatedly make the same advanced mistakes such as entering without confirmation, trading during every session regardless of conditions, ignoring macroeconomic influences, risking too much on single positions, and frequently switching strategies after short-term losses, which prevents them from building consistency.
A refined execution model requires a clear step-by-step process where the trader first identifies the overall market structure, then marks key liquidity zones, patiently waits for price to approach those areas, looks for confirmation signals before entering, manages risk carefully during the trade, and exits based on predefined plans rather than emotional reactions, because this structured approach removes randomness from decision-making.
One of the most important mindset shifts that transforms trading performance is moving away from the need to predict whether a trade will win and instead focusing on whether the trade meets all the conditions of a tested system, because this removes emotional pressure and allows the trader to operate with discipline and confidence regardless of individual outcomes.
In the end, the reality of this market is that basic knowledge is widely available and easily understood by most participants, but disciplined execution, patience, and emotional control remain rare, and traders who focus on these core principles rather than constantly searching for new tools or shortcuts are the ones who gradually achieve consistency and long-term profitability.
👉 #WCTC交易王PK
Serious traders should share their approach, because real growth comes from exchanging structured ideas rather than chasing random signals.#GateSquareMayTradingShare #CreatorCarnival #ContentMining
repost-content-media
  • Reward
  • 1
  • Repost
  • Share
HighAmbition:
Just charge forward 👊
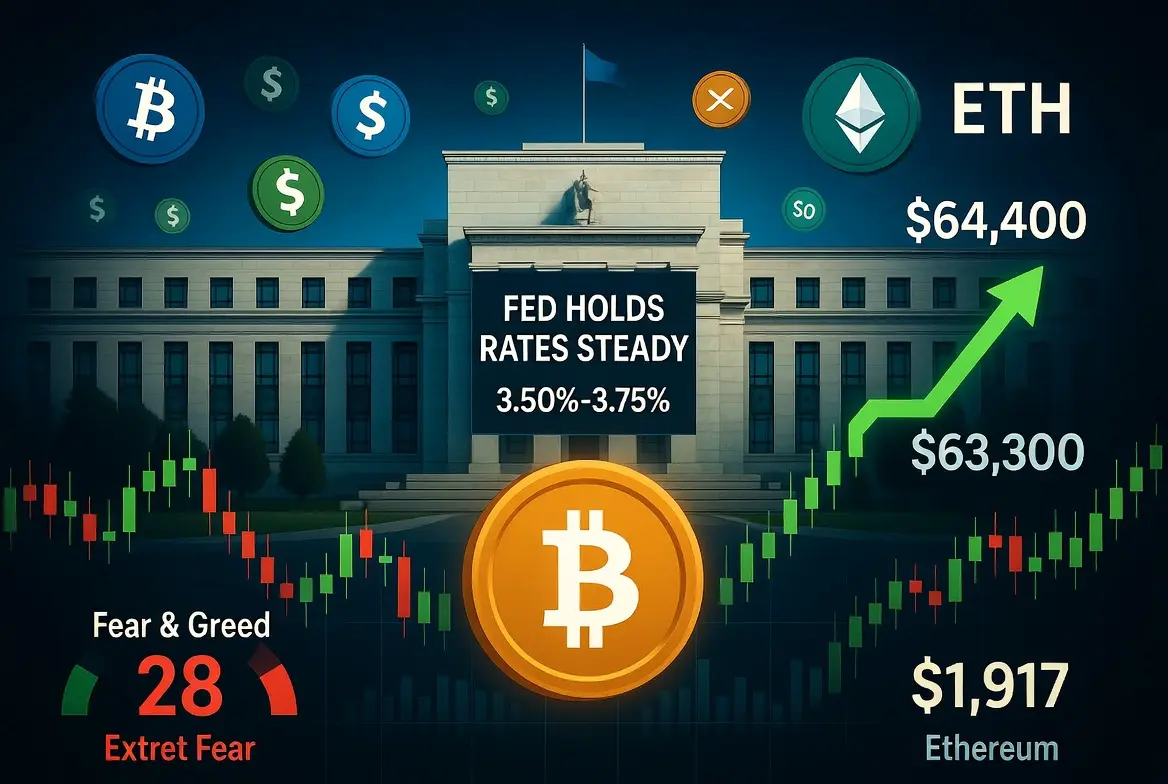
##FedHoldsRateButDividesDeepen
Final Combined Macro Breakdown
The Federal Reserve’s decision on April 29, 2026 to hold interest rates steady at 3.50%–3.75% while producing the most divided FOMC vote since 1992 (reported 8–4 split with strong dissents) has created one of the most uncertain macro environments in recent cycles. Although headline policy remains unchanged, internal fragmentation between hawkish members, dovish voices, and a cautious majority signals deep disagreement on the future path of monetary policy, generating a “policy uncertainty premium” that markets must continuously p
BTC-3.58%
HighAmbition
##FedHoldsRateButDividesDeepen
Final Combined Macro Breakdown
The Federal Reserve’s decision on April 29, 2026 to hold interest rates steady at 3.50%–3.75% while producing the most divided FOMC vote since 1992 (reported 8–4 split with strong dissents) has created one of the most uncertain macro environments in recent cycles. Although headline policy remains unchanged, internal fragmentation between hawkish members, dovish voices, and a cautious majority signals deep disagreement on the future path of monetary policy, generating a “policy uncertainty premium” that markets must continuously price in.
This uncertainty is critical for Bitcoin because it directly affects global liquidity expectations, dollar strength, and risk appetite. Bitcoin is no longer reacting only to crypto-specific developments but is increasingly functioning as a macro liquidity-sensitive asset where Federal Reserve communication, Treasury yields, and inflation expectations dominate short-term price behavior.
As of now, Bitcoin is trading around the $79,800 to $80,300 range after briefly touching $80,500–$80,700, showing a 24-hour gain of approximately +1.5% to +2.5%, while recovering roughly +14% to +18% from earlier consolidation below $70K. This confirms a shift from recovery phase into a macro-sensitive consolidation zone above the critical $80K level.
However, this move is occurring under very thin liquidity conditions, with spot volumes falling below $8–10 billion daily on major exchanges, one of the lowest participation levels since late 2023. This makes the market highly sensitive to institutional flows, macro headlines, and derivatives-driven positioning.
At the same time, derivatives markets are dominating price discovery, with rising open interest, fluctuating funding rates, and heavy options positioning. Institutions are not primarily accumulating spot BTC but are hedging macro uncertainty, creating a layered structure where gamma hedging and liquidation flows amplify price movements.
Recent breakout activity above $80K was driven by concentrated bursts of taker buy volume, where billions in notional exposure were executed in short timeframes, showing event-driven institutional participation rather than steady organic demand. This confirms that Fed expectations are now directly shaping Bitcoin’s intraday volatility.
From a liquidity perspective, Bitcoin is in a critical equilibrium zone between $78,000 and $80,500. The $80,000 level has become a psychological pivot, $78,000–$79,000 acts as strong support, and $82,000–$85,000 remains the next major liquidity cluster where profit-taking and hedging pressure is expected.
If momentum continues and macro conditions stabilize or turn dovish, Bitcoin could extend toward $88,000–$90,000, with potential upside toward $95,000–$100,000+ in a liquidity expansion scenario. However, if uncertainty persists or sentiment weakens, price could revisit $76,500–$77,000 or deeper zones near $70,000–$68,000.
Although nominal rates remain unchanged, real financial conditions are effectively tightening due to persistent inflation (~3.3%), labor market softness (~4.3% unemployment), and geopolitical energy pressures. This means liquidity is less supportive than the headline rate suggests, directly impacting risk assets like Bitcoin.
The Fed’s internal division increases uncertainty about future policy direction, forcing markets to price multiple scenarios simultaneously: delayed cuts, prolonged higher-for-longer policy, or future easing if economic weakness intensifies. This scenario complexity increases volatility while reducing directional conviction among institutional investors.
The bullish interpretation is that holding rates avoids immediate liquidity contraction while increasing the probability of future easing, which supports Bitcoin as a hedge against monetary instability and fiat debasement.
The bearish interpretation is that policy uncertainty delays capital deployment, leading institutions to reduce spot accumulation and rely more on hedging strategies, resulting in sideways consolidation and sharp correction risk during macro shocks.
Globally, this uncertainty impacts equities, commodities, and emerging markets, but Bitcoin often acts as both a risk asset and alternative store of value, depending on liquidity conditions and dollar sentiment.
From a derivatives structure perspective, rising open interest and unstable funding rates indicate frequent repositioning rather than long-term conviction. Options gamma exposure further increases the probability of sharp, fast moves in both directions when key levels break or fail.
Technically, Bitcoin remains supported above $78,000, but sustained continuation above $80,000 is required for a move toward $82,000–$85,000, while failure could trigger liquidity-driven pullbacks.
In conclusion, the current phase represents a macro-embedded Bitcoin market where Federal Reserve divergence, liquidity uncertainty, and institutional hedging flows dominate price action. The market is not trending cleanly but constantly recalibrating between competing macro narratives, making volatility, liquidity awareness, and patience the key drivers of performance in this environment.#GateSquareMayTradingShare #CreatorCarnival #ContentMining
repost-content-media
  • Reward
  • 1
  • Repost
  • Share
HighAmbition:
Just charge forward 👊
#DeFiLossesTop600MInApril
DeFi Losses Top $600M in April
April became one of the most damaging months in DeFi history, recording 28 separate exploits totaling $635.2M, the highest monthly incident count ever seen in decentralized finance. Unlike previous cycles dominated by small smart contract bugs, this phase showed a structural evolution where attacks shifted toward infrastructure-level manipulation, cross-chain exploits, and social engineering campaigns, creating systemic rather than isolated damage across the ecosystem.
A major portion of losses was driven by extreme single-event failu
DRIFT-11.21%
RHEA-17.62%
AAVE-5.78%
HighAmbition
#DeFiLossesTop600MInApril
DeFi Losses Top $600M in April
April became one of the most damaging months in DeFi history, recording 28 separate exploits totaling $635.2M, the highest monthly incident count ever seen in decentralized finance. Unlike previous cycles dominated by small smart contract bugs, this phase showed a structural evolution where attacks shifted toward infrastructure-level manipulation, cross-chain exploits, and social engineering campaigns, creating systemic rather than isolated damage across the ecosystem.
A major portion of losses was driven by extreme single-event failures, including Drift Protocol losing $285M through a 12-minute drain linked to long-term social engineering and zero-timelock admin takeover, and KelpDAO losing $293M via forged cross-chain messages exploiting LayerZero verifier weaknesses and poisoned RPC infrastructure. Alongside these, more than 20 additional incidents affected protocols like Rhea Finance ($18.4M), Grinex ($15M), Wasabi ($5.5M), and Aftermath ($1.14M), showing that vulnerability was widespread across multiple layers of DeFi.
One of the most critical macro impacts was the $13.2B DeFi TVL wipeout within 48 hours, with Aave alone losing approximately $8.45B in deposits, triggering forced liquidity exits and cascading risk reduction across lending markets. During peak stress, $355M in liquidations occurred within a single hour, highlighting how quickly DeFi leverage can unwind in fragile conditions.
Investigations linked approximately $577M (around 91% of April losses) to the Lazarus Group, marking a major escalation in state-linked cyber activity. This also pushed DPRK-attributed cumulative crypto theft estimates to around $6.75B, reinforcing concerns that DeFi is now a geopolitical attack surface, not just a financial experiment.
The nature of attacks has fundamentally changed. Instead of simple coding bugs, the dominant threat vector is now multi-layer infrastructure manipulation, oracle poisoning, flash loan coordination, and social engineering campaigns targeting governance and admin access, meaning attackers are behaving more like structured financial actors than random hackers.
This shift has also triggered a defensive response from the ecosystem. A “DeFi United” rescue coalition began forming with over $300M in emergency recovery capital, including Aave DAO committing 25,000 ETH, while institutions like Standard Chartered described the event as an “antifragile moment,” suggesting that stress is forcing long-term structural strengthening despite short-term damage.
Market impact was immediate and severe. AAVE traded in the $90–$95 range under extreme volatility, while Ethereum and Solana experienced sharp intraday drawdowns linked to liquidity withdrawal and risk-off sentiment. The broader ecosystem saw DeFi TVL contract by 6%–11% month-over-month, while high-risk chains experienced up to 15% liquidity exits, especially in synthetic stablecoin and yield farming protocols.
This liquidity shock was amplified by a cascading mechanism: exploit drains liquidity → LP withdrawals accelerate → stablecoin peg pressure increases → borrowing positions liquidate → collateral prices fall → cross-protocol contagion spreads. This is why relatively small initial exploits often resulted in $50M–$100M+ total ecosystem damage.
In parallel, crypto market conditions were already unstable. Bitcoin fluctuated between $68,000 and $80,000 (+14%–18% recovery range), Ethereum moved between $2,200 and $2,360 (+4%–6%), and altcoins experienced -8% to -25% drawdowns, especially in DeFi-linked tokens. This meant that exploit-driven shocks hit an already fragile liquidity environment.
Institutionally, reactions were defensive but strategic. Capital rotated away from unaudited DeFi protocols into BTC and ETH ETF exposure, custody-secured products, and regulated yield strategies, while hedge desks increased protection against smart contract risk. This reinforced Bitcoin’s role as a macro hedge asset compared to DeFi’s high-risk yield environment.
Several structural reasons explain why April was particularly severe: AI-driven exploit scanning tools improved attacker efficiency, rapid unaudited protocol deployment increased attack surface, yield farming incentives encouraged leverage, and fragmented liquidity across Ethereum, Arbitrum, BSC, and Solana made cross-chain exploitation easier. Additionally, outdated oracle systems and weak bridge validation frameworks remained common failure points.
On a strategic level, the ecosystem is now transitioning toward stronger security frameworks including AI-based auditing systems, real-time exploit detection, cross-chain insurance layers, decentralized oracle strengthening, and institutional-grade compliance infrastructure. If implemented successfully, analysts expect 30%–50% reduction in future exploit losses, though short-term volatility remains elevated.
Trader sentiment also shifted sharply. Retail participation in DeFi farming declined due to increased fear of smart contract risk, while opportunistic traders focused on volatility-driven short-term strategies and rotated into BTC/ETH exposure during panic events.
In conclusion, the $600M+ DeFi losses in April represent not just a wave of hacks but a structural stress test of decentralized finance, where infrastructure weaknesses, evolving attack sophistication, and fragile liquidity conditions collided simultaneously. While DeFi is not collapsing, it is clearly undergoing a forced evolution under pressure, and until security and liquidity systems mature, the sector will remain highly volatile, exploit-sensitive, and capital defensive — where preservation matters more than yield.
repost-content-media
  • Reward
  • 1
  • Repost
  • Share
HighAmbition:
Just charge forward 👊
#DailyPolymarketHotspot
BTC $80K+ $90K+ $100K+ Probability Outlook
Bitcoin is currently trading in the $79,800–$80,300 region, and the market structure has clearly shifted into a Polymarket-style probability pricing system, where price is no longer behaving like a simple trend or technical setup. Instead, it is constantly repricing the likelihood of different future outcomes based on liquidity conditions, macro expectations, ETF inflows, derivatives positioning, and institutional sentiment.
In this environment, $80K, $90K, and $100K are not just price targets — they are competing probability
BTC-3.58%
HighAmbition
#DailyPolymarketHotspot
BTC $80K+ $90K+ $100K+ Probability Outlook
Bitcoin is currently trading in the $79,800–$80,300 region, and the market structure has clearly shifted into a Polymarket-style probability pricing system, where price is no longer behaving like a simple trend or technical setup. Instead, it is constantly repricing the likelihood of different future outcomes based on liquidity conditions, macro expectations, ETF inflows, derivatives positioning, and institutional sentiment.
In this environment, $80K, $90K, and $100K are not just price targets — they are competing probability outcomes that are continuously updated in real time, similar to prediction market hotspots where capital flows determine which scenario is becoming more likely.
At the $80K level, Bitcoin has formed a base equilibrium zone, where the market is balancing between buyers and sellers. This level is no longer acting as resistance but as a liquidity-supported foundation. The probability of BTC holding above $80K in the short term is currently around 70%–80%, supported by ETF inflows, institutional accumulation, and relatively thin spot supply. However, downside risk toward $78K–$77K still exists with a 20%–30% probability, especially if macro liquidity tightens or forced deleveraging occurs.
Moving higher, the $90K zone represents a momentum expansion probability layer, where continuation depends on clearing liquidity clusters around $82K–$85K. Once that zone is broken and held, probability of reaching $90K increases significantly. Current estimates place this at 45%–60% medium-term probability, with potential expansion toward 65%+ if ETF demand remains strong and macro conditions stay supportive. This zone is also expected to produce sharp reactions, consolidation phases, and profit-taking volatility.
The $100K level is a macro-cycle probability event, not just a technical target. It depends on global liquidity expansion, Fed policy direction, ETF accumulation trends, and Bitcoin’s growing role as a macro hedge asset. The probability of BTC reaching $100K currently sits around 25%–40%, but can rise toward 50%+ in a strong liquidity expansion scenario. This is the lowest probability but highest impact outcome in the current structure.
From a liquidity perspective, the market is highly sensitive because spot volume remains relatively thin while derivatives and ETF flows dominate price discovery. This means even small capital shifts can rapidly reprice probabilities between $80K, $90K, and $100K scenarios. Rising open interest and unstable funding rates confirm that positioning is reactive, not stable.
Volatility behaves differently across these zones:
• $80K = stability + consolidation probability zone
• $82K–$85K = breakout acceleration zone
• $90K = reaction + profit-taking cluster
• $100K = macro-driven exponential repricing zone
Institutionally, Bitcoin is increasingly treated as a macro hedge rather than a speculative asset, while retail traders often react emotionally to these probability shifts, amplifying volatility.
In conclusion, Bitcoin is no longer just moving in trends — it is functioning like a live Polymarket-style probability engine, where price is the output of constantly shifting expectations between $80K stability, $90K momentum expansion, and $100K macro breakout scenarios.
👉 The next major move will depend on which probability gains dominance first in this live hotspot structure.#GateSquareMayTradingShare #CreatorCarnival #ContentMining
repost-content-media
  • Reward
  • 1
  • Repost
  • Share
HighAmbition:
Just charge forward 👊
#BitcoinETFOptionLimitQuadruples
The quadrupling of Bitcoin ETF option limits represents a major structural change in Bitcoin’s financial market evolution, as it significantly impacts how institutional capital interacts with BTC, how liquidity is formed, and how price discovery functions in a system increasingly driven by regulated derivatives instead of only spot trading. This reflects a shift from a retail-focused speculative asset toward a more institutional and globally integrated financial instrument where ETFs, options, hedging activity, and macro positioning collectively influence mark
BTC-3.58%
HighAmbition
#BitcoinETFOptionLimitQuadruples
The quadrupling of Bitcoin ETF option limits represents a major structural change in Bitcoin’s financial market evolution, as it significantly impacts how institutional capital interacts with BTC, how liquidity is formed, and how price discovery functions in a system increasingly driven by regulated derivatives instead of only spot trading. This reflects a shift from a retail-focused speculative asset toward a more institutional and globally integrated financial instrument where ETFs, options, hedging activity, and macro positioning collectively influence market direction.
When Bitcoin ETF options were introduced in late 2024, position limits were set at around 25,000 contracts to maintain controlled risk exposure. However, institutional demand for Bitcoin exposure through regulated products grew much faster than expected. Hedge funds, asset managers, and market makers increasingly adopted ETF options as a preferred method for exposure and risk management, which created constraints under the original limits.
Due to this rising demand, limits were later increased to 250,000 contracts, and the market is now moving toward a potential expansion near 1 million contracts. This reflects a significant increase in institutional participation capacity and shows that Bitcoin is being integrated into the same category as major traditional ETFs, where large-scale derivatives activity is standard.
This expansion directly affects Bitcoin price behavior, especially around the $80,000 level. At this stage, BTC is influenced not only by spot buying and selling but also by ETF flows, options positioning, volatility expectations, and macro sentiment. As a result, price movement is increasingly shaped by derivatives-driven liquidity rather than only retail participation.
Currently, Bitcoin trades in the $79,800 to $80,500 range, with daily fluctuations of around +1.5% to +2.5%. The $80,000 level has evolved into a structural equilibrium zone, acting as both support and a liquidity pivot where institutional activity is concentrated.
One key effect of expanding ETF option limits is the growth in open interest capacity in derivatives markets. Larger positions increase liquidity depth but also raise volatility potential, as market makers must continuously hedge exposure. These hedging flows directly influence spot Bitcoin price, making derivatives markets an active driver of price discovery.
This creates a feedback loop where price changes affect hedging activity, hedging impacts liquidity, and liquidity further influences price behavior. As a result, Bitcoin behaves less like a simple supply-demand asset and more like a dynamic system influenced by positioning and volatility expectations.
From a liquidity perspective, spot trading volume remains moderate, while derivatives and ETF-related flows dominate market activity. This makes Bitcoin more sensitive to changes in positioning and macro conditions.
Key liquidity zones include:
$78,000–$79,000 as short-term support
$80,000–$80,500 as equilibrium range
$82,000–$85,000 as resistance and liquidity expansion zone
$88,000–$90,000 as extended continuation targets
The bullish side of ETF option expansion is improved market efficiency, deeper liquidity, and stronger institutional participation. It enables advanced strategies such as hedging, volatility trading, and arbitrage, strengthening Bitcoin’s integration into global financial systems.
However, it also increases short-term volatility because larger derivative positions require continuous hedging adjustments, which can create sharper price movements and faster reversals.
Major exchanges have gradually aligned Bitcoin ETF options with traditional ETF frameworks, marking a key step in institutional acceptance of Bitcoin as a regulated asset class.
In conclusion, the expansion of Bitcoin ETF option limits is a major milestone in market structure evolution. It strengthens institutional involvement and liquidity but also increases complexity in price behavior. Bitcoin’s movement around $80,000 is now shaped by the interaction of ETF flows, derivatives positioning, and macro liquidity conditions rather than only spot market demand.
repost-content-media
  • Reward
  • 1
  • Repost
  • Share
HighAmbition:
Just charge forward 👊
#TapAndPayWithGateCard
The Tap and Pay feature with Gate Card represents a major evolution in the real-world use of cryptocurrency, because it directly connects digital assets with everyday spending in a simple, fast, and practical way. Instead of crypto being limited to trading, investing, or holding, this system transforms it into a usable payment method that works in real-world environments just like traditional debit or credit cards. This shift is important because true adoption of crypto depends not only on price growth or market activity, but on how easily people can actually use it in
BTC-3.58%
HighAmbition
#TapAndPayWithGateCard
The Tap and Pay feature with Gate Card represents a major evolution in the real-world use of cryptocurrency, because it directly connects digital assets with everyday spending in a simple, fast, and practical way. Instead of crypto being limited to trading, investing, or holding, this system transforms it into a usable payment method that works in real-world environments just like traditional debit or credit cards. This shift is important because true adoption of crypto depends not only on price growth or market activity, but on how easily people can actually use it in daily life.
At its core, Gate Card acts as a bridge between crypto wallets and global payment networks. Users can store supported assets such as Bitcoin, stablecoins, or other cryptocurrencies in their account, and then spend them instantly at any NFC-enabled payment terminal. When a transaction is made, the system automatically converts the required crypto amount into fiat currency at the exact moment of payment. This removes the need for manual conversion, exchange transfers, or complicated steps before spending, making the entire process smooth and user-friendly.
One of the strongest advantages of this system is instant real-world usability. In traditional crypto usage, users often need to transfer funds to an exchange, convert them, and then withdraw fiat before spending. This creates delays and friction. Tap and Pay removes all of that, allowing users to simply tap their card and complete payment within seconds. This makes crypto usable in real-life situations such as shopping malls, restaurants, transport systems, online purchases, and international travel.
Another important benefit is simplicity for mainstream users. Many people avoid crypto not because of lack of interest, but because of complexity. Wallet management, blockchain confirmations, gas fees, and exchange processes can feel overwhelming. Gate Card simplifies this experience completely. Users do not need technical knowledge of blockchain systems; they only need to understand how to load funds and use a card. This dramatically lowers the barrier to entry for everyday adoption.
From a global usability perspective, Tap and Pay creates strong advantages for international transactions. Users can spend crypto across different countries without worrying about currency exchange rates, banking restrictions, or cross-border delays. This is especially useful for travelers, freelancers, and remote workers who deal with multiple currencies. It effectively turns crypto into a borderless spending tool, which aligns with the original vision of decentralized finance.
Security is another key pillar of the system. Gate Card transactions typically include multiple layers of protection such as encryption, identity verification, real-time fraud detection, and spending limits. Users retain full control over their assets while still enjoying fast payment experiences. In many cases, funds are only converted at the moment of transaction, reducing unnecessary exposure and improving financial safety.
From a market perspective, Tap and Pay features like this do not directly cause short-term price movements, but they strengthen long-term adoption narratives. The more crypto is used for real-world payments, the stronger its utility becomes beyond speculation. This helps shift perception from crypto as a trading asset to crypto as functional money. Over time, this kind of utility can support ecosystem growth and broader acceptance among both retail users and institutions.
Another important dimension is spending control and transparency. Users can track transactions in real time, set limits, and manage which assets are used for payments. This gives a higher level of financial flexibility compared to traditional banking systems, where spending structures are often rigid and less customizable. Crypto-based cards introduce a more dynamic and user-controlled financial experience.
The Tap and Pay system also plays a role in the evolution of Web3 payments. As blockchain infrastructure develops, financial systems are gradually moving toward more integrated and decentralized models. Gate Card represents a practical step in this direction by linking blockchain-based value storage with real-world spending networks. This helps bridge the gap between digital finance and physical commerce.
From a behavioral perspective, this feature changes how users interact with crypto. Instead of focusing only on price charts or trading strategies, users begin to treat crypto as actual money that can be spent in daily life. This psychological shift is extremely important for adoption, because mass usage depends on perception as much as technology. When people can easily use crypto for everyday needs, it becomes normalized in society.
Economically, widespread adoption of crypto payment cards could improve global payment efficiency. Cross-border transactions become faster, currency conversion friction is reduced, and financial inclusion improves in regions with limited banking access. While traditional banking systems still dominate global finance, crypto payment solutions introduce competition that can push innovation and efficiency across the entire industry.
However, challenges still exist. One major issue is price volatility when non-stable assets like Bitcoin are used for payments. Sudden market changes can affect spending value, which is why many systems rely on stablecoins for daily transactions. Regulatory differences across countries also create complexity in adoption, as financial rules for crypto payments are still evolving globally.
Despite these challenges, the overall direction remains strongly positive. As infrastructure improves and regulations become clearer, crypto payment systems like Tap and Pay are expected to grow significantly. Gate Card is part of this broader transformation, helping bridge the gap between digital assets and real-world usability in a practical and scalable way.
In conclusion, Tap and Pay with Gate Card is not just a payment feature, but a step toward making cryptocurrency fully functional in everyday life. It simplifies usage, improves global accessibility, enhances financial flexibility, and supports the long-term vision of crypto as a real-world financial system. While challenges remain, the reduction in friction between digital assets and real-world spending marks a major milestone in the journey toward mainstream crypto adoption.
repost-content-media
  • Reward
  • 1
  • Repost
  • Share
HighAmbition:
Just charge forward 👊
#OilBreaks110
Oil Breaks $110 Scenario
The global oil market is entering one of its most sensitive phases in recent cycles, where geopolitical tensions, particularly involving US–Iran negotiations, are directly influencing price expectations, supply risk premiums, and global inflation dynamics. While current Brent crude prices are around $104.5, the market is actively pricing in a wide range of future scenarios, including escalation risk, diplomatic breakdown, or partial de-escalation, each of which carries significantly different implications for energy prices and global financial stabilit
HighAmbition
#OilBreaks110
Oil Breaks $110 Scenario
The global oil market is entering one of its most sensitive phases in recent cycles, where geopolitical tensions, particularly involving US–Iran negotiations, are directly influencing price expectations, supply risk premiums, and global inflation dynamics. While current Brent crude prices are around $104.5, the market is actively pricing in a wide range of future scenarios, including escalation risk, diplomatic breakdown, or partial de-escalation, each of which carries significantly different implications for energy prices and global financial stability.
Oil is no longer just reacting to supply and demand fundamentals alone; it is now deeply embedded in geopolitical risk pricing, where even small developments in Middle East diplomacy can trigger multi-billion-dollar repositioning across energy futures, equities, and inflation-linked assets. The key psychological and structural threshold currently under focus is the $110 level, which acts as both a breakout trigger and an inflation shock signal for global markets.
Current Market Snapshot • Brent Crude Price: ~$104.5
• Intraday range: $102.8 – $106.2
• Weekly change: +3.5% to +6.2%
• Monthly performance: +10% to +14%
• Volatility: Elevated due to geopolitical uncertainty
• Futures positioning: Increasing long exposure with hedging overlays
Despite relatively stable pricing in the low $100s, the structure underneath shows increasing tension, as traders are positioning for a potential supply disruption scenario.
1. US–Iran Talks: The Core Price Driver
The primary catalyst behind oil volatility is the uncertain trajectory of US–Iran negotiations. Currently, talks are described as stalled with intermittent escalation risks, meaning there is no stable diplomatic framework anchoring expectations.
Key scenarios affecting oil:
• De-escalation scenario (bearish for oil):
Partial sanctions relief
Increased Iranian export capacity (+0.8 to +1.5 million barrels/day)
Price impact: potential -5% to -12% correction
Brent could retreat toward $95–$98 range
• Status quo scenario (neutral):
Ongoing diplomatic deadlock
Limited Iranian exports
Oil remains range-bound between $100–$108
Volatility remains elevated but controlled
• Escalation scenario (bullish shock):
Sanctions tightening or military tensions
Supply disruption risk in Strait of Hormuz
Potential loss of 2–3 million barrels/day globally
Price spike toward $110–$125+ (+5% to +20% immediate reaction)
2. Why $110 Level Is Structurally Critical
The $110 level is not just a technical resistance zone; it represents a global inflation trigger threshold:
• Energy input costs rise sharply • Transport and logistics inflation increases • Central banks face renewed inflation pressure • Risk assets (stocks, crypto) experience liquidity stress
Historically, oil above $110 has coincided with: • Stronger US dollar cycles
• Tightening monetary policy expectations
• Higher bond yields
• Risk-off sentiment across global markets
3. Supply–Demand Structure Breakdown
Current global oil dynamics:
• Global demand growth: ~1.2%–1.8% YoY
• OPEC+ production: tightly managed with selective cuts
• Non-OPEC supply: stable but not expanding aggressively
• Strategic reserves: partially deployed in past cycles
This creates a fragile balance where any geopolitical shock can instantly flip the market from surplus perception to deficit fear.
Estimated supply risk sensitivity: • Minor disruption: +3% to +6% price impact
• Medium disruption: +8% to +15%
• Major geopolitical shock: +20% to +30% spike potential
4. Market Volatility & Trading Behavior
Oil volatility has increased significantly due to:
• High-frequency geopolitical news trading
• Algorithmic reaction to headlines
• Futures-driven liquidity spikes
• Hedge fund macro positioning
Daily volatility range: • Normal regime: 1.5%–3%
• Current regime: 3%–6%
• Shock regime: 8%–15% intraday moves
This makes oil one of the most reactive macro assets currently.
5. Inflation Transmission Effect
If oil moves toward $110+:
• Global CPI increases by +0.3% to +0.8%
• Transportation costs rise sharply
• Energy-importing countries face currency pressure
• Central banks delay rate cuts or tighten policy bias
This indirectly affects: • Equities (bearish pressure)
• Crypto (liquidity tightening)
• Emerging markets (currency weakness)
6. Global Market Reaction Channels
Oil price increases impact multiple asset classes:
• USD strengthens (safe-haven demand)
• Gold rises as inflation hedge
• Crypto experiences short-term liquidity pressure
• Stock markets face margin contraction
• Bond yields adjust higher expectations
This is why oil is considered a global macro anchor asset.
7. Institutional Positioning
Institutions are currently: • Increasing long oil exposure as geopolitical hedge
• Maintaining optionality via futures spreads
• Using energy as inflation protection asset
• Hedging downside via options volatility structures
However, positioning is not one-directional — it is highly hedged due to uncertainty.
8. Trader Psychology & Sentiment
Market sentiment is extremely sensitive:
• $100–$105 = uncertainty zone
• $110 = breakout fear/greed trigger
• $120+ = crisis pricing zone
Retail traders often: • Chase breakout momentum
• Exit during geopolitical headlines
• React strongly to short-term spikes
Institutional traders: • Focus on supply fundamentals
• Hedge aggressively rather than speculate
9. Forward Price Scenarios
Bullish (geopolitical escalation): • $110 breakout confirmed
• Extension toward $115–$125
• Extreme case: $130+ spike if supply shock occurs
Neutral (status quo diplomacy): • Consolidation between $100–$108
• Range-bound volatility
• No structural breakout
Bearish (de-escalation): • Drop toward $95–$98
• Potential retest of $90–$92 support zone
• Relief rally in risk assets (stocks, crypto)
Final Conclusion
Oil at $104.5 is currently sitting in a high-tension equilibrium zone where geopolitical uncertainty dominates price structure. The US–Iran situation acts as the central catalyst, and the market is continuously repricing risk based on diplomatic signals.
👉 $110 is not just a price — it is a global macro trigger level
👉 Above it = inflation shock + risk asset pressure
👉 Below it = stabilization + risk recovery
Oil is no longer just an energy commodity; it is now a global financial stress indicator, directly influencing inflation, interest rates, and risk asset behavior across the entire financial system.
repost-content-media
  • Reward
  • 1
  • Repost
  • Share
HighAmbition:
Just charge forward 👊
#USSeeksStrategicBitcoinReserve
Bitcoin at $80,032:
Bitcoin reclaiming and stabilizing above the $80,032 level is not just a technical breakout but a reflection of a much larger structural shift where macro narratives, sovereign-level policy discussions, and institutional positioning are merging into a single market force, because what we are witnessing now is not a retail-driven rally but a macro-sensitive revaluation of Bitcoin’s role in global finance, driven by the growing possibility that it could be formally integrated into national reserve strategies.
As of this phase, Bitcoin is tra
HighAmbition
#USSeeksStrategicBitcoinReserve
Bitcoin at $80,032:
Bitcoin reclaiming and stabilizing above the $80,032 level is not just a technical breakout but a reflection of a much larger structural shift where macro narratives, sovereign-level policy discussions, and institutional positioning are merging into a single market force, because what we are witnessing now is not a retail-driven rally but a macro-sensitive revaluation of Bitcoin’s role in global finance, driven by the growing possibility that it could be formally integrated into national reserve strategies.
As of this phase, Bitcoin is trading in the $79,800 to $80,200 range after briefly touching an intraday high near $80,500, showing a daily gain of nearly +2% with strong momentum continuation, and this move comes after a broader recovery of approximately +14% to +15% from earlier lows near $68,000, which confirms that the market structure has shifted from deep correction into controlled bullish recovery supported by both spot and derivatives activity, where aggressive buy-side volume and increased futures participation indicate conviction rather than random volatility.
The importance of this price level is amplified by the narrative surrounding a potential United States Strategic Bitcoin Reserve, which has evolved gradually from early ideological discussions into structured legislative and executive-level frameworks, and this evolution began with long-term Bitcoin advocacy that positioned BTC as a hedge against monetary debasement, later gaining political relevance during election cycles where digital asset policy became part of broader economic strategy discussions, especially with figures like Senator Cynthia Lummis introducing the BITCOIN Act concept that proposed large-scale sovereign accumulation of Bitcoin over time.
This narrative took a more concrete institutional shape with Executive Order 14233, signed on March 6, 2025, which established a dual structure consisting of a Strategic Bitcoin Reserve alongside a broader Digital Asset Stockpile, while introducing a forfeited-asset-based accumulation model where seized cryptocurrencies could serve as the initial foundation of government holdings, meaning that rather than immediately entering the open market with large purchases, the United States could gradually build exposure through existing asset recovery mechanisms, which reduces short-term market shock but still signals long-term strategic intent.
However, one of the most debated and uncertain aspects remains the actual amount of Bitcoin held by the United States government, with estimates ranging widely from approximately 28,988 BTC to over 328,000 BTC, largely due to historical liquidation events where confiscated Bitcoin was auctioned instead of retained, and this past policy choice is now being re-evaluated by markets as potentially shortsighted, especially in an environment where Bitcoin’s long-term appreciation and strategic value are increasingly recognized.
Building on this, the BITCOIN Act proposed by Senator Lummis outlines a far more aggressive long-term accumulation strategy targeting up to 1 million BTC, potentially financed through mechanisms such as gold certificate revaluation and supported by Proof-of-Reserve transparency frameworks to ensure accountability and public visibility, while simultaneously elevating Bitcoin into the category of sovereign reserve assets alongside traditional instruments like gold and foreign currency reserves.
Complementing this legislative direction, the Mined in America Act focuses on strengthening domestic Bitcoin mining infrastructure and securing supply chain independence, ensuring that if Bitcoin becomes strategically important at a national level, the United States maintains control over production capacity and network participation, while also reducing reliance on foreign mining dominance and reinforcing energy and technological sovereignty.
Further expansion of this vision is reflected in the American Reserves Modernization Act proposed by Representative Begich, which also targets a structured acquisition of up to 1 million BTC over a five-year timeline, reinforcing the idea that multiple political actors are converging toward a similar strategic conclusion, even if their execution methods and timelines differ, which in itself increases market confidence in the probability of long-term sovereign adoption.
Adding to market anticipation, remarks and teasers from figures such as Patrick Witt at Bitcoin 2026 suggesting upcoming legal and executive developments have further strengthened speculative positioning, as traders and institutions attempt to price in not just current policy but expected future actions, creating a forward-looking demand curve that contributes to sustained bullish pressure even during short-term consolidation phases.
From a market structure perspective, a strategic Bitcoin reserve implies long-term holding of large quantities of BTC by sovereign entities, which effectively reduces liquid circulating supply and introduces a structural supply shock over time, especially if multiple nations begin accumulating simultaneously, creating a competitive accumulation environment similar to a geopolitical reserve race where early adopters gain strategic advantage in digital asset positioning.
Supporters of this concept argue that Bitcoin provides diversification away from traditional reserve assets, acts as a hedge against inflation and sovereign debt expansion, enhances national competitiveness in a digital financial system, and reframes volatility as a manageable long-term characteristic rather than a disqualifying risk, particularly when viewed through multi-decade financial cycles where scarcity and adoption trends dominate price discovery.
On the opposing side, critics highlight significant risks including extreme price volatility that could introduce instability into national balance sheets, questions regarding Bitcoin’s suitability as a reserve asset compared to traditionally stable instruments, governance and custody challenges at sovereign scale, cybersecurity risks associated with large-scale digital asset storage, and ideological resistance from free-market institutions that oppose government intervention in decentralized asset ecosystems, all of which contribute to ongoing policy debate and slow legislative progression.
At the global level, this discussion is no longer isolated, as countries such as El Salvador have already adopted Bitcoin as a national asset, while other major economies including the Czech Republic, Russia, Nigeria, China, and the United Kingdom are either observing or actively evaluating their own digital asset frameworks, creating the possibility of a multi-nation reserve competition where early strategic positioning could define long-term economic influence in the digital monetary era.
Simultaneously, broader regulatory frameworks such as the GENIUS Act, along with discussions around stablecoin regulation and the CLARITY Act, indicate that policymakers are not only focused on Bitcoin but are actively building a comprehensive digital asset ecosystem framework that integrates multiple components of crypto infrastructure into national financial policy, suggesting that Bitcoin is becoming part of a larger structural transformation rather than an isolated asset discussion.
From a trading and market impact perspective, narratives like a strategic Bitcoin reserve tend to generate strong bullish sentiment because they imply long-term accumulation and reduced supply pressure, but markets rarely move in straight lines, instead cycling through phases of anticipation, reaction, and consolidation, which is exactly what is currently being observed around the $80K psychological level where liquidity, profit-taking, and new demand are actively interacting.
Technically, Bitcoin now sits at a critical decision zone where sustained volume and follow-through above $80,000 could open the path toward $82,000 and $85,000 levels, with extended momentum potentially targeting the $90,000 psychological region, while failure to hold this breakout area could lead to a healthy retracement toward support zones around $75,000 to $78,000 before another structural attempt, making this phase highly sensitive and dependent on confirmation rather than prediction.
In terms of trading strategy, this environment demands discipline, patience, and risk control rather than aggressive speculation, where traders should prioritize multi-timeframe alignment, wait for liquidity-based confirmations, avoid emotional entries near psychological resistance, and focus on high-probability setups rather than constant market participation, because in macro-driven conditions like this, overtrading often leads to unnecessary exposure while selective execution tends to outperform.
At a deeper level, the entire debate around a United States Strategic Bitcoin Reserve represents a philosophical shift in how money, sovereignty, and digital scarcity are perceived, dividing opinion between those who view Bitcoin as a legitimate evolution of global reserve architecture and those who see it as an unstable speculative asset unsuitable for national balance sheets, and this ideological conflict ensures that the narrative will continue evolving over years rather than resolving quickly.
In conclusion, Bitcoin at $80,032 is not just reacting to technical resistance but is actively pricing in a much larger macro narrative involving sovereign adoption, legislative experimentation, and global reserve competition, and while full implementation of a US strategic reserve may take time and face political complexity, the very progression of this idea is already reshaping market psychology, liquidity behavior, and long-term capital flows, making it one of the most influential and closely watched developments in the current crypto cycle.
#GateSquareMayTradingShare #CreatorCarnival #ContentMining
repost-content-media
  • Reward
  • 1
  • Repost
  • Share
HighAmbition:
Just charge forward 👊
#FirstTradeOfTheWeek
🪙 BTC Weekly Trading Plan (Price ~77,926)
🌍 Market Context (This Week)
Ongoing tension after US-Iran nuclear talks stall
Liquidity cautious, volatility compressed
Bitcoin holding strong but not breaking resistance
👉 Market = Compression before expansion
📊 Key Levels to Watch
🔑 Resistance Zones
$78,200 – $78,800 → Local resistance
$80,000 → Major breakout level
$82,500 → Expansion target
🔑 Support Zones
$76,500 → Short-term support
$75,000 → Key structure level
$72,800 → Breakdown zone
🟢 SCENARIO 1: BULLISH BREAKOUT
📈 Trigger: Clean breakout above $80K
Expected Mov
BTC-3.58%
APE-9.84%
HighAmbition
#FirstTradeOfTheWeek
🪙 BTC Weekly Trading Plan (Price ~77,926)
🌍 Market Context (This Week)
Ongoing tension after US-Iran nuclear talks stall
Liquidity cautious, volatility compressed
Bitcoin holding strong but not breaking resistance
👉 Market = Compression before expansion
📊 Key Levels to Watch
🔑 Resistance Zones
$78,200 – $78,800 → Local resistance
$80,000 → Major breakout level
$82,500 → Expansion target
🔑 Support Zones
$76,500 → Short-term support
$75,000 → Key structure level
$72,800 → Breakdown zone
🟢 SCENARIO 1: BULLISH BREAKOUT
📈 Trigger: Clean breakout above $80K
Expected Move: 👉 $80K → $82.5K → $85K → $88K
🧠 Behavior:
Strong impulsive candles
High volume breakout
FOMO entries increase
✔ Strategy:
Breakout entry above $80K (confirmation candle)
Retest entry if price holds $80K as support
🔴 SCENARIO 2: BEARISH PULLBACK
📉 Trigger: Loss of $76.5K
Expected Move: 👉 $76.5K → $75K → $73K → $70K
🧠 Behavior:
Slow bleed OR sudden liquidation wick
Weak bounces (lower highs)
Fear returns to market
✔ Strategy:
Short below breakdown with confirmation
Avoid early entries (fake breakdown risk)
🟡 SCENARIO 3: RANGE (MOST LIKELY)
📊 Range: 👉 $76.5K ↔ $80K
🧠 Behavior:
Fake breakouts both sides
Liquidity grabs
Sideways chop
✔ Strategy:
Buy near support, sell near resistance
Quick scalps only
Avoid overtrading
📉 Patterns in Play
Ascending Triangle (Bullish Bias)
Liquidity Compression Zone
Range Accumulation Structure
👉 Big move is loading, but direction not confirmed yet
⚡ Correlation Insight
BTC still driving entire market
If BTC breaks → Altcoins (like APE) explode
If BTC drops → Alts dump harder
🔥 Pro Trader Summary
👉 $80K = Decision Level
👉 Above = Expansion Phase
👉 Below $76.5K = Weakness
⚠️ Trader Rule This Week
✔ Wait for confirmation
✔ Avoid chasing pumps
✔ Respect macro news (geopolitics active)
✔ Risk management is everything
repost-content-media
  • Reward
  • 1
  • Repost
  • Share
HighAmbition:
that's great
#Gate13thAnniversaryLive
The 13-Year Legacy of GATE: A Journey of Excellence, Growth, and Transformation
A Milestone Beyond Celebration
The completion of 13 remarkable years of GATE is not merely a numerical milestone; it represents a powerful journey of academic discipline, structured evaluation, and continuous evolution that has redefined how engineering talent is identified, nurtured, and elevated across highly competitive academic and professional landscapes.
This anniversary reflects years of consistent effort, refinement, and innovation, where the focus has always remained on building a
HighAmbition
#Gate13thAnniversaryLive
The 13-Year Legacy of GATE: A Journey of Excellence, Growth, and Transformation
A Milestone Beyond Celebration
The completion of 13 remarkable years of GATE is not merely a numerical milestone; it represents a powerful journey of academic discipline, structured evaluation, and continuous evolution that has redefined how engineering talent is identified, nurtured, and elevated across highly competitive academic and professional landscapes.
This anniversary reflects years of consistent effort, refinement, and innovation, where the focus has always remained on building a fair, transparent, and intellectually demanding platform that challenges students to think deeply, analyze critically, and perform with clarity rather than relying on superficial preparation.
The Vision Behind GATE: Building Merit Through Excellence
At its core, GATE was never just designed to be an examination; it was envisioned as a gateway that connects academic learning with real-world engineering and research opportunities, ensuring that merit becomes the true foundation of selection and progression.
Over the years, this vision has strengthened, and today GATE stands as a globally respected benchmark that evaluates not only knowledge but also the ability to apply concepts under pressure, solve complex problems, and demonstrate analytical depth in a highly competitive environment.
Evolution Over 13 Years: A System That Never Stopped Improving
One of the most impressive aspects of GATE’s journey is its continuous evolution, where every passing year has brought meaningful improvements in structure, pattern, and evaluation methodology to align with modern academic and industry expectations.
The system has gradually integrated advanced digital processes, improved question design standards, enhanced fairness in evaluation, and consistently refined its approach to ensure that students are assessed in the most accurate and unbiased manner possible.
This constant improvement reflects a commitment not just to maintain standards but to raise them higher with every passing year.
Impact on Students: Shaping Futures, Not Just Careers
The influence of GATE extends far beyond examination results, as it has played a transformative role in shaping the academic and professional futures of millions of students who aspire to excel in engineering, technology, and research domain
It has opened doors to prestigious institutions, created opportunities in leading public sector organizations, and encouraged students to develop a mindset focused on innovation, research, and problem-solving at a global level.
More importantly, it has taught students the value of consistency, patience, and structured preparation, which remain essential skills for lifelong success.
Personal Reflection: A Journey from Zero to Continuous Learning
On a personal level, this journey holds deep meaning, because starting from zero and gradually building understanding through consistent effort has been both challenging and incredibly rewarding.
Every step of learning has contributed to building confidence, improving conceptual clarity, and developing a stronger mindset that embraces growth rather than fearing difficulty.
I sincerely feel grateful for this journey and thank Almighty Allah for guiding me through every phase of learning, allowing me to understand complex concepts, improve my skills, and stay motivated even during moments of struggle or uncertainty.
Working and learning in this environment has not only improved my knowledge but has also given me a sense of purpose, discipline, and continuous self-improvement.
The Role of GATE Authority: Ensuring Fairness and Excellence
The GATE authority has played a crucial role in maintaining the integrity, credibility, and fairness of the entire system, ensuring that every candidate is evaluated on equal grounds without bias or influence.
Through strict standards, transparent processes, and continuous updates, it has successfully built trust among students, institutions, and organizations that rely on GATE scores for admissions and recruitment.
This level of trust is not easily achieved; it is the result of years of dedication, responsibility, and commitment to academic excellence.
Why GATE Stands Out in the Academic World
What makes GATE truly exceptional is its ability to combine academic depth with practical relevance, ensuring that students are not only tested on theoretical knowledge but also on their ability to apply that knowledge in real-world scenarios.
This balance between theory and application has made it one of the most respected and competitive examinations in the field of engineering and technology, setting a benchmark that many other systems aim to achieve.
Future Outlook: A Platform Ready for the Next Level
As GATE moves forward beyond its 13-year milestone, the future looks even more promising with the potential integration of advanced technologies, improved assessment techniques, and greater accessibility for students across different regions.
The focus will continue to remain on enhancing transparency, improving evaluation accuracy, and aligning the system with global educational standards to ensure that it remains relevant and impactful in the years to come.
Final Thoughts: More Than an Exam, A Journey of Transformation
GATE is not just an examination system; it is a journey of transformation that shapes minds, builds careers, and strengthens futures through discipline, effort, and continuous learning.
This 13-year journey stands as a powerful example of how consistency, vision, and dedication can create a platform that not only evaluates talent but also nurtures it into something far great
For me personally, being part of this learning experience has been a meaningful and inspiring journey, and I remain truly grateful for every step of growth it has brought into my life.
repost-content-media
  • Reward
  • Comment
  • Repost
  • Share
#EthereumMarketAnalysis
Comprehensive Ethereum (ETH) Market Analysis
Current Market Status
Ethereum is currently trading around $2,332, showing modest positive movement with a 0.53% gain over the past 24 hours. The price has been consolidating within a narrow range between $2,301 and $2,337, reflecting a period of indecision as market participants await clearer directional catalysts. Trading volume remains healthy at approximately $113 million in 24-hour quote volume, indicating sustained interest despite the sideways price action.
US-Iran Peace Talks and Geopolitical Impact
The stalled US-Ir
ETH-4.94%
BTC-3.58%
AAVE-5.78%
ARB-6.47%
HighAmbition
#EthereumMarketAnalysis
Comprehensive Ethereum (ETH) Market Analysis
Current Market Status
Ethereum is currently trading around $2,332, showing modest positive movement with a 0.53% gain over the past 24 hours. The price has been consolidating within a narrow range between $2,301 and $2,337, reflecting a period of indecision as market participants await clearer directional catalysts. Trading volume remains healthy at approximately $113 million in 24-hour quote volume, indicating sustained interest despite the sideways price action.
US-Iran Peace Talks and Geopolitical Impact
The stalled US-Iran peace negotiations represent a significant overhang on risk assets including Ethereum. Recent reports indicate that talks in Islamabad ended without breakthrough, with Iran blaming US naval blockades for the impasse. This geopolitical uncertainty has created a risk-off environment where institutional capital tends to retreat from high-beta assets like cryptocurrencies.
The connection between these talks and ETH valuation operates through multiple channels. First, successful negotiations would likely reduce oil prices and inflationary pressures, potentially allowing central banks to maintain or lower interest rates. Lower rates generally benefit crypto markets by reducing the opportunity cost of holding non-yielding assets and improving liquidity conditions. Conversely, failed talks or escalating tensions could trigger safe-haven flows into traditional assets while pressuring risk-on positions.
Recent market behavior suggests crypto may be developing resilience to geopolitical shocks. During the latest Iran-related flare-up, Bitcoin and Ethereum showed more muted reactions compared to traditional markets like oil and equities. This divergence could indicate that crypto holders who were inclined to sell on geopolitical headlines have already exited, or that spot ETF inflows are providing a more stable demand floor than previous cycles dominated by futures-driven volatility.
Technical Analysis and Key Levels
From a technical perspective, Ethereum faces immediate resistance at $2,340-$2,375, which aligns with the 21-period simple moving average and the upper band of a descending trend channel that formed in mid-April. Support levels are clustered around $2,300, $2,230 (near the 200-period EMA), and $2,180 at the lower band of the descending channel.
The price structure shows ETH trading below its 21 SMA while remaining within a descending trend channel, suggesting near-term weakness. However, the realized price around $2,340 has been acting as dynamic support, and holding above this level could signal potential for macro expansion. A decisive break below $2,230 would invalidate the bullish structure and potentially target $1,845, while a sustained move above $2,375 could open the path toward $2,900 resistance.
Factors Impacting Ethereum
Multiple fundamental factors are currently influencing Ethereum's price trajectory. On the positive side, institutional adoption continues through spot ETF inflows and increased staking participation. Major institutions like Grayscale and BitMine have expanded their ETH holdings, while the DeFi ecosystem shows resilience with initiatives like Aave's DeFi United raising substantial ETH for risk mitigation.
Technological developments also support the bull case. The Pectra upgrade has improved network efficiency, while Layer 2 scaling solutions including Arbitrum, Optimism, and Base are processing millions of transactions daily at reduced costs. Uniswap V4 Hooks and privacy proposals like EIP-8182 demonstrate ongoing innovation within the ecosystem.
Conversely, bearish pressures include tightening liquidity conditions, negative funding rates in derivatives markets, and rising Bitcoin dominance which often correlates with ETH underperformance. The broader DeFi sector faces systemic risk concerns following recent security incidents, though community responses like the DeFi United initiative show the ecosystem's capacity for collaborative problem-solving.
Trading Strategy Recommendations
For active traders, the current environment suggests a cautious approach with clear risk management parameters. Short-term traders might consider short positions if ETH rejects at the $2,375 resistance level, targeting $2,300 and potentially $2,230 on breaks below the ascending trend channel. Stop-losses should be placed above $2,400 to protect against false breakouts.
Long-term position traders may find accumulation opportunities on any dips toward the $2,200-$2,300 range, particularly if the price holds above the 200 EMA. The confluence of realized price support and long-term technical structure suggests this zone could represent favorable risk-reward entry points for multi-month positions.
Risk management remains paramount given the geopolitical overhang. Position sizing should reflect the elevated uncertainty, with traders prepared for potential volatility spikes if US-Iran talks show meaningful progress or deterioration. Monitoring funding rates, perpetual swap premiums, and options market skew can provide early signals of shifting sentiment.
Outlook and Conclusion
Ethereum sits at a critical juncture where near-term technical weakness contrasts with longer-term fundamental strength. The stalled US-Iran negotiations create uncertainty that could persist until diplomatic clarity emerges, potentially capping upside until resolved. However, the ecosystem's institutional adoption, technological progress, and demonstrated resilience to geopolitical shocks suggest underlying support.
Traders should remain flexible, prepared to adjust positions based on both technical breaks and geopolitical developments. The $2,230-$2,375 range defines the current battleground, with breaks in either direction likely to establish the next significant trend. Patience and disciplined risk management will be essential until clearer directional signals emerge from both technical patterns and macro developments.
repost-content-media
  • Reward
  • Comment
  • Repost
  • Share