Square
Following
Hot
News
Notifications
Profile

 BTCShortTermPullback

724.18k Views3.04k posts

BTC pulled back to around $84,000 after hitting $87,000, with over $300M liquidated in 24 hours — longs accounting for over 70%. Buying opportunity or trend reversal?

Related Coins

BTCBTC
-0.67%
🚀 BTC breaks above $87,000, with 90K now in sight

BTC continues to hit recent highs, breaking above $87,000. As short liquidations and ETF inflows jointly fuel market momentum, the focus has begun shifting from “Can it break through?” to—will the next stop be $90,000?

Which point are you watching more closely?
📈 How long can the trend continue after the 87K breakout?
💰 Can ETF inflows continue to provide support?
🔥 As market sentiment heats up, will it trigger another round of chasing the rally?
🎯 If 90K is breached, where will the next target be?

Bring #BTC突破87000美元 to Gate Square to
Where do you think BTC will go first?
🚀 surged straight to 90K
51%
📈 Continues breaking out after consolidation
19%
📊 Consolidate first around 87K
14%
🤔 Reassess after the pullback.
16%
113 ParticipantsVoting Finished
BTC-0.67%
  • 22
  • 25
#BTC突破87000美元
$87K is not the endpoint, but the first stop in the “resistance-turned-support” process—the short-term target is $90-92K, and holding $92K would open up room toward $98-100K. $100K is the consensus battleground for year-end. But how long the trend can continue depends on one transition: from “short-squeeze driven” to “spot market taking over.”

Current situation: a triple jump completed in 48 hours
BTC surged from $76K to $87,395 within 48 hours on September 21-22, its highest level since January. Today it consolidated around $87,000, with an intraday range of $85,111-87,251. T
ThisIsTranslateContent:
#BTC突破87000美元 $87K is not the endpoint, but the first stop in the “resistance-turned-support” process—the short-term target is $90-92K, and holding $92K would open up room toward $98-100K. $100K is the consensus battleground for year-end. But how long the trend can continue depends on one transition: from “short-squeeze driven” to “spot market taking over.”

Current situation: a triple jump completed in 48 hours
BTC surged from $76K to $87,395 within 48 hours on September 21-22, its highest level since January. Today it consolidated around $87,000, with an intraday range of $85,111-87,251. The drivers were a combination of “institutional buying + short squeeze + macro tailwinds.”

How long can the trend continue?
Judging “how long it can continue” is not about time, but whether three conditions still hold:
First, whether ETF funds continue to flow in. TradingKey’s core judgment is that as long as ETF inflows continue, $90-92K remains the main target. This is evidence that “spot is taking over”—short-squeeze money is one-off, while ETF money is持续. If ETFs record net inflows for multiple consecutive days, the trend still has fuel.
Second, whether $85K can hold. The key after a breakout is not “how high it rises,” but “how deep the pullback goes.” $85K is the first level to watch after the breakout, while $82-83K is the main support zone—a pullback that holds above $85K means the trend is healthy; breaking below it means the short-squeeze rally is cooling and the market will return to $82-83K to build momentum.
Third, whether leverage overheats again. After $648 million in short liquidations during this move, newly accumulated long leverage will become fuel for the next pullback. Santiment’s warning is blunt: “Cryptocurrencies often punish excessively high expectations”—the greater the FOMO, the higher the probability of a short-term pullback.

After breaking $90,000, where is the next target?
First hurdle: $90-92K. This is the immediate target zone after breaking $87K and the short-term consensus of the vast majority of analysts.
​Second hurdle: holding $92K → $98-100K. Michaël van de Poppe is calling for $98-100K, while Standard Chartered maintains its $100K year-end target—whether $92K is a “halftime break” or the “final destination” depends on whether it can hold.
​Third hurdle: breaking $100K → $135K. Invezz’s projection: holding $82,300 preserves the bullish structure, $100K is the next major target, and breaking $100K could open a path to $135K.
​Further out: altii’s bull-market scenario gives a range of $100-150K, requiring the full combination of 30 consecutive days of ETF net inflows, regulatory progress, and a dovish shift by the Federal Reserve.

But the opposing view must also be kept in mind: CoinCodex’s model still projects $76,250 at year-end (-12.5%). Such a wide divergence shows that $100K is a “conditional target,” not a “predetermined target.” If any link in the chain fails—ETF flows turn negative, the Federal Reserve remains hawkish, or leverage gets out of control—the market will first return to $82-85K for repricing.

Trading discipline
Do not chase above $87K; wait for a retest, and after a $90K breakout, follow the rule of “enter only after it holds.”
Take-profit line: $85,000 (breakout platform)—reduce your position first if it breaks below, and do not let profits evaporate.
​Add-on point: scale in on a retest of $82-83K (the main support zone); this is the best entry point for “trend continuation.”
​How to trade $90K: if $90K breaks but $92K does not hold, do not chase; consider adding only after $92K holds, as that would open up room toward $98-100K.
​Leverage discipline: leverage after a short-squeeze rally is a “double-edged sword”; keep long positions below 30% of your holdings, and risk control always comes first.

The $87K breakout confirms one fact—the bear-market narrative has ended, and $100K is back on the table. But remember, in a bull market, money is “made before the breakout and lost after the breakout”: every bullish candle after the breakout is accumulating energy for a pullback. The trend may continue to $90K, $100K, or even higher, but your position must always be prepared for a “pullback tomorrow.”#Gate广场中秋团圆局 $BTC ‌

repost-content-media
BTC-0.67%
  • 40
  • 2
#BTCShortTermPullback

Bitcoin Is Holding $83,481 — Pullback or Reset Before the Next Move?

Bitcoin is trading around $83,481, down 1.21% over the last 24 hours. The current 24-hour range is $82,505 to $84,965, showing that buyers are still defending the lower area while sellers continue to pressure every move toward the mid-$84,000 region.

For me, the important question is not whether BTC is red today. It is whether this pullback is simply cooling the market after a strong September recovery or the beginning of a deeper correction.

The broader structure still deserves attention. Bitcoin c
BTC-0.67%
  • 31
  • 3
#BTCRetakes80K #BTCRetakes80K
#BTC重回80K #Gate广场中秋团圆局
Bitcoin Back Above $80K: Breakout or Range-Bound Move?
Bitcoin has reclaimed the $80,000 level, but the key breakout signals are still not fully confirmed. For now, the market may continue trading within the $76,000–$86,000 range. The next major move will likely depend on whether buyers can confirm strength above key resistance levels.
Current Market Structure
Bitcoin has recovered roughly 38% from its early-July low below $58,000. After gaining around 24% during the week of August 22, BTC returned to the $80,000 area.
The price briefly mov
Repanzal
#BTCRetakes80K
#BTC重回80K #Gate广场中秋团圆局

Bitcoin Back Above $80K: Breakout or Range-Bound Move?

Bitcoin has reclaimed the $80,000 level, but the key breakout signals are still not fully confirmed. For now, the market may continue trading within the $76,000–$86,000 range. The next major move will likely depend on whether buyers can confirm strength above key resistance levels.

Current Market Structure

Bitcoin has recovered roughly 38% from its early-July low below $58,000. After gaining around 24% during the week of August 22, BTC returned to the $80,000 area.

The price briefly moved above $81,000 on September 3 before facing resistance and slipping below $80,000 on September 7. On September 18, Bitcoin bounced strongly from around $76,000 and pushed back above $81,000. The move came as expectations around the Fed rate decision were largely priced in, while comments from Trump regarding the Iran conflict also supported risk sentiment.

Around $470 million in short positions were liquidated over 24 hours during the move. Bitcoin is now trading near $80,900.

4 Signals to Watch

1. Can BTC reclaim $82,800 and break the $83,000–$86,000 supply zone?

This is the most important technical area to watch. Around 1.07 million BTC was accumulated between $83,000 and $86,000 according to Glassnode data, creating a significant supply zone.

A sustained move through this area with stronger volume would indicate that buyers are absorbing existing supply.

Two consecutive daily closes above $82,800 would provide a stronger confirmation of bullish momentum.

2. Are spot Bitcoin ETFs returning to sustained inflows?

Bitcoin spot ETFs saw approximately $746 million in outflows during the first two days of the week, followed by around $593 million in inflows during the following two days.

The overall weekly flow remained relatively balanced rather than showing a strong sustained inflow trend.

Continued institutional buying would provide an important source of support for any potential breakout.

3. What happens to Treasury yields and Fed expectations?

The 30-year U.S. Treasury yield closed around 5.33% on September 18, while the 10-year yield moved back toward 4.8%.

Elevated yields can continue to pressure risk assets. Any meaningful decline in yields or easing expectations around further rate increases could improve the broader liquidity environment for Bitcoin.

4. Is this a real accumulation move or mainly short covering?

Part of the latest rally appears to have been supported by short liquidations. With positioning now closer to neutral, the next phase will require genuine spot demand to maintain momentum.

Watch whether funding rates rise gradually rather than becoming overheated, while open interest increases alongside price.

Key Levels

Bullish confirmation: $82,800

Two consecutive daily closes above this level could open the way toward the $83,000–$86,000 supply zone, with a stronger move potentially targeting levels above $87,000.

Key downside level: $76,700

Two consecutive daily closes below $76,700 would weaken the current support structure and bring $73,500 into focus.

If selling accelerates, the next major downside area could be around $70,000, close to the 200-day moving average near $69,500.

Trading Approach

For now, it makes sense to treat Bitcoin as a range-bound market rather than assuming a confirmed breakout.

A stronger bullish confirmation would require several signals to align, particularly BTC holding above $82,800, sustained ETF inflows, and easing Treasury yields.

At around $81,000, Bitcoin remains between the key confirmation and breakdown levels. Chasing a move too aggressively carries risk, while staying overly cautious can also mean missing a confirmed expansion.

Manage position size carefully, avoid excessive leverage, and wait for confirmation rather than trading purely on momentum.

$BTC
BTC-0.67%
  • 27
  • 10
#BTCShortTermPullback
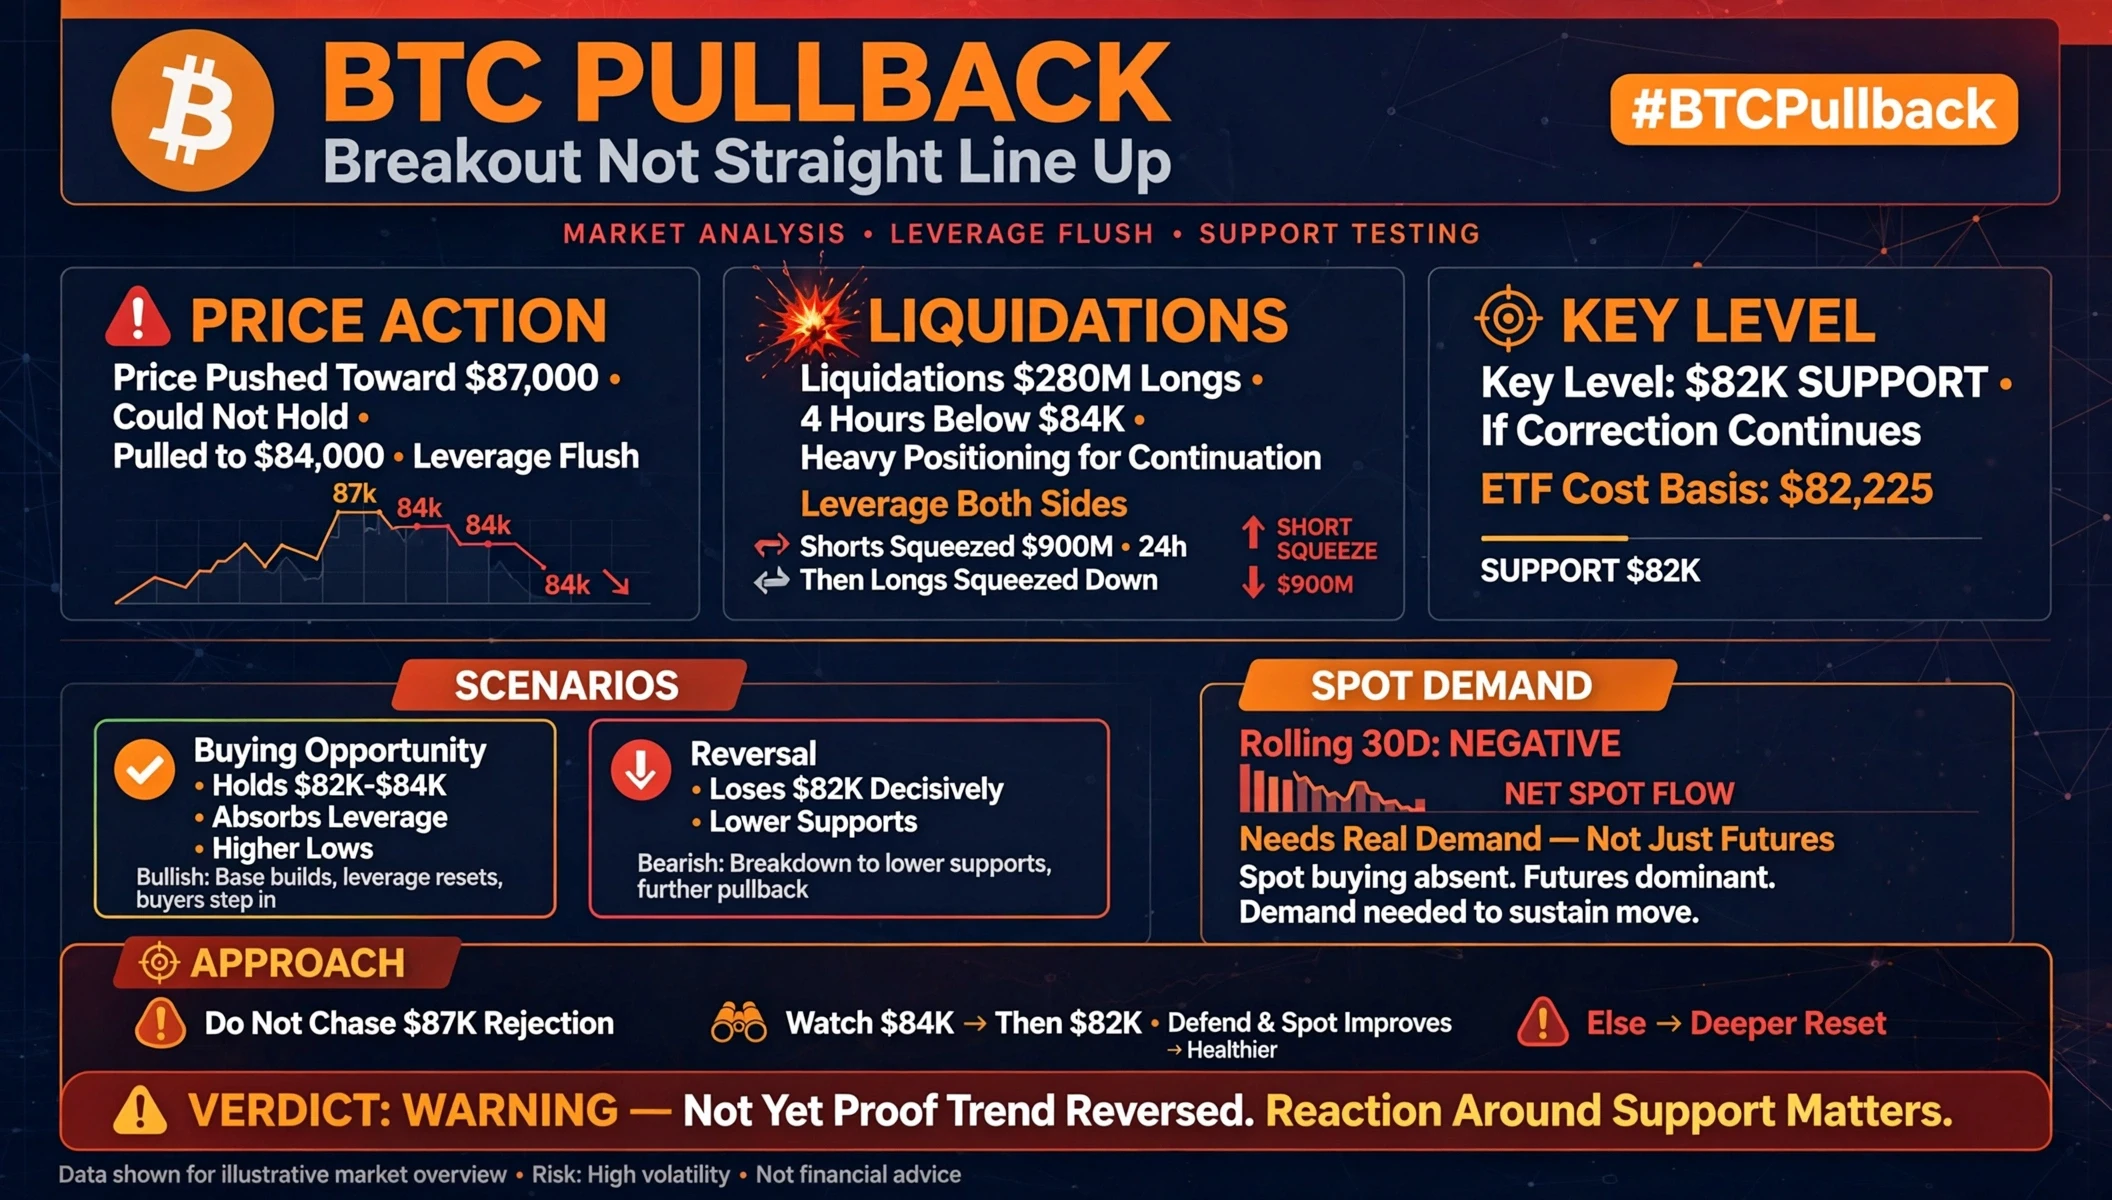
Bitcoin just reminded everyone that a breakout does not mean a straight line up.

BTC pushed toward $87,000, but the move could not hold. Price then pulled back toward the $84,000 area, and the decline quickly turned into a leverage flush.

The interesting part is where the liquidations came from.

Around $280 million in long positions were liquidated over roughly four hours as BTC dropped below $84K. That tells me the market had become heavily positioned for continuation after the move toward $87K. Once price started falling, leveraged longs were forced out, adding mor
post-image
BTC-0.65%
  • 23
  • 2
☀️ GM! Ding — BTC just hit floor 81. 🛗
$80K is holding again. Is the market ready for another move higher?
👇 Where do you see BTC going next?
🔥 Today’s Topic: #BTCRetakes81K

Share your take on Gate Square:
📈 Breakout or consolidation?
🎯 What’s your next BTC target?
💡 What signals are you watching?

Quality posts may receive featured placement and additional exposure
💬 Post on Gate Square:
https://www.gate.com/post
post-image
BTC-0.67%
  • 18
  • 15
BTC Falls Below $BTC Again! When Will the Real Breakout Happen? 📉🚀

Bitcoin has once again slipped below the $83,000mark, leaving traders scratching their heads. After hitting a local high of $87,401,the bulls lost momentum, and we are seeing a steady retracement across the hourly and daily charts.

Looking at the current setup:
🔹 The Resistance: On the 1H chart, the EMAs (around $83.3k- $83.8k)are acting as immediate dynamic resistance, capping upward movements.
🔹 The Support: We are currently testing key support zones. The daily EMAs clustered around $80k-$83kare crucial to hold to preve
post-image
BTC-0.67%
  • 23
  • 1
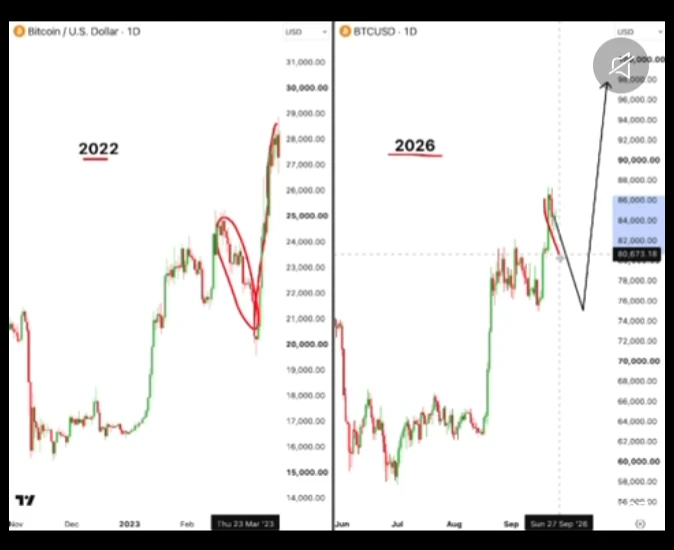
$BTC IS RHYMING WITH 2022

$BTCUSDT is currently showing a structure that looks surprisingly similar to the 2022 market setup. Same type of price action. Similar rejection patterns. Even the pumps look familiar. $ETH USDT History never repeats perfectly, but it often rhymes. The question is whether BTC follows the same script this time.
#GateBTCSpotVolumeRanksTop3 #BTCShortTermPullback #GateIdleEarnAddsUSD1UpTo8.16APR
post-image
BTC-0.67%
ETH-1.26%
  • 29
  • 1
🚀 BTC Breaks $87K — Is $90K Next?
BTC has pushed above $87,000, marking a fresh recent high. With short liquidations and ETF inflows adding fuel, attention is now shifting from the breakout itself to one question: can BTC reach $90K next?
What are you watching most?
📈 Can the uptrend keep going?
💰 Will ETF inflows stay strong?
🔥 Will rising momentum bring more buyers in?
🎯 If 90K breaks, where does BTC go next?
Share your market view, trading setup, or position plan on Gate Square with #BTCBreaks87000 .
✨ High-quality posts may receive a 3-day Gate Square traffic boost
👉 https://www.gat
Gate_Square
🚀 BTC Breaks $87K — Is $90K Next?

BTC has pushed above $87,000, marking a fresh recent high. With short liquidations and ETF inflows adding fuel, attention is now shifting from the breakout itself to one question: can BTC reach $90K next?

What are you watching most?
📈 Can the uptrend keep going?
💰 Will ETF inflows stay strong?
🔥 Will rising momentum bring more buyers in?
🎯 If 90K breaks, where does BTC go next?

Share your market view, trading setup, or position plan on Gate Square with #BTCBreaks87000 .
✨ High-quality posts may receive a 3-day Gate Square traffic boost
👉 https://www.gate.com/post
BTC-0.67%
  • 20
  • 1
#BTC weekly close occurred above the 82885 level we have been tracking, marking the first higher high relative to the latest downtrend. We have received another signal that the rise is likely to continue.
On the 4-hour chart, it tested the 82885 support, and the first buyers stepped in, but the buying is not yet strong. If it cannot hold this level, we can monitor the support at 80138. If it holds at either level, the possibility of a rise on the 4-hour chart will remain.
On the daily chart, the 74892 low is important. As long as it holds, the rise is expected to continue. However, a close bel
KamileUray
#BTC weekly close occurred above the 82885 level we have been tracking, marking the first higher high relative to the latest downtrend. We have received another signal that the rise is likely to continue.
On the 4-hour chart, it tested the 82885 support, and the first buyers stepped in, but the buying is not yet strong. If it cannot hold this level, we can monitor the support at 80138. If it holds at either level, the possibility of a rise on the 4-hour chart will remain.
On the daily chart, the 74892 low is important. As long as it holds, the rise is expected to continue. However, a close below it would mean that the decline is beginning, and further downside is expected.
During a decline, we will monitor the supports in the 67306-66769 region. If a bullish structure forms at either level, another rise may occur.
98000 and the 107-109 thousand region are resistance levels. In fact, a bearish Libra pattern may form in the 107-109 thousand region. If the pattern forms, a decline is expected unless there is a weekly close above 126000.
BTC-0.67%
  • 12
  • 1
Load More