Square
Following
Hot
News
Profile
Share your thoughts
placeholder
Article
Morning Market Update
live-cover
LIVE1,894
ETH ETF sees outflows for 23 consecutive days! Is Wall Street fleeing en masse? Is Ethereum really done for?
U.S. spot ETH ETFs have recorded net outflows for 23 consecutive trading days, setting the longest streak since their launch! The market is buzzing, with ETF investors seemingly having agreed to line up and head for the exits.
Net outflows exceeded $1 billion in October—a sizable figure indeed. Traditional finance, which once warmly embraced Ethereum, has suddenly turned cautious, like someone who tells you they love you every day while dating, then claims their phone is dead when the b
MU-5.28%
Trenches
KIM
K
bade
b
KIM
8pjf...pump
Market Cap
$.
Change
.
24h Vol
$.
Holders
.
ZIG
Z
bade
b
ZIG
0x8c...1145
Market Cap
$.
Change
.
24h Vol
$.
Holders
.
GTA6
G
bade
b
GTA6
4kjr...zDnz
Market Cap
$.
Change
.
24h Vol
$.
Holders
.
IDOL
I
bade
b
IDOL
0x3b...ab07
Market Cap
$.
Change
.
24h Vol
$.
Holders
.
BTC
B
bade
b
BTC
C5xp...pump
Market Cap
$.
Change
.
24h Vol
$.
Holders
.
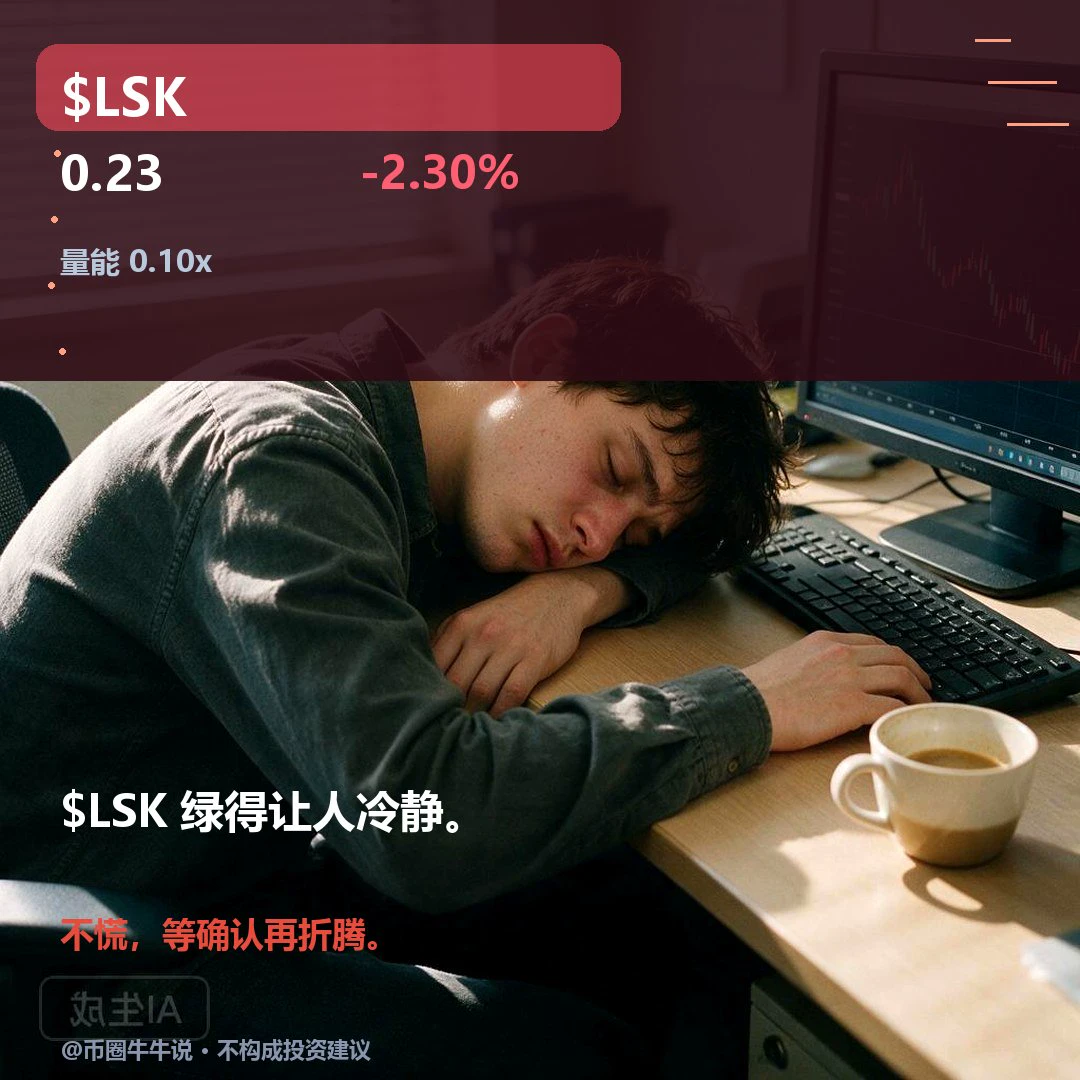
$LSK This trade is nearly up 100%, so I’m taking some profit off the table first. Let the rest run. Congrats to everyone who followed along—love you all. Mwah! ‌
post-image
LSK-5.22%
SOL-0.77%
BTC-0.65%
ETH-1.23%
BCH+0.95%
ZEC+1.29%
$LSK is currently trading at 0.2297, down 2.297% over 24H. The 1H is weak (RSI 10.10), while the 4H is strong (RSI 57.35), signaling a divergence. If it holds above the 0.3189 resistance level, a continuation may be worth watching; if it falls below the 0.2158 support level, a pullback may follow. Going forward, focus on whether it can hold above 0.3189 and whether it can recover after losing 0.2158. The two time frames remain divergent, so short-term moves should not be treated as a trend reversal. Trading volume is only 0.10x the average, so a single break needs confirmation from market part
post-image
LSK-5.32%
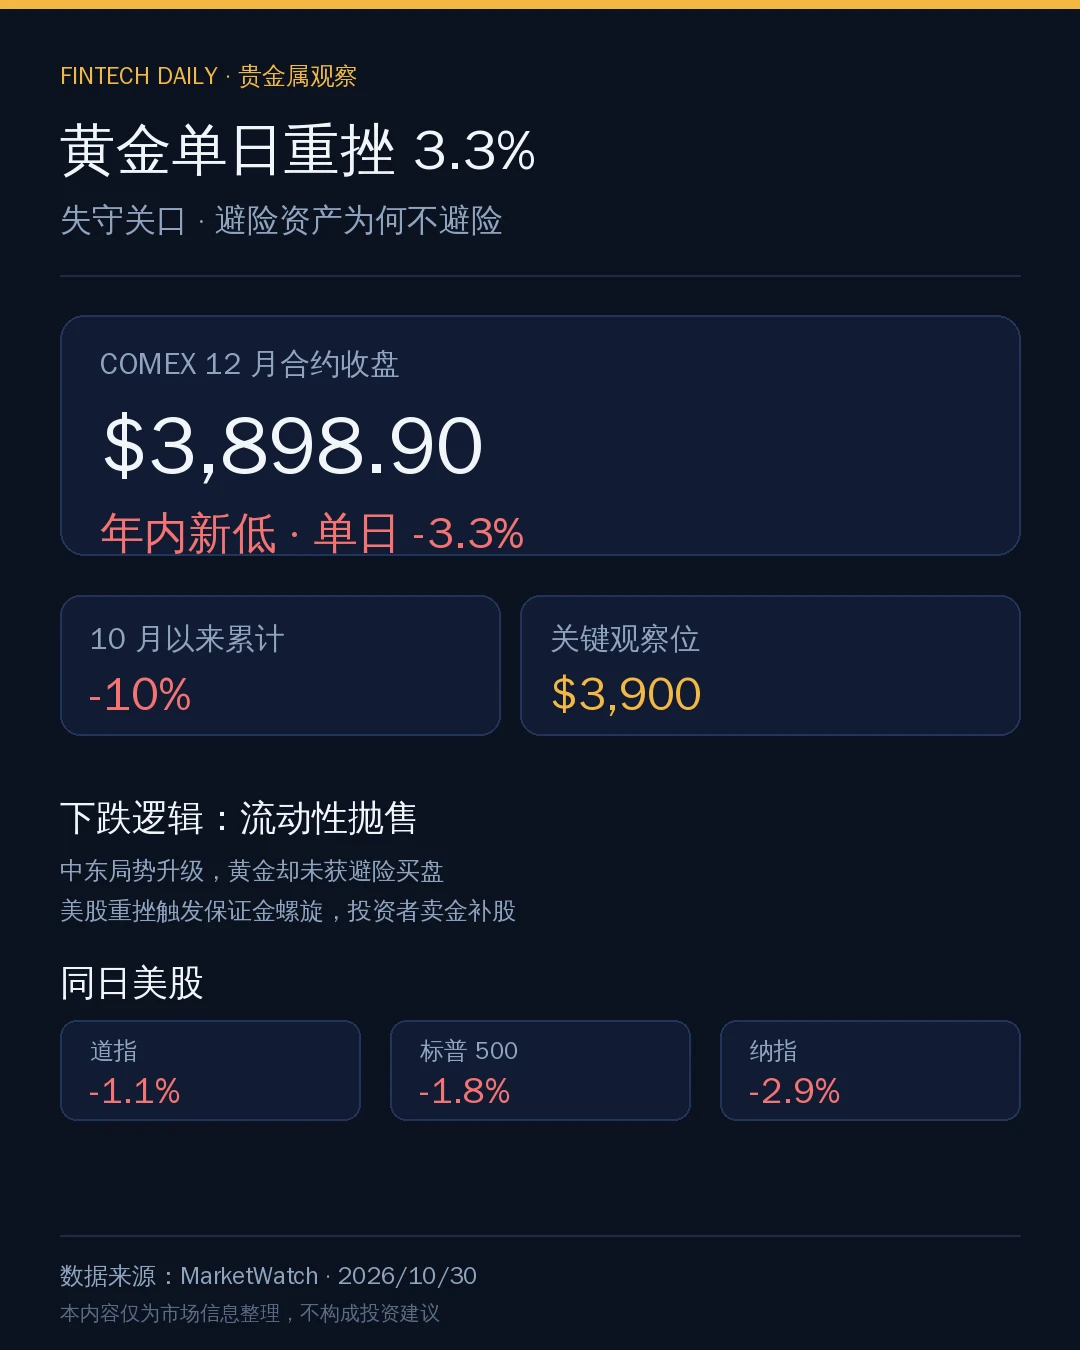
Market Flash: On October 30 (Friday), the December gold contract on the New York Mercantile Exchange settled at $3,898.90 per ounce, plunging 3.3% on the day to its lowest level since October 2, 2025. Taking a longer view, this correction has already taken a heavy toll—gold has pulled back 10% since October, putting the year-to-date bullish thesis through its most severe stress test yet. $XAU ‌
post-image
XAU+0.38%
❤️ $RYOMA
📣 GAMING MEETS CRYPTO, THE JOURNEY IS JUST BEGINNING! 📣
🎤 Get ready to explore RYOMA TOKEN, a Solana-based gaming project bringing gaming, blockchain, and community together!
✅ Explore the futuristic gaming ecosystem.
📈Watch the positive chart momentum.
💰 Track LIVE market cap and price movements.
📊 Monitor trading volume and market activity.
🆕 Discover the project's vision and potential.
✈️ Join the community and grow with the journey!
🚀 MARKET WATCH – KEEP AN EYE ON $RYOMA!
🟢 Live Chart & Market Cap:
😇 Telegram Community:
🎯 GAMING. MOMENTUM. COMMUNITY. SOLANA.
📌Don't j
SOL-0.77%
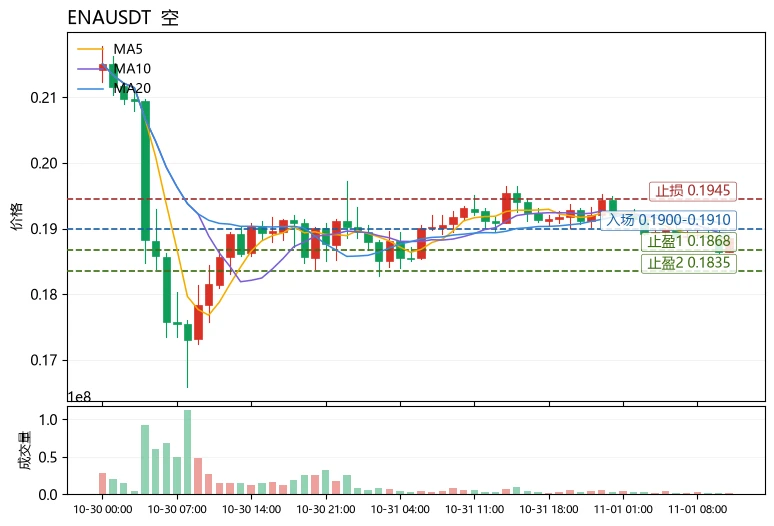
Whose ammunition costs more, longs or shorts? The answer is shorts—$ENA ’s funding rate is +0.0044%, meaning longs are continuously paying to hold their positions while the price is falling. This is a classic “crowded longs, exhausted buying” setup.
The technicals confirm this view: the current price of 0.1885 is near MA5=0.1883 but remains below MA20=0.19058, with moving average resistance still intact; RSI is only 45.0, indicating insufficient rebound momentum; the MACD histogram at -0.0004131 remains bearish; Bollinger Bands [0.186832, 0.194328] are contracting, with the price trading near
post-image
ENA+8.04%
PROM+0.45%
NEAR+1.17%
CPI is coming out this week, with the FOMC right behind it on Wednesday—both landing at once. This could get rough. If inflation comes in hot again, rate-cut expectations will get pushed back, and stocks will take the first hit. I’ll put it this way: don’t guess the direction; wait until the data is out. If you think I’m talking nonsense, save a screenshot.
post-image
  • 8
Ethereum ETFs See Record 23 Consecutive Days of Net Outflows! A Short-Term Winter Is Here—Have Long-Term Opportunities Really Disappeared?
U.S. spot ETH ETFs have seen net outflows for 23 consecutive trading days, the longest streak since their launch, with outflows exceeding $1 billion in October.
Seeing these figures, some people are starting to worry that Ethereum may be on its way out. But the most interesting thing about the market is that prices change every day, while value takes time to prove itself.
ETFs are an important gateway for traditional finance investors entering the crypto ma
AMZN-1.55%
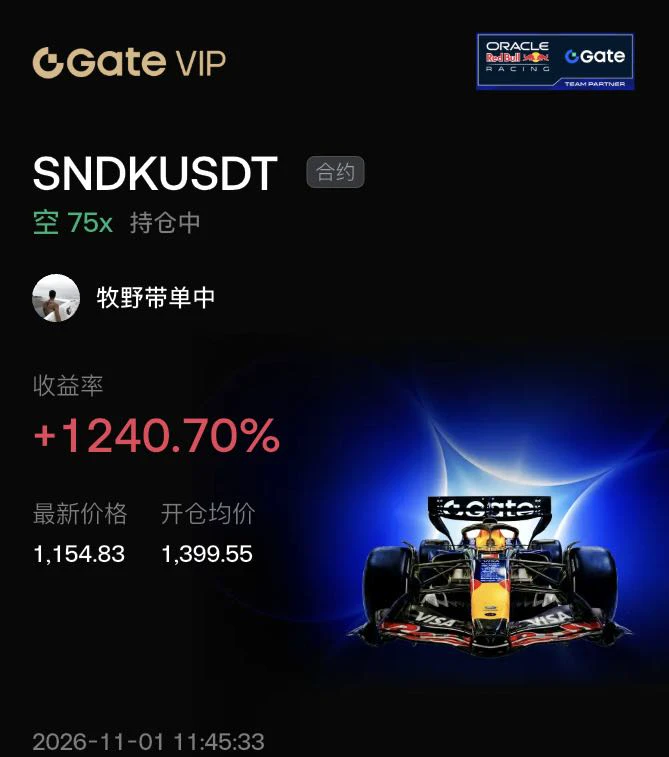
$SNDK There is no fundamental reason to short SanDisk. Earnings, capacity, and orders are all on its side.
The only reason can be found in the pricing: when an asset is universally bullish with no dissent, there are no new marginal buyers left to push it higher—only leverage that is still rolling over. At that point, any sign of letting go means a one-way decline; no negative catalyst is needed.
The window for this trade to play out is the few seconds when futures contracts unwind leverage, not some “precise top.” Whether the structure continues after that depends on whether real sellers step
post-image
SNDK-0.18%
BTC-0.65%
ETH-1.23%
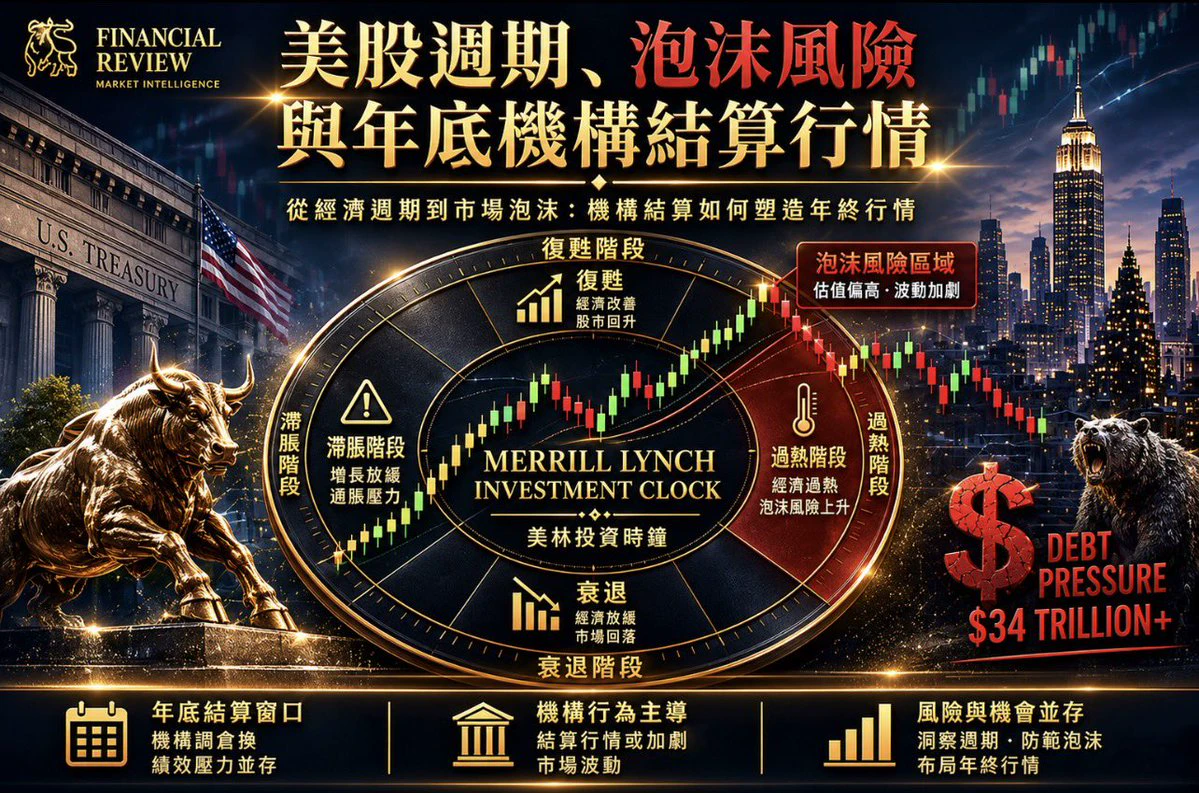
The U.S. Stock Market Cycle, Bubble Risk,
and the Year-End Institutional Settlement Rally
The U.S. stock market is currently in the late stage of a bull market.
Market sentiment is supported by growth momentum, but also carries
the buildup of excessive valuations and structural risks.
Looking at the market through the lens of the Merrill Lynch Investment Clock,
and factoring in U.S. debt pressures, the returns on massive capital
investments in artificial intelligence, and the unusual behavior of
institutions and companies settling stock investment gains and losses
at year-end, we can more clea
post-image
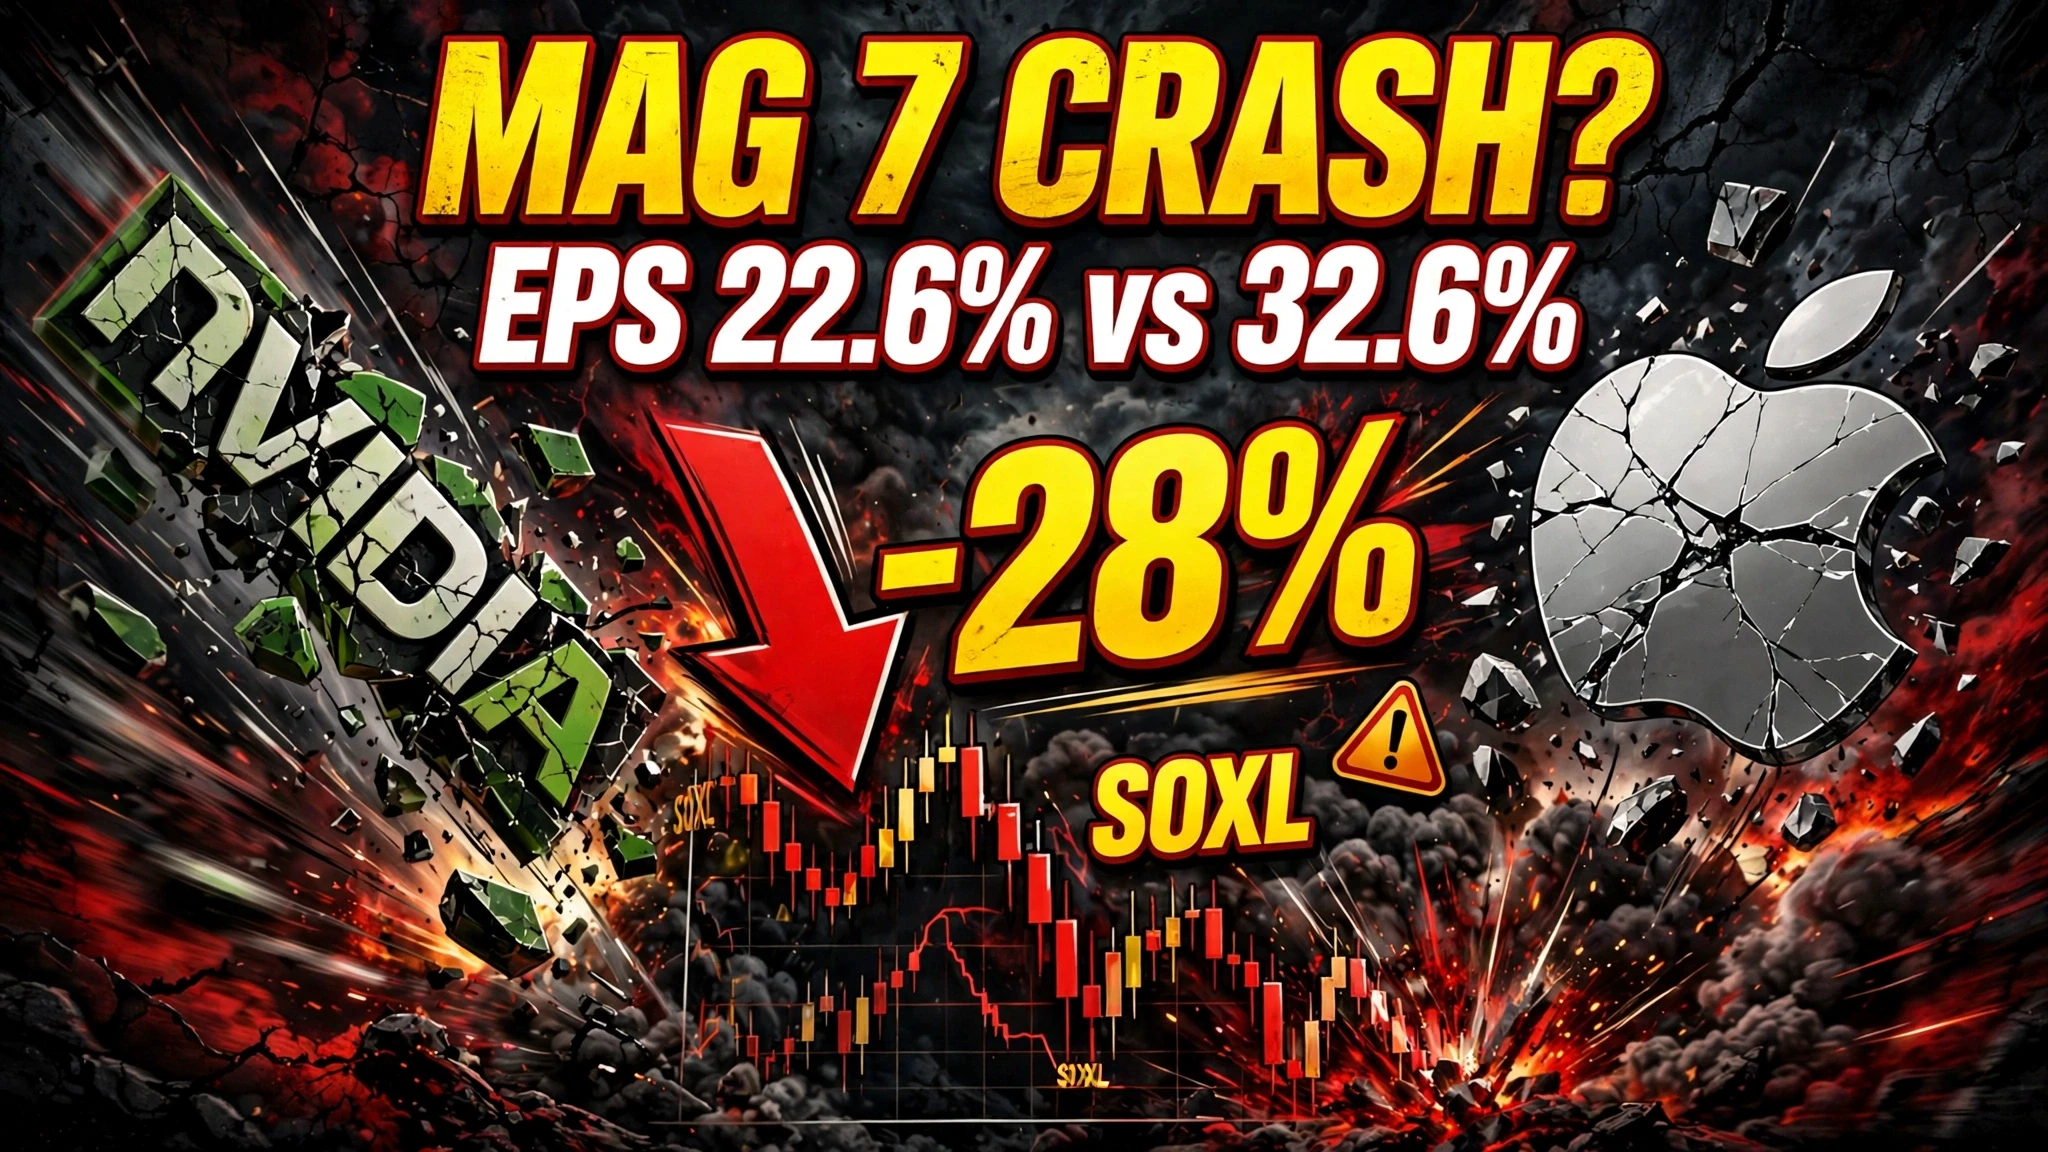
Magnificent Seven EPS Growth Drops to 22.6% in Q3, Now Trailing S&P 500 Other Stocks at 32.6%
The "Magnificent Seven" mega-cap technology stocks have seen their earnings per share growth drop to 22.6% in the third quarter of 2026, significantly trailing the 32.6% EPS growth recorded by the rest of the S&P 500, according to data released on November 1, 2026. This marks a historic shift, as the mega-cap tech giants that have driven the bull market for years are now growing slower than the average S&P 500 company. The SPX500 edged up 0.19%, but Nvidia fell 4.16% and Apple dropped 1.18%, reflectin
post-image
NVDA-4.16%
AAPL-1.18%
SPX500+0.19%
Guys, the crypto market can be volatile, but follow Xiaobi Senior and you won’t lose your way 🪙! Today, let’s look at the BTC/USDT perpetual contract chart using the BOLL indicator across multiple timeframes and break down the outlook and suitable entry points 🪙.
📊 Multi-Timeframe Technical Breakdown
* 4-hour higher timeframe (Chart 1):
The 4-hour chart shows a sharp sell-off from the previous high of $84,888 to around $76,260. The price has now stabilized and rebounded around $77,684. The BOLL middle band (around $78,283) is sloping downward, and the lower band is around $75,594. After
BTC-0.65%
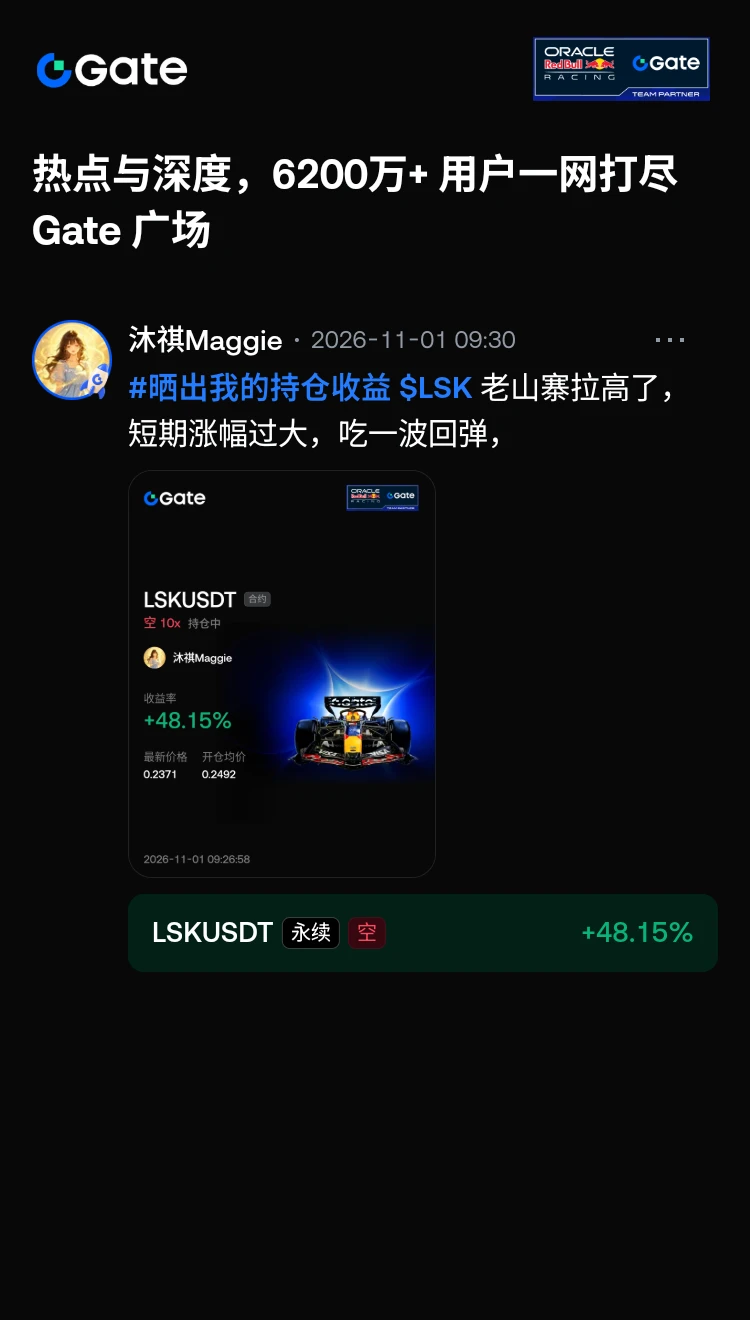
#Share My Holding Returns#LSK to the moon 2$
post-image
LSK-5.32%
$BTC Let me talk to you again about BTC, ETH, and SOL. No matter which exchange gets hacked, these are just minor blips. The crypto bull market is slowly on its way. The market is mostly fearful right now, and opinions are divided. Pessimistic friends think crypto will never recover and will keep falling. When BTC surged to 88,000, many people shouted that the bull market was here, but I still believed we were in the late stages of the bear market and that it would give everyone a chance to get in. That time is now. Once BTC holds above 90,000 by year-end, the bull market will officially begin
post-image
BTC-0.67%
ETH-1.26%
SOL-0.77%
#StrategySTRCNears100ParValue #ShareWeekly
Strategy’s STRC Preferred Stock Nears $100 Par Value: Detailed Analysis
Strategy Inc’s Variable Rate Series A Perpetual Stretch Preferred Stock (Nasdaq: STRC) has been trading close to its designated $100 stated amount (par value) in recent sessions. This post examines the situation across the eight core points with current market data, technical levels, chart observations, and trading considerations as of late October 2026
1. STRC approaching its original face value of $100
STRC is designed with a $100 stated amount per share. Recent closes have clu
The first time I went to the Guozijian was when I was taking the college entrance exam. Dad took me.
Actually, officials usually avoid places like this, because the dismounting stone at the entrance is considered very unlucky.
But clearly, his love for me outweighed all that.
The Guozijian is under renovation now, so there’s really no need to make a special trip. The plaques that people said you could touch to “achieve top honors” when I was a kid are now all cordoned off from visitors.
Just like this society.
Layout: Bitcoin, Ethereum, Dogecoin
live-cover
LIVE880
  • 3
Starting next week, buy the Nasdaq index more as it falls.
Keep buying until fully invested, prioritizing spot. No problem.
You don't get an opportunity like this often. U.S. stock indexes won't leave you holding the bag. Hold on; if you can't, go grab a hoe. Starting next week, buy the Nasdaq index more as it falls.
Keep buying until fully invested, prioritizing spot. No problem.
You don't get an opportunity like this often. U.S. stock indexes won't leave you holding the bag. Hold on; if you can't, go grab a hoe. Starting next week, buy the Nasdaq index more as it falls.
Keep buying until ful
NAS100-0.07%
NDAQ+0.65%
BTC-0.67%
  • 1
Load More

Join 40 M users in our growing community

⚡️ Join 40 M users in the crypto craze discussion

💬 Engage with your favorite top creators

👍 See what interests you

Trending Topics

BTC大跌

399.94k Views39.73k Discussing

$BTC briefly fell below $77,000 and remains under pressure around the $77K zone, with its 24-hour decline still above 4%. With risk appetite weakening and Fed uncertainty rising, where is the next key support after losing $80K?

IntelBeatsEarningsButStockPlunges

32.28k Views966 Discussing

StrategySTRCNears100ParValue

39.31k Views4.14k Discussing

View More