Square
Following
Hot
News
Profile
Share your thoughts
placeholder
Article
Santiment: DOGE and XRP appear undervalued by MVRV, while holders remain at a loss
Santiment reported that the 365-day MVRV for DOGE is around 0.74 and for XRP around 0.92, indicating that buyers over the past year remain at an unrealized loss on average. For BTC, ETH, and LINK, the metric is in the 0.97–1.04 range, meaning holders of these assets are generally near breakeven. Santiment estimates that a lower MVRV may indicate easing selling pressure and a potentially more favorable entry point with less risk, while a higher reading increases the risk of profit-taking. However, the indicator d
post-image
DOGE-0.22%
XRP-1.15%
BTC-0.67%
ETH-1.26%
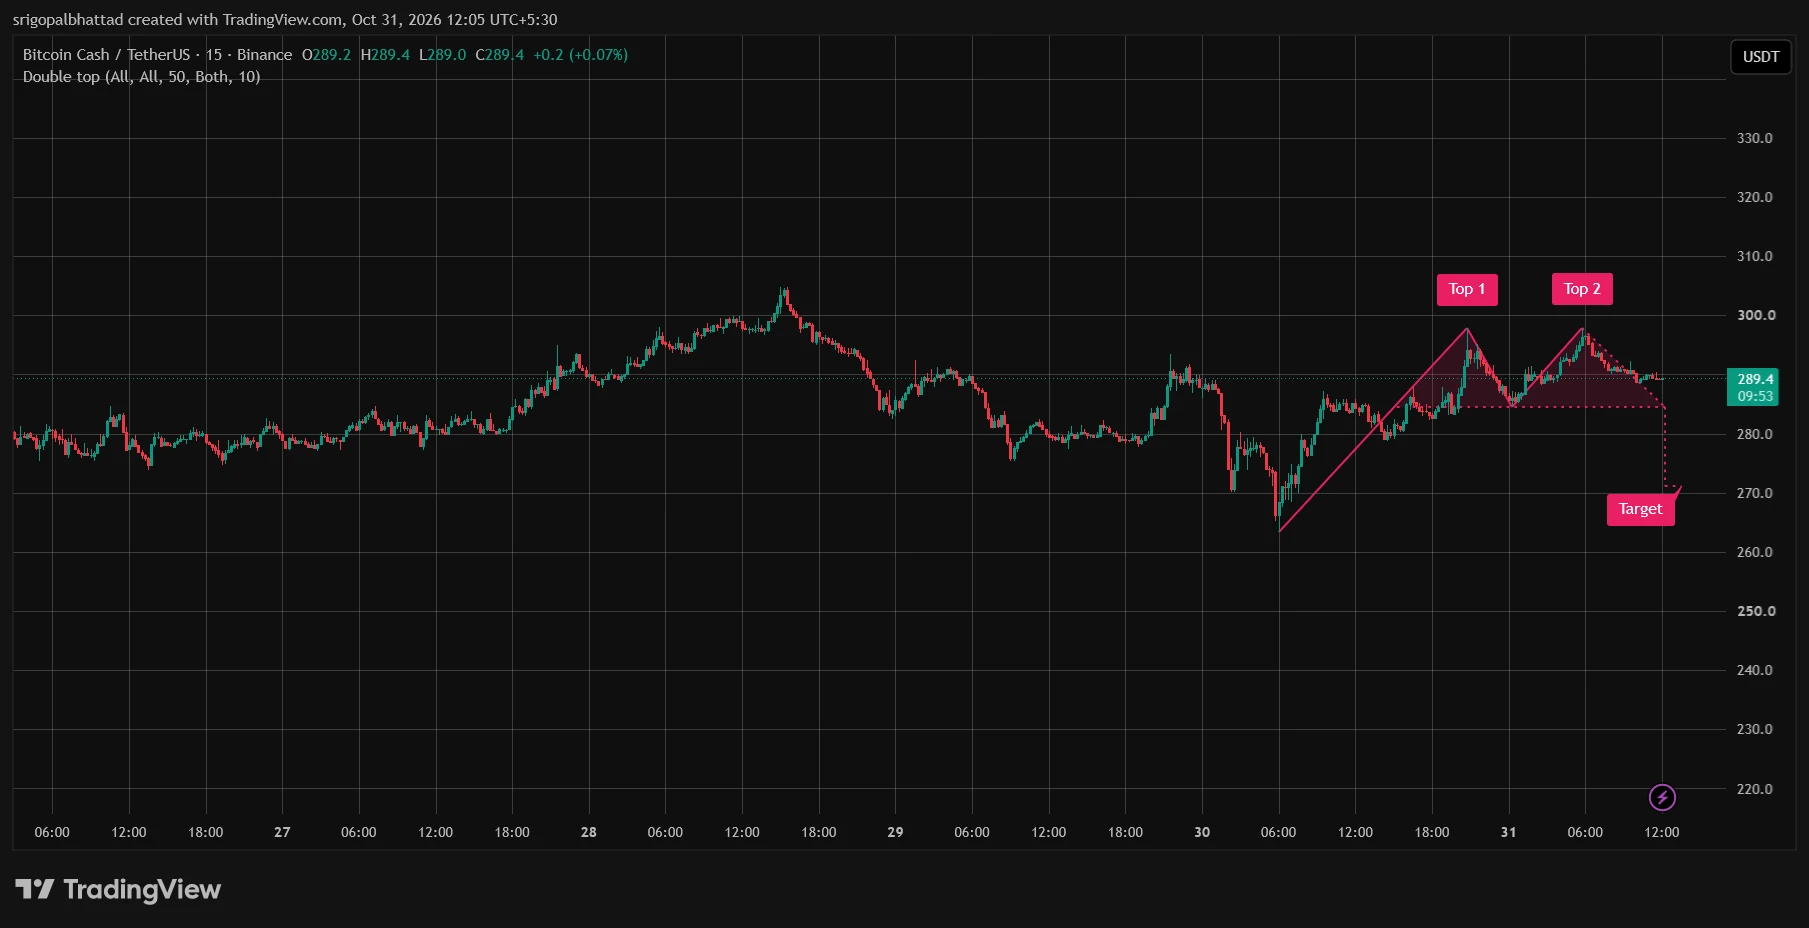
$BCH / USDT ⚠️
Bitcoin Cash is printing a Double Top formation on the 15-minute chart 👀 Sellers are defending the $297–$300 resistance zone, showing signs of weakening bullish momentum.
A confirmed breakdown below $285 support could trigger further downside toward $270 📉🔥
Bears are gaining momentum. Bulls must reclaim $300 to invalidate this bearish setup!
post-image
BCH+1.05%
Trenches
IDOL
I
bade
b
IDOL
0x3b...ab07
Market Cap
$.
Change
.
24h Vol
$.
Holders
.
Q
Q
bade
b
Q
0xc0...0589
Market Cap
$.
Change
.
24h Vol
$.
Holders
.
SAFU
S
bade
b
SAFU
0x7c...7777
Market Cap
$.
Change
.
24h Vol
$.
Holders
.
ZIG
Z
bade
b
ZIG
0x8c...1145
Market Cap
$.
Change
.
24h Vol
$.
Holders
.
STONK
S
bade
b
STONK
6GmA...UNgx
Market Cap
$.
Change
.
24h Vol
$.
Holders
.
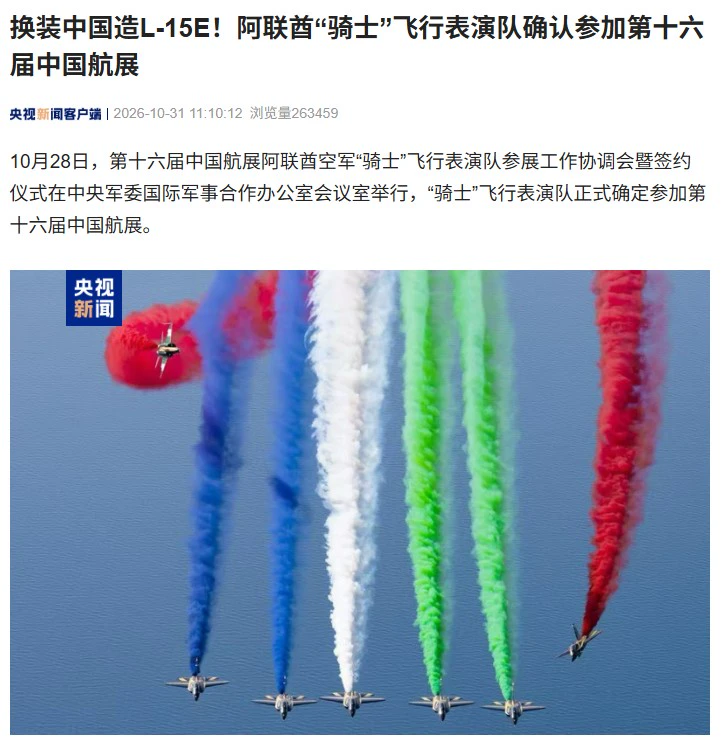
The UAE’s “Knights” aerobatic team has confirmed its participation in the 16th Zhuhai Airshow and has fully switched to Chinese-made L-15E advanced trainer jets; when it first visited China in 2014, it flew Italian MB-339A trainers.
Twelve years ago, the “Knights” used Italian MB-339As to form the UAE flag in Zhuhai. This year, they’re returning in Chinese L-15Es. The same team, but planes of different nationalities—the “coming home” angle is a neat one, but what audiences really want to see is whether the formation and the aircraft can both shine.
$BTC
#量化达人# Let’s talk quant trading and mark
post-image
BTC-0.67%
#StrategySTRCNears100ParValue #GateSquareHalloween
Strategy (STRC) Preferred Stock Surges Toward Its Historic $100 Par Value: A Landmark Moment of Strength, Resilience, and Investor Triumph
In a powerful display of market confidence and corporate engineering excellence, Strategy Inc’s Variable Rate Series A Perpetual Stretch Preferred Stock (Nasdaq: STRC) is trading at approximately $99.99, just a single penny away from its $100 stated par value / nominal value / liquidation preference. This is not a minor technical move. This is STRC standing at the threshold of its designed price anchor aft
post-image
NAS100-2.31%
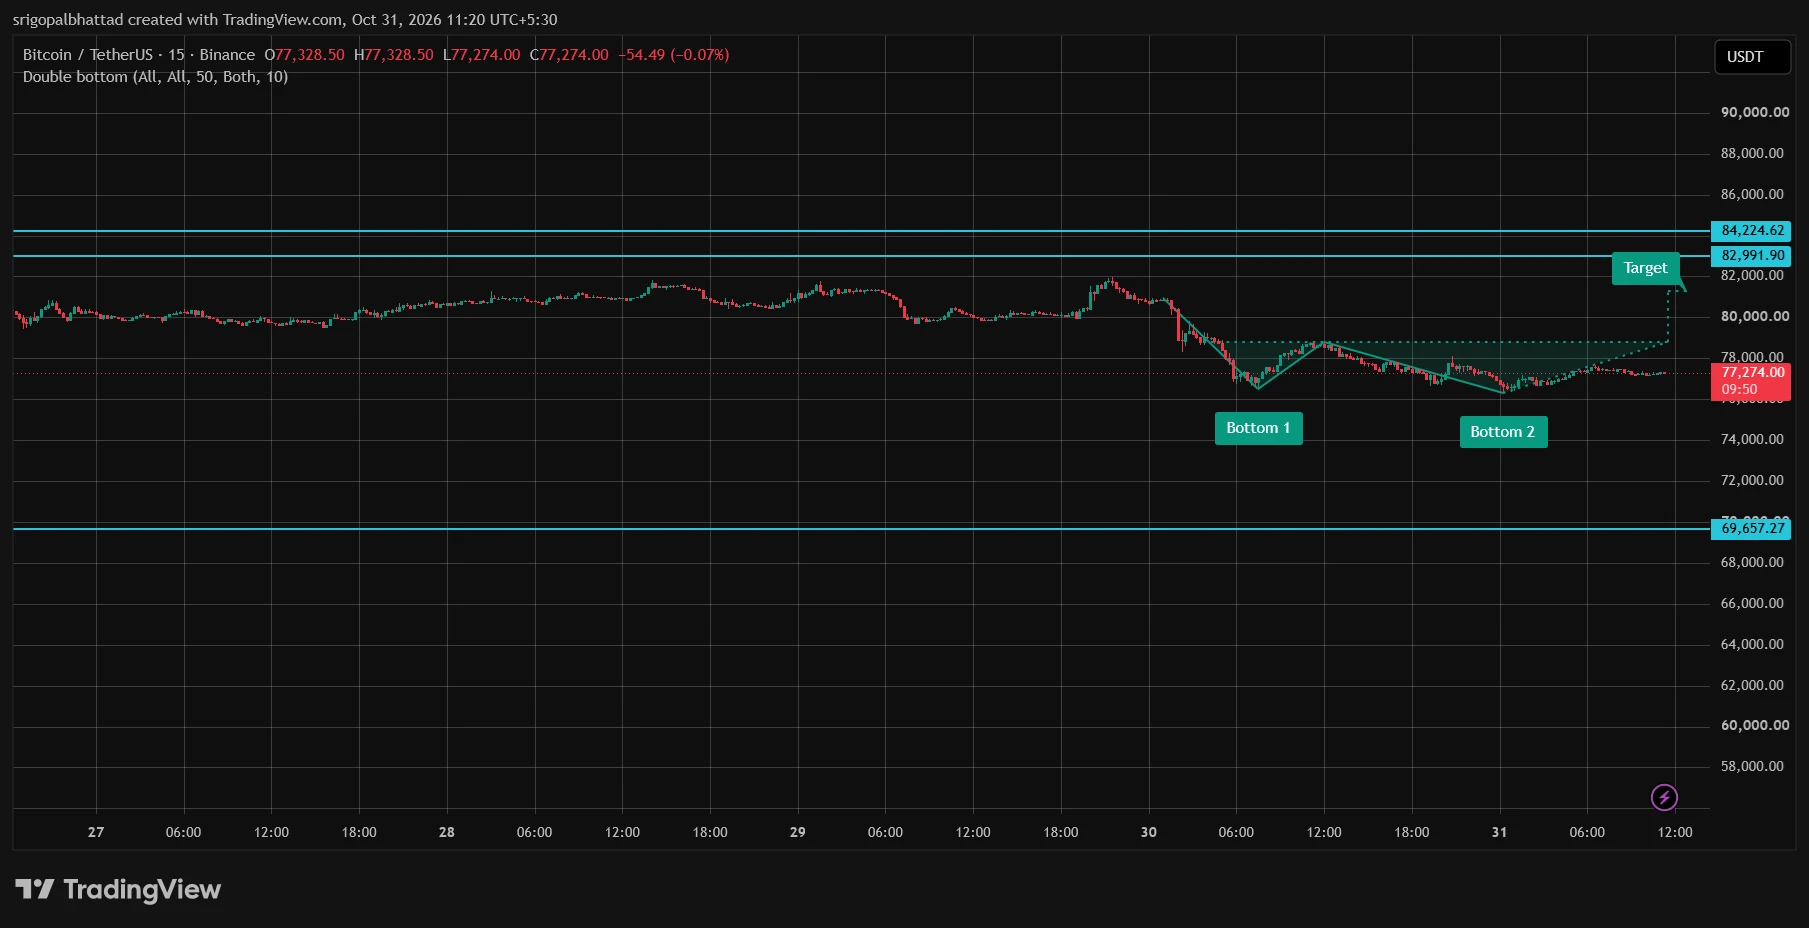
$BTC / USDT 🔥
Bitcoin is printing a potential Double Bottom formation on the 15-minute chart 👀 Buyers are defending the $75K–$76K support zone, showing signs of accumulation.
A breakout above $78.8K could confirm bullish momentum, opening the door toward $82,991–$84,224 📈
Bulls are slowly reclaiming control. A major upside move could be brewing! #BTC大跌
post-image
BTC-0.67%
$HYPE $HYPE is now positioning for a large short. Afterward, set a stop-loss at $92 and a take-profit at $80. Short now $HYPE 👇
post-image
HYPE+0.24%
Morning market update
live-cover
LIVE2,356
BTC Market Updates
live-cover
LIVE3,308
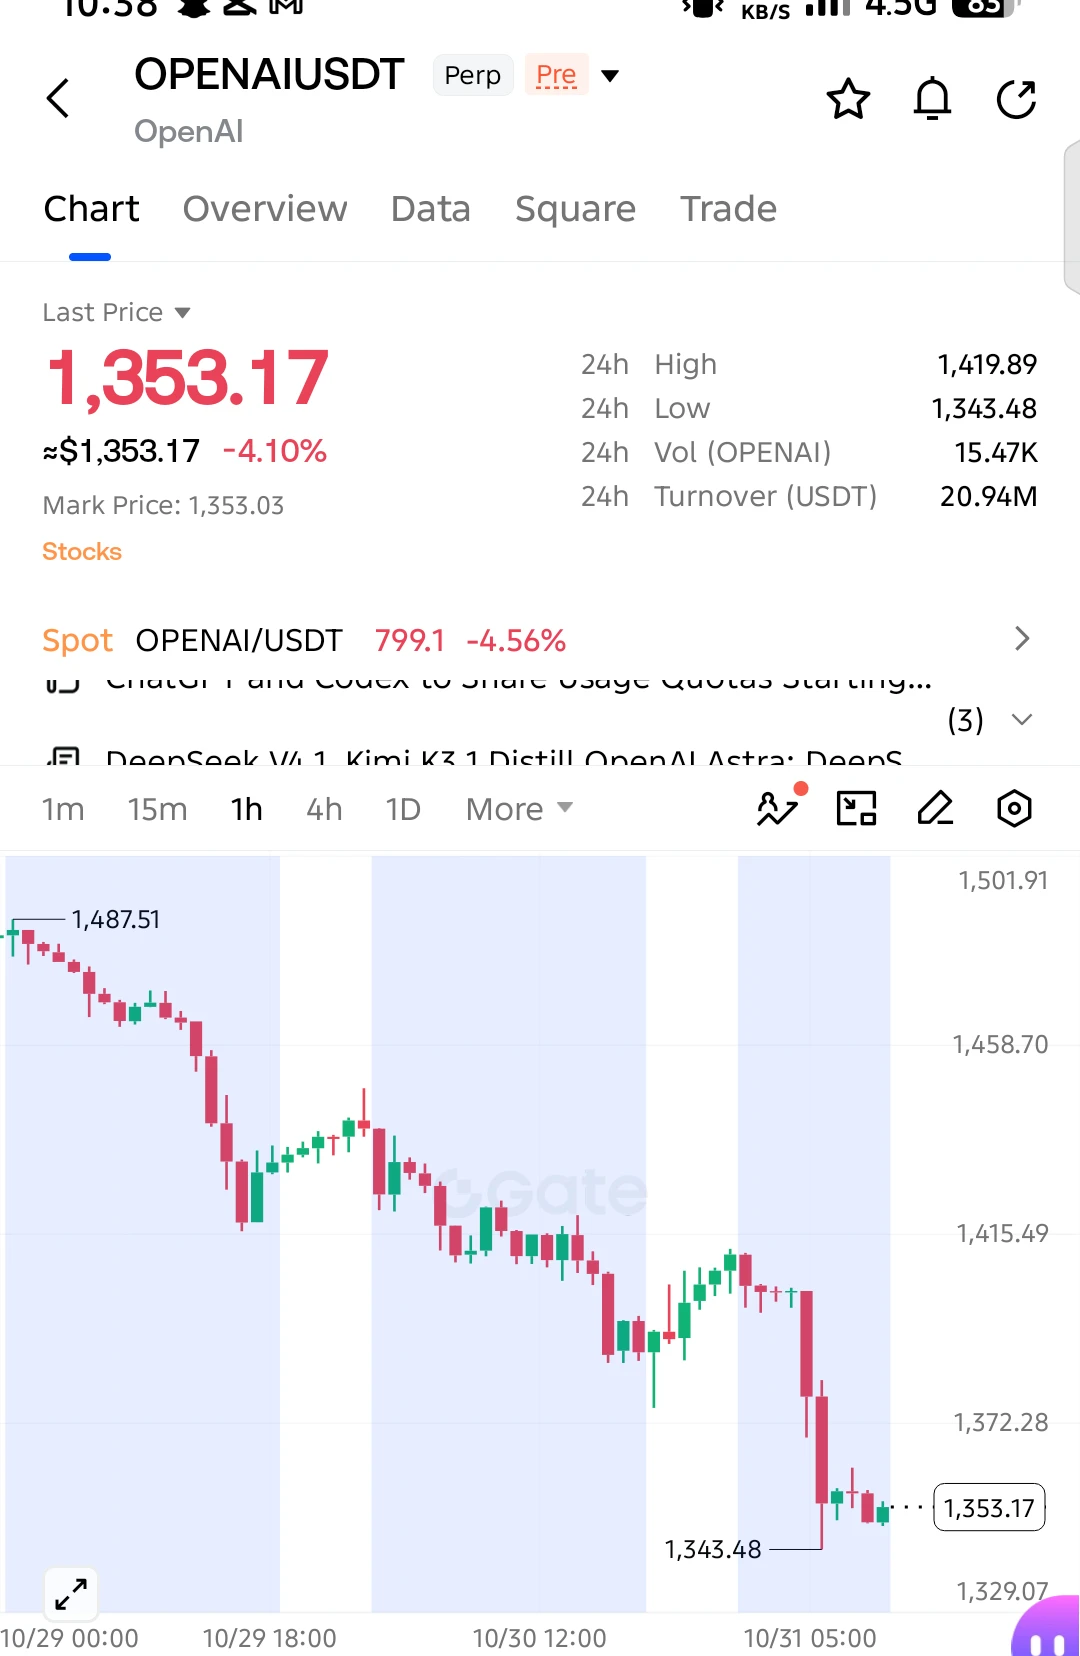
$OPENAI SHORT — SELLERS ARE IN FULL CONTROL!
Entry: 1353.17
SL: 1380.00
TP1: 1343.48
TP2: 1325.00
TP3: 1300.00
Final Target: 1270.00
$OPENAI is facing heavy selling pressure, guys! Buyers are struggling to defend support, while every recovery attempt is getting rejected. The bearish trend remains strong, and a break below 1343.48 could trigger another sharp sell-off. Bears have the upper hand!
post-image
OPENAI-0.04%
  • 3
10.31 Market Analysis
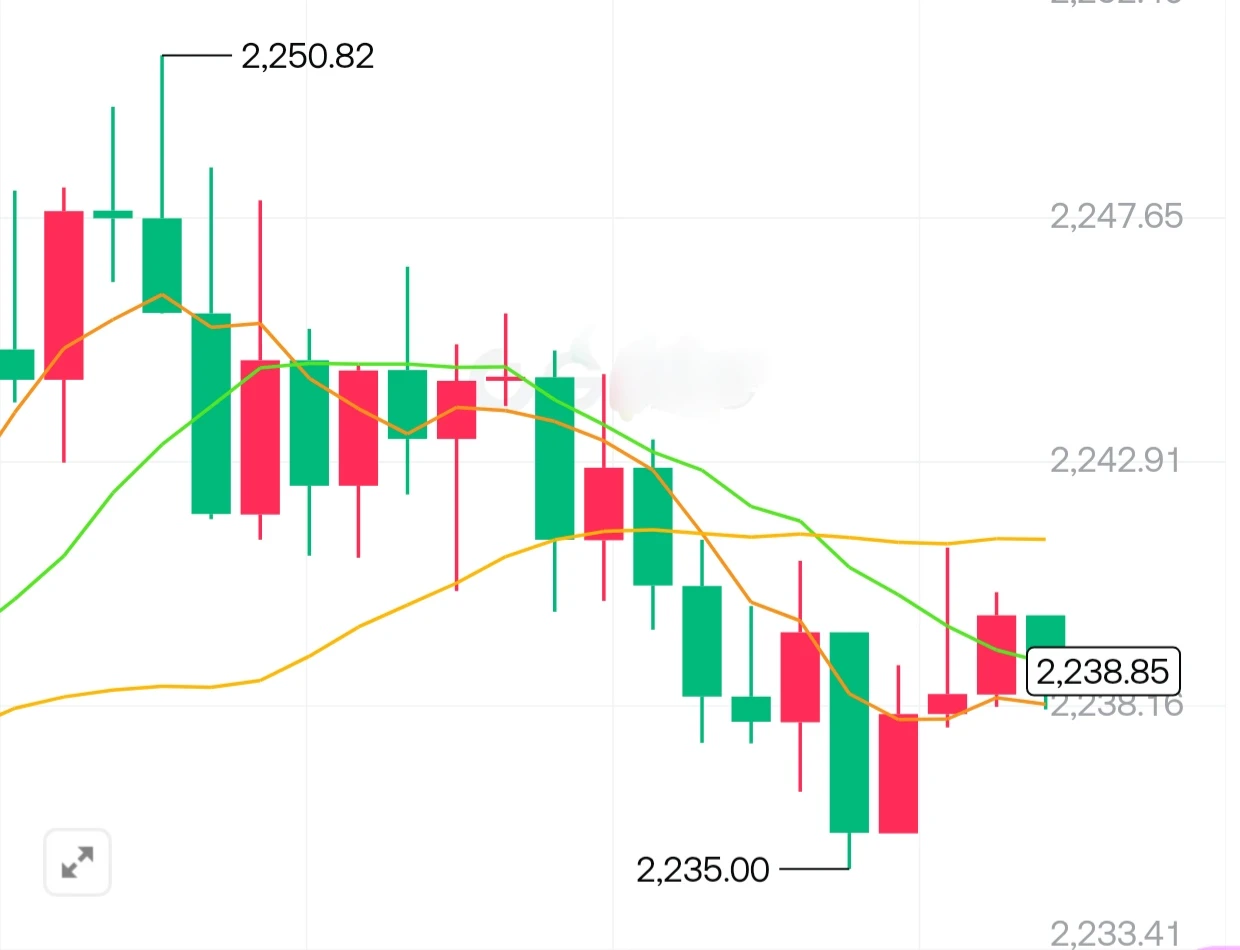
ETH Strategy Reference Setup
Rebound range: around 2250--2260
Level: 2300
First target: 2220, second target: 2170
The market is consolidating at low levels, with clear downtrends across all timeframes.
The daily chart closed with a solid bearish candle, retested the daily moving average, and broke below the range midpoint. If this level cannot be reclaimed, there is no confirmed bottoming signal.
The 4-hour chart shows a waterfall decline with consecutive bearish candles. After a brief pause, selling continued. Bulls lack the strength to counterattack, and the downtrend c
post-image
BTC-0.65%
ETH-1.23%
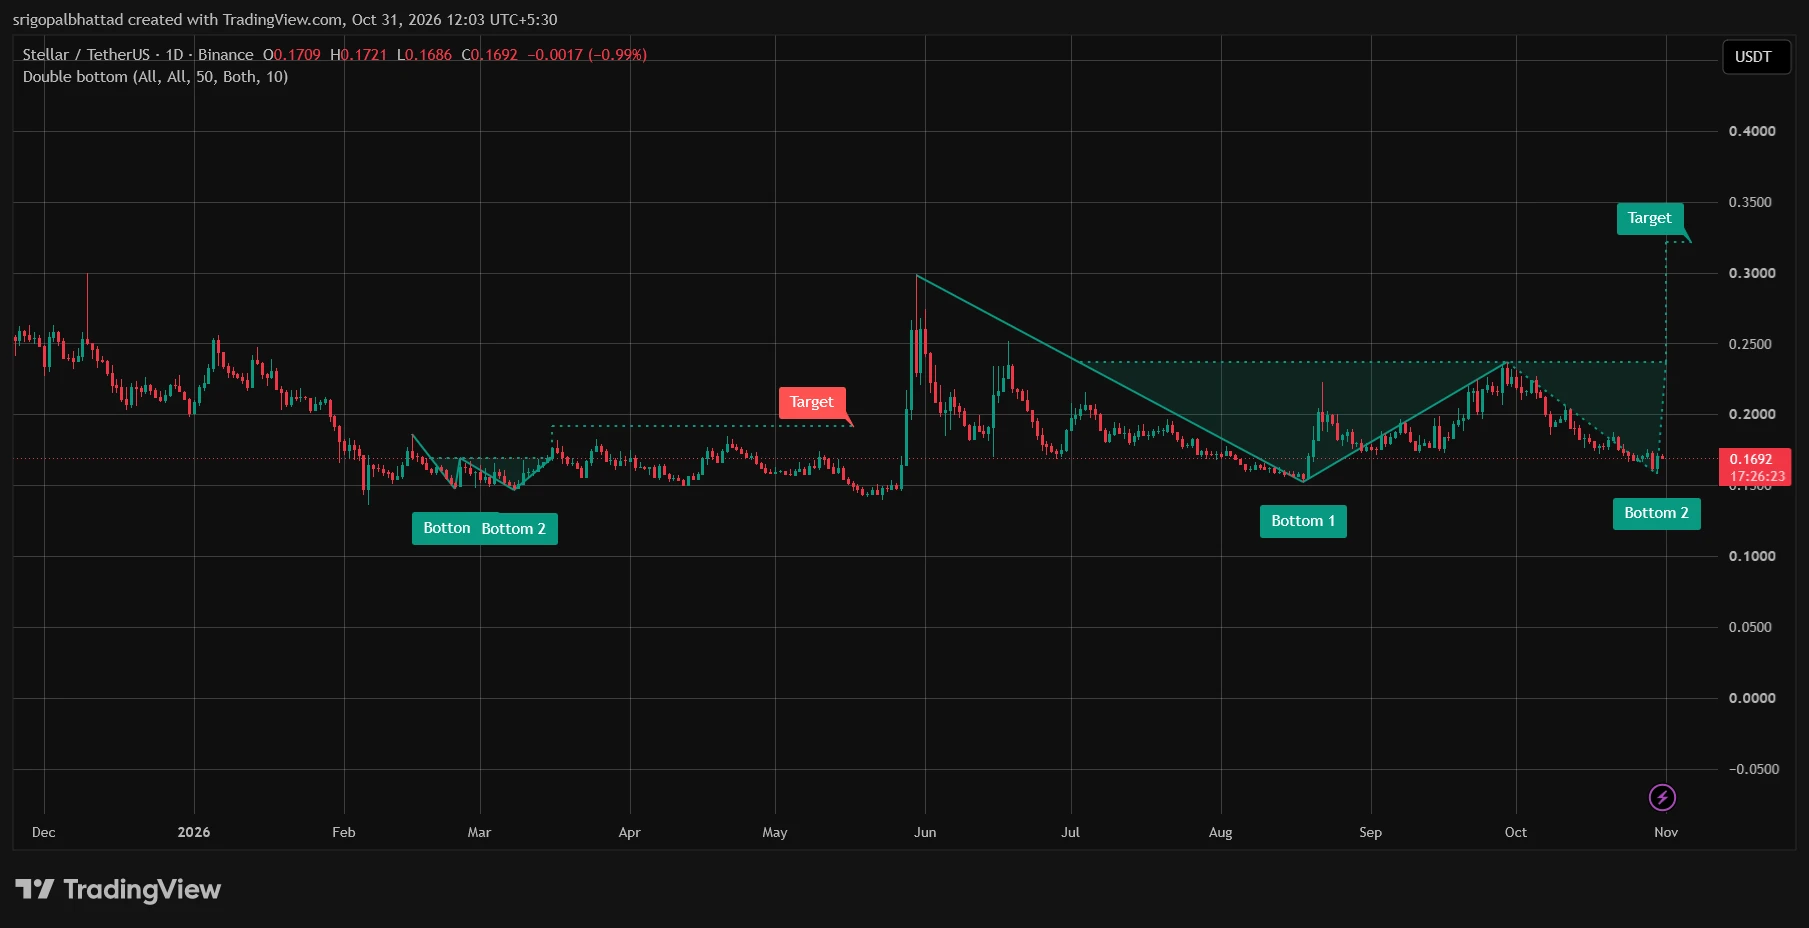
$XLM / USDT 🚀
Stellar is printing a potential Double Bottom formation on the daily chart 👀 Buyers are defending the $0.15–$0.16 support zone, showing signs of accumulation after an extended downtrend.
A breakout above $0.24 resistance could confirm a bullish reversal, opening the door toward $0.33 📈🔥
Bulls are attempting a comeback. A major upside move could be brewing!
post-image
XLM-0.64%
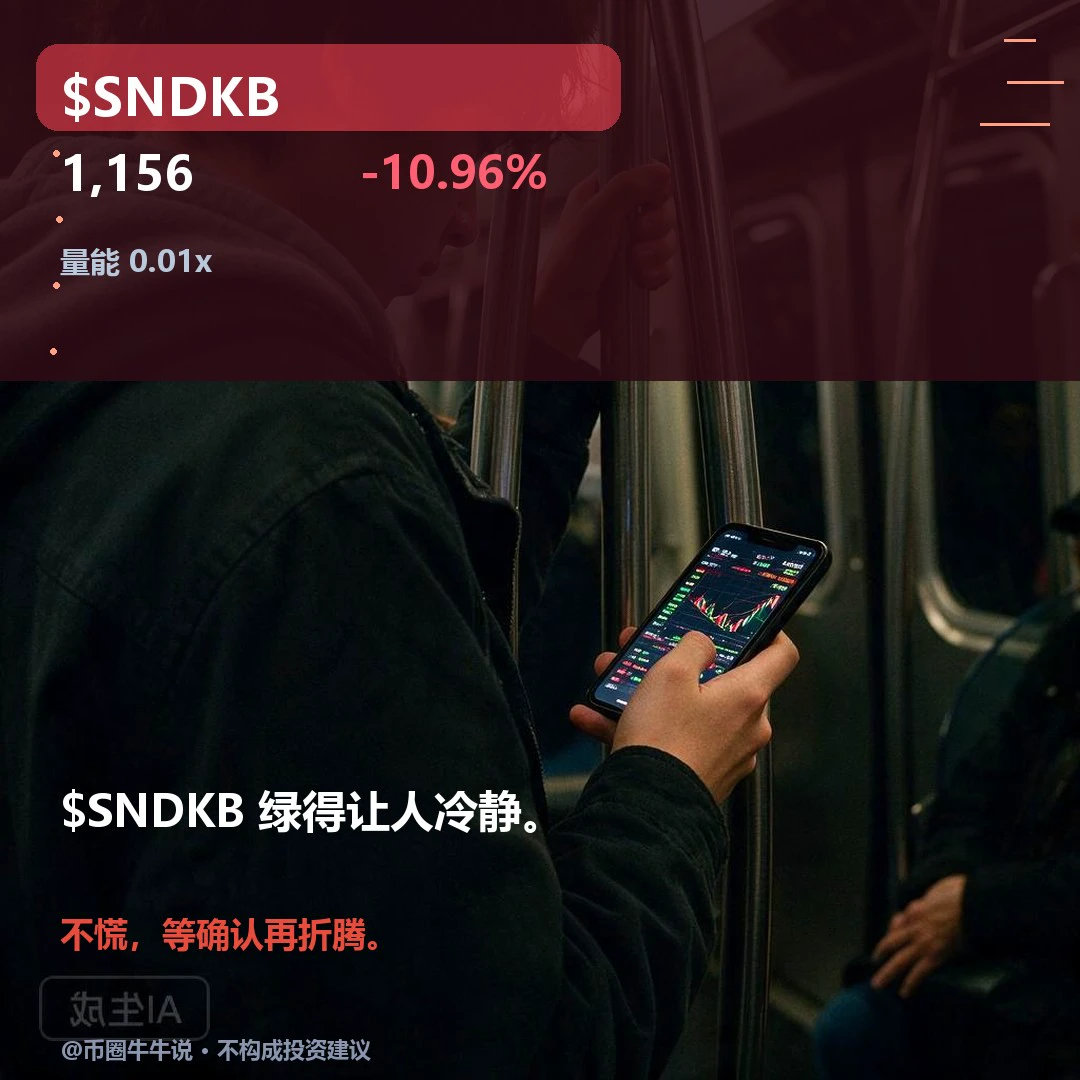
Divergence. The short-term rebound in $SNDKB has pushed the RSI into overbought territory, but the longer timeframe remains deeply oversold, so the signals from the two timeframes are inconsistent.
At 1,155.58, the price is not far from the 1,116.67 support, while hourly trading volume is extremely low, suggesting this rebound is more like a modest correction than a genuine recovery in participation.
The one-hour chart is already overbought, but the four-hour chart has yet to emerge from oversold territory. Can this rebound still be treated as evidence that the decline has bottomed? If short-t
post-image
#GateSquareHalloween
XAUUSD: Gold Faces Heavy Selling Pressure as $3,900 Breaks
Gold is under significant pressure, trading around $3,875 after falling to its lowest level in more than a year. The recent sell-off shows that even safe-haven demand is struggling against rising interest-rate expectations and forced market liquidations.
The biggest pressure comes from the Federal Reserve's hawkish stance, stronger US economic growth and persistent inflation. Q3 GDP grew 3.4%, while core PCE inflation reached 3.1%, strengthening expectations of tighter monetary policy. The technology-stock sell-of
post-image
XAU+0.38%
  • 5
  • 1
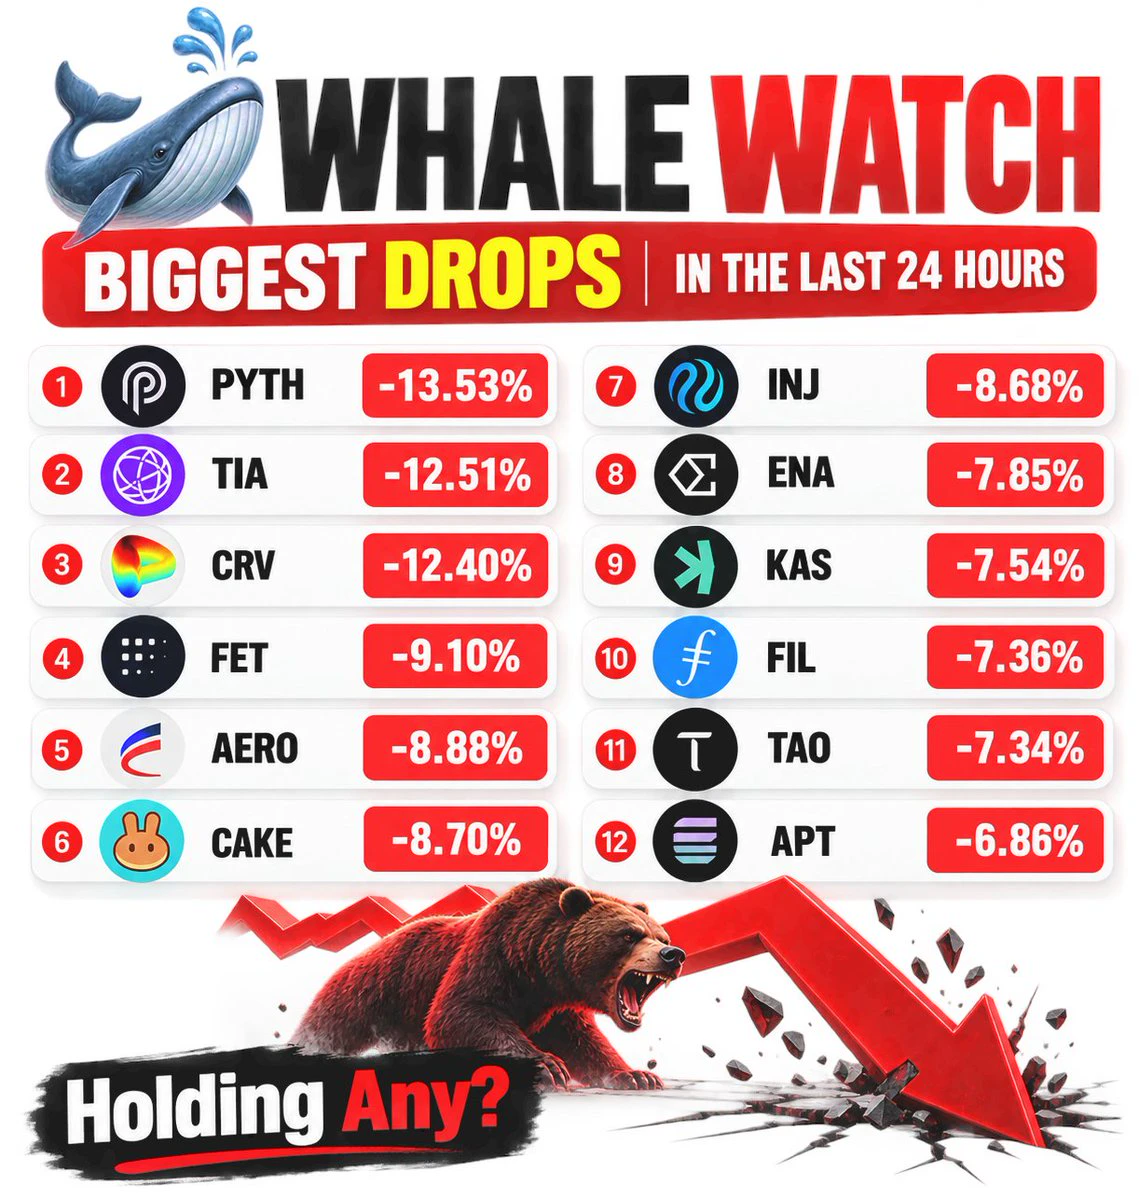
🐋 WHALE WATCH : Biggest drops in the last 24 hours
=> $PYTH -13.53%
=> $TIA -12.51%
=> $CRV -12.40%
=> $FET -9.10%
=> $AERO -8.88%
=> $CAKE -8.70%
=> $INJ -8.68%
=> $ENA -7.85%
=> $KAS -7.54%
=> $FIL -7.36%
=> $TAO -7.34%
=> $APT -6.86%
Holding any?
post-image
PYTH+3.23%
TIA-0.60%
CRV-2.21%
FET-1.52%
AERO-2.98%
  • 1
$OP $OP Facing strong resistance after a rapid rise! The hourly chart shows profit-taking pressure emerging after the price surged. Sellers entered around 0.1150, and continued weakness could push the price toward the 0.1100 area. A deeper pullback remains possible. Entry: 0.1148–0.1155 Take profit: 0.1100 Stop loss: 0.1175 Sell and trade $OP
post-image
OP-1.33%
I have now clearly realized that, unless a miracle occurs—that is, unless God wills it—I can't participate in the new Revenue Share program.
& I do strongly believe that unless X makes any refinements to the program, I and similar small accs would feel unmotivated and become less active.
If this is important for X, they will take corrective actions.
If not, X will become a strong-only platform that will surely contradict Elon's aim when acquiring X.
An old Friend of yours
post-image
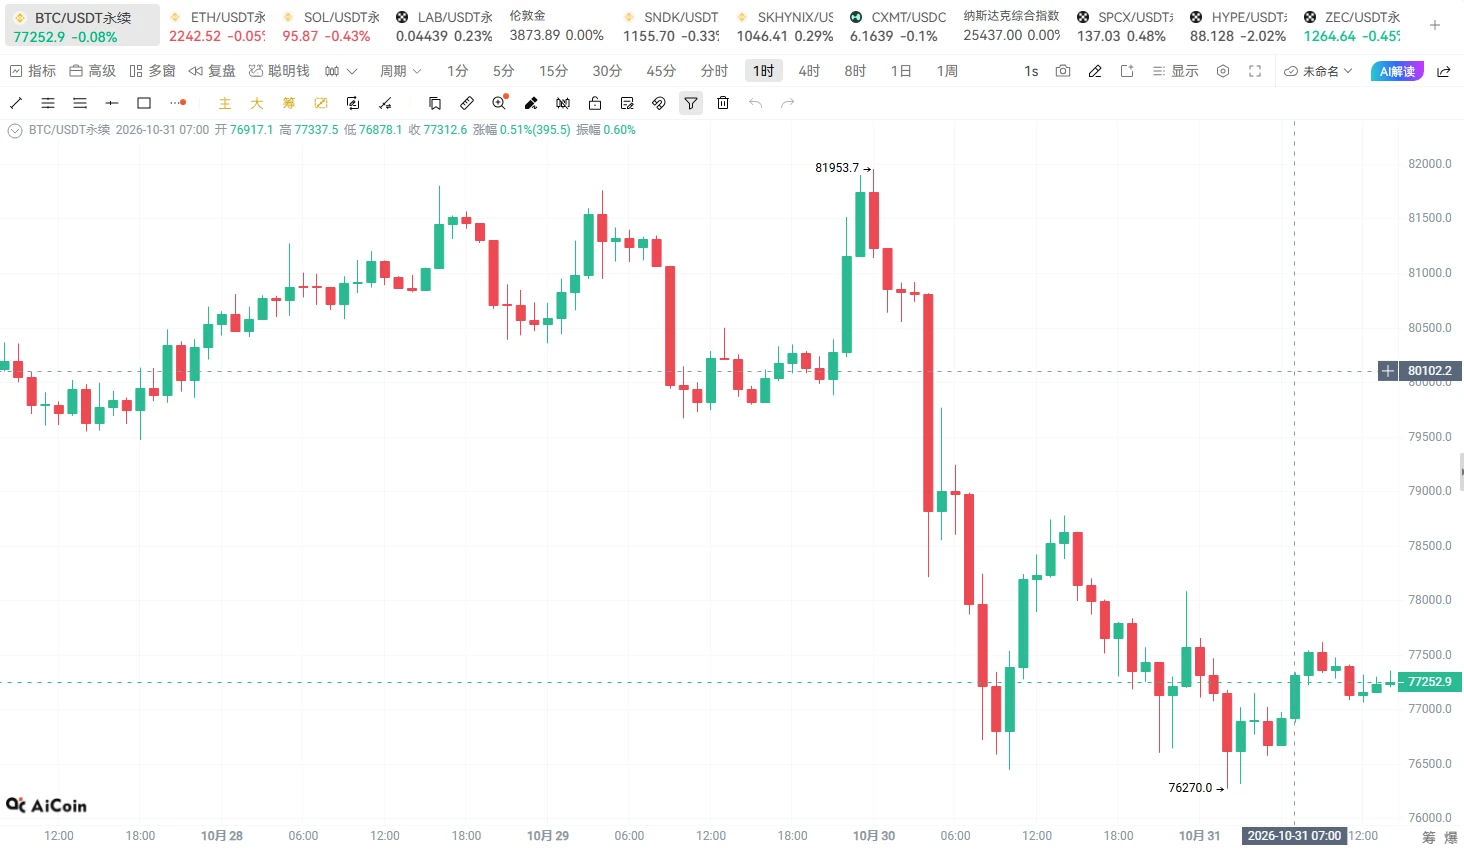
BTC | October 31 Trading Outlook
BTC has pulled back from 84,875 to a low of 76,270, with multiple previous support levels failing one after another. The overall structure has clearly weakened.
Price is currently consolidating at low levels. Although there has been some rebound, it has yet to reclaim the key resistance above.
My view: The rebound does not yet signal a reversal, so today I still prefer looking to short the rebound.
Short zone: 77,700–78,200
Stop-loss: Above 78,800
Targets: 76,500, 75,800
After this decline, it’s not suitable to blindly chase shorts at low levels. The key is to
post-image
BTC-0.65%
ETH-1.23%
Gotta hand it to the college girl with those eyes—the water’s almost spraying her in the face.
#Gate广场万圣节 Criteria for Selecting Quality Altcoins
Three things matter most when evaluating quality altcoins: whether the project can generate revenue, whether the token entitles holders to returns, and whether the valuation and token distribution are reasonable. Picking based only on market cap or how much a coin has fallen can easily lead you to buy a recently launched token with high inflation.
1. First, screen for business quality
People use the product: prioritize active addresses, trading volume, and protocol revenue. For DeFi, also look at total value locked, meaning the amount of funds
post-image
RWA-0.39%
BTC-0.67%
ETH-1.26%
  • 2
Load More

Join 40 M users in our growing community

⚡️ Join 40 M users in the crypto craze discussion

💬 Engage with your favorite top creators

👍 See what interests you

Trending Topics

BTC大跌

243.79k Views39.57k Discussing

$BTC briefly fell below $77,000 and remains under pressure around the $77K zone, with its 24-hour decline still above 4%. With risk appetite weakening and Fed uncertainty rising, where is the next key support after losing $80K?

IntelBeatsEarningsButStockPlunges

18.19k Views808 Discussing

StrategySTRCNears100ParValue

22.08k Views4.06k Discussing

View More