Square
Following
Hot
News
Profile
Share your thoughts
placeholder
Article
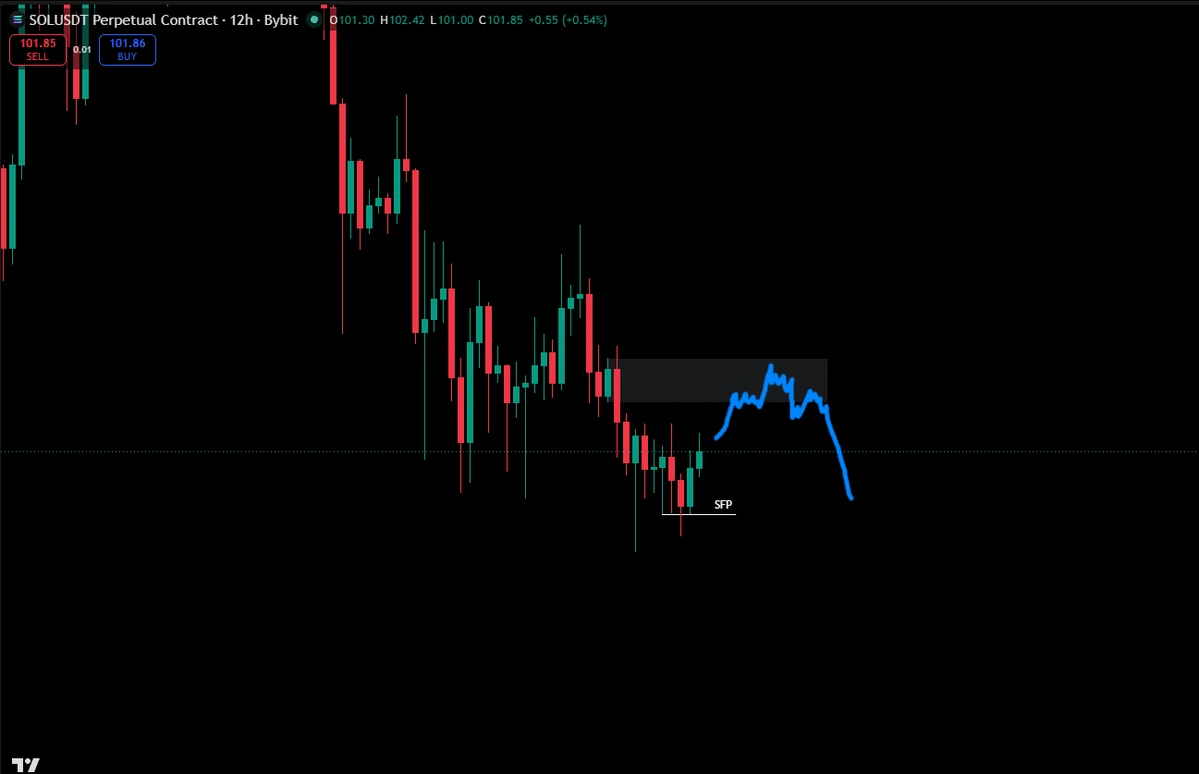
solana:So11111111111111111111111111111111111111112 has swept the lows and is now moving up.
Unfortunately, I missed the long.
I think the draw is now up into resistance at $103.40-$104.90.
post-image
SOL-0.77%
Shorts capitulate en masse! Is this BTC rally a “dead-cat bounce” or the prelude to a reversal? The rationale behind the rally and whether it signals a “reversal”: This rally was driven mainly by expectations of IPOs from AI giants, which ignited U.S. tech stocks and lifted risk assets, alongside a short squeeze fueled by large-scale liquidations. But the charts show BTC volume dwindling near 81200, while the 82400-83000 area above is a dense zone for short liquidations. With no sustained surge in spot volume to support it, this is a corrective rebound, not a reversal. Trading strategy: Aggres
BTC-0.65%
Trenches
TTWO
T
bade
b
TTWO
TTWo...FbKo
Market Cap
$.
Change
.
24h Vol
$.
Holders
.
BNCB
B
bade
b
BNCB
0x49...ec3f
Market Cap
$.
Change
.
24h Vol
$.
Holders
.
DJT
D
bade
b
DJT
DJTu...xvoF
Market Cap
$.
Change
.
24h Vol
$.
Holders
.
ZIG
Z
bade
b
ZIG
0x8c...1145
Market Cap
$.
Change
.
24h Vol
$.
Holders
.
STONK
S
bade
b
STONK
6GmA...UNgx
Market Cap
$.
Change
.
24h Vol
$.
Holders
.
$SNDK There’s a whale trader called ning in this market rally who didn’t chase the highs at all. They built up their long positions early, down in the deep.
Specifically, this whale put nearly 500,000 U into longs at 1297 in one go. They’re now sitting pretty on over 20,000 U in unrealized profits, and they still hadn’t stopped by noon today, continuing to add to their position.
The shorts, by contrast, are in a bad way—their average entry price of 1334 has long since been breached, and their massive short positions worth 170 million are now all underwater. Only 21.5% of shorts across the mark
post-image
SNDK-0.18%
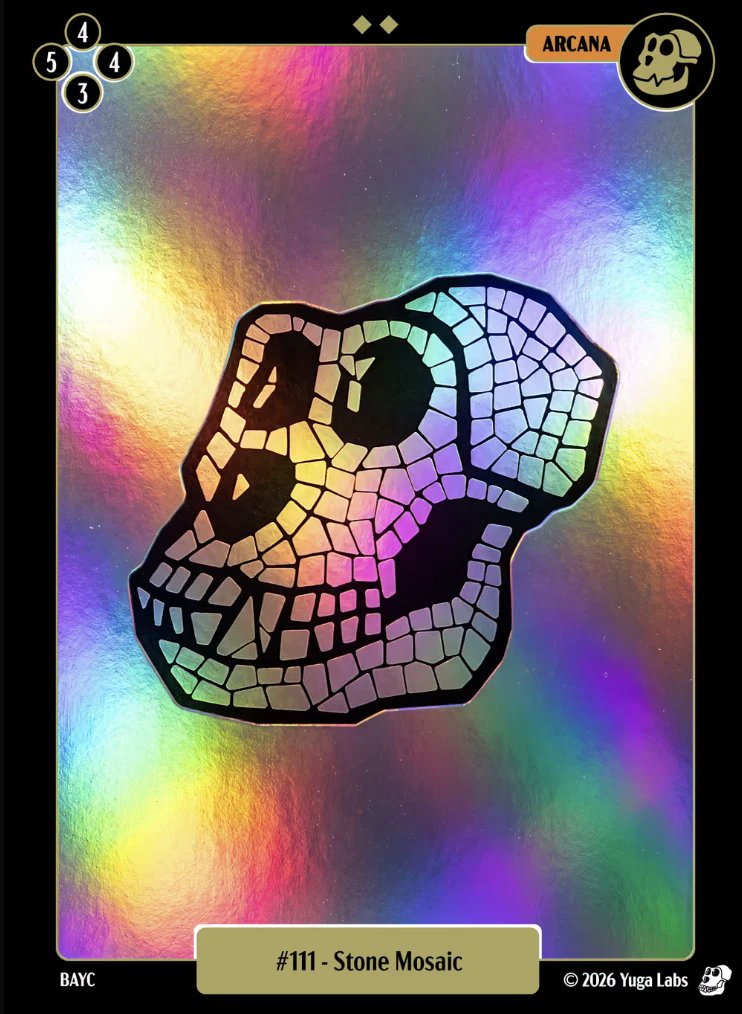
MUDWATER Card #111
Stone Mosaic - Foil
This will flip some of the prestige and legendary cards
1 sol for this skull is free as fuck
Bookmark this
post-image
SOL-0.77%
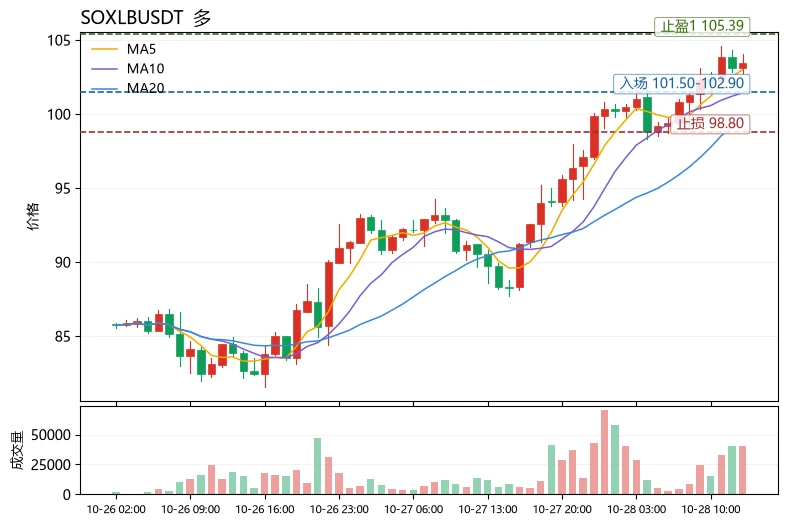
$SOXLB Current price 103.47, 24h gain +15.57%, trading volume 58.2M USDT. In terms of moving averages, MA5=102.984 has moved above MA20=99.6715, and the short- and medium-term moving averages are beginning to form a bullish alignment; however, RSI has risen to 73.0, entering overbought territory, and although the MACD histogram at +0.09695 remains bullish, signs of waning momentum should be watched. Bollinger Bands [93.9534, 105.39]: the price is trading near the upper band, with 105.39 presenting the first resistance; a breakout would open up further upside. Below, MA5 at 102.98 is short-term
post-image
SKHYB
SKHYBSK Hynix
Pump.Fun
MC:$3.08KHolders:1
0%
UNI+3.05%
BTC Market Update
live-cover
LIVE1,715
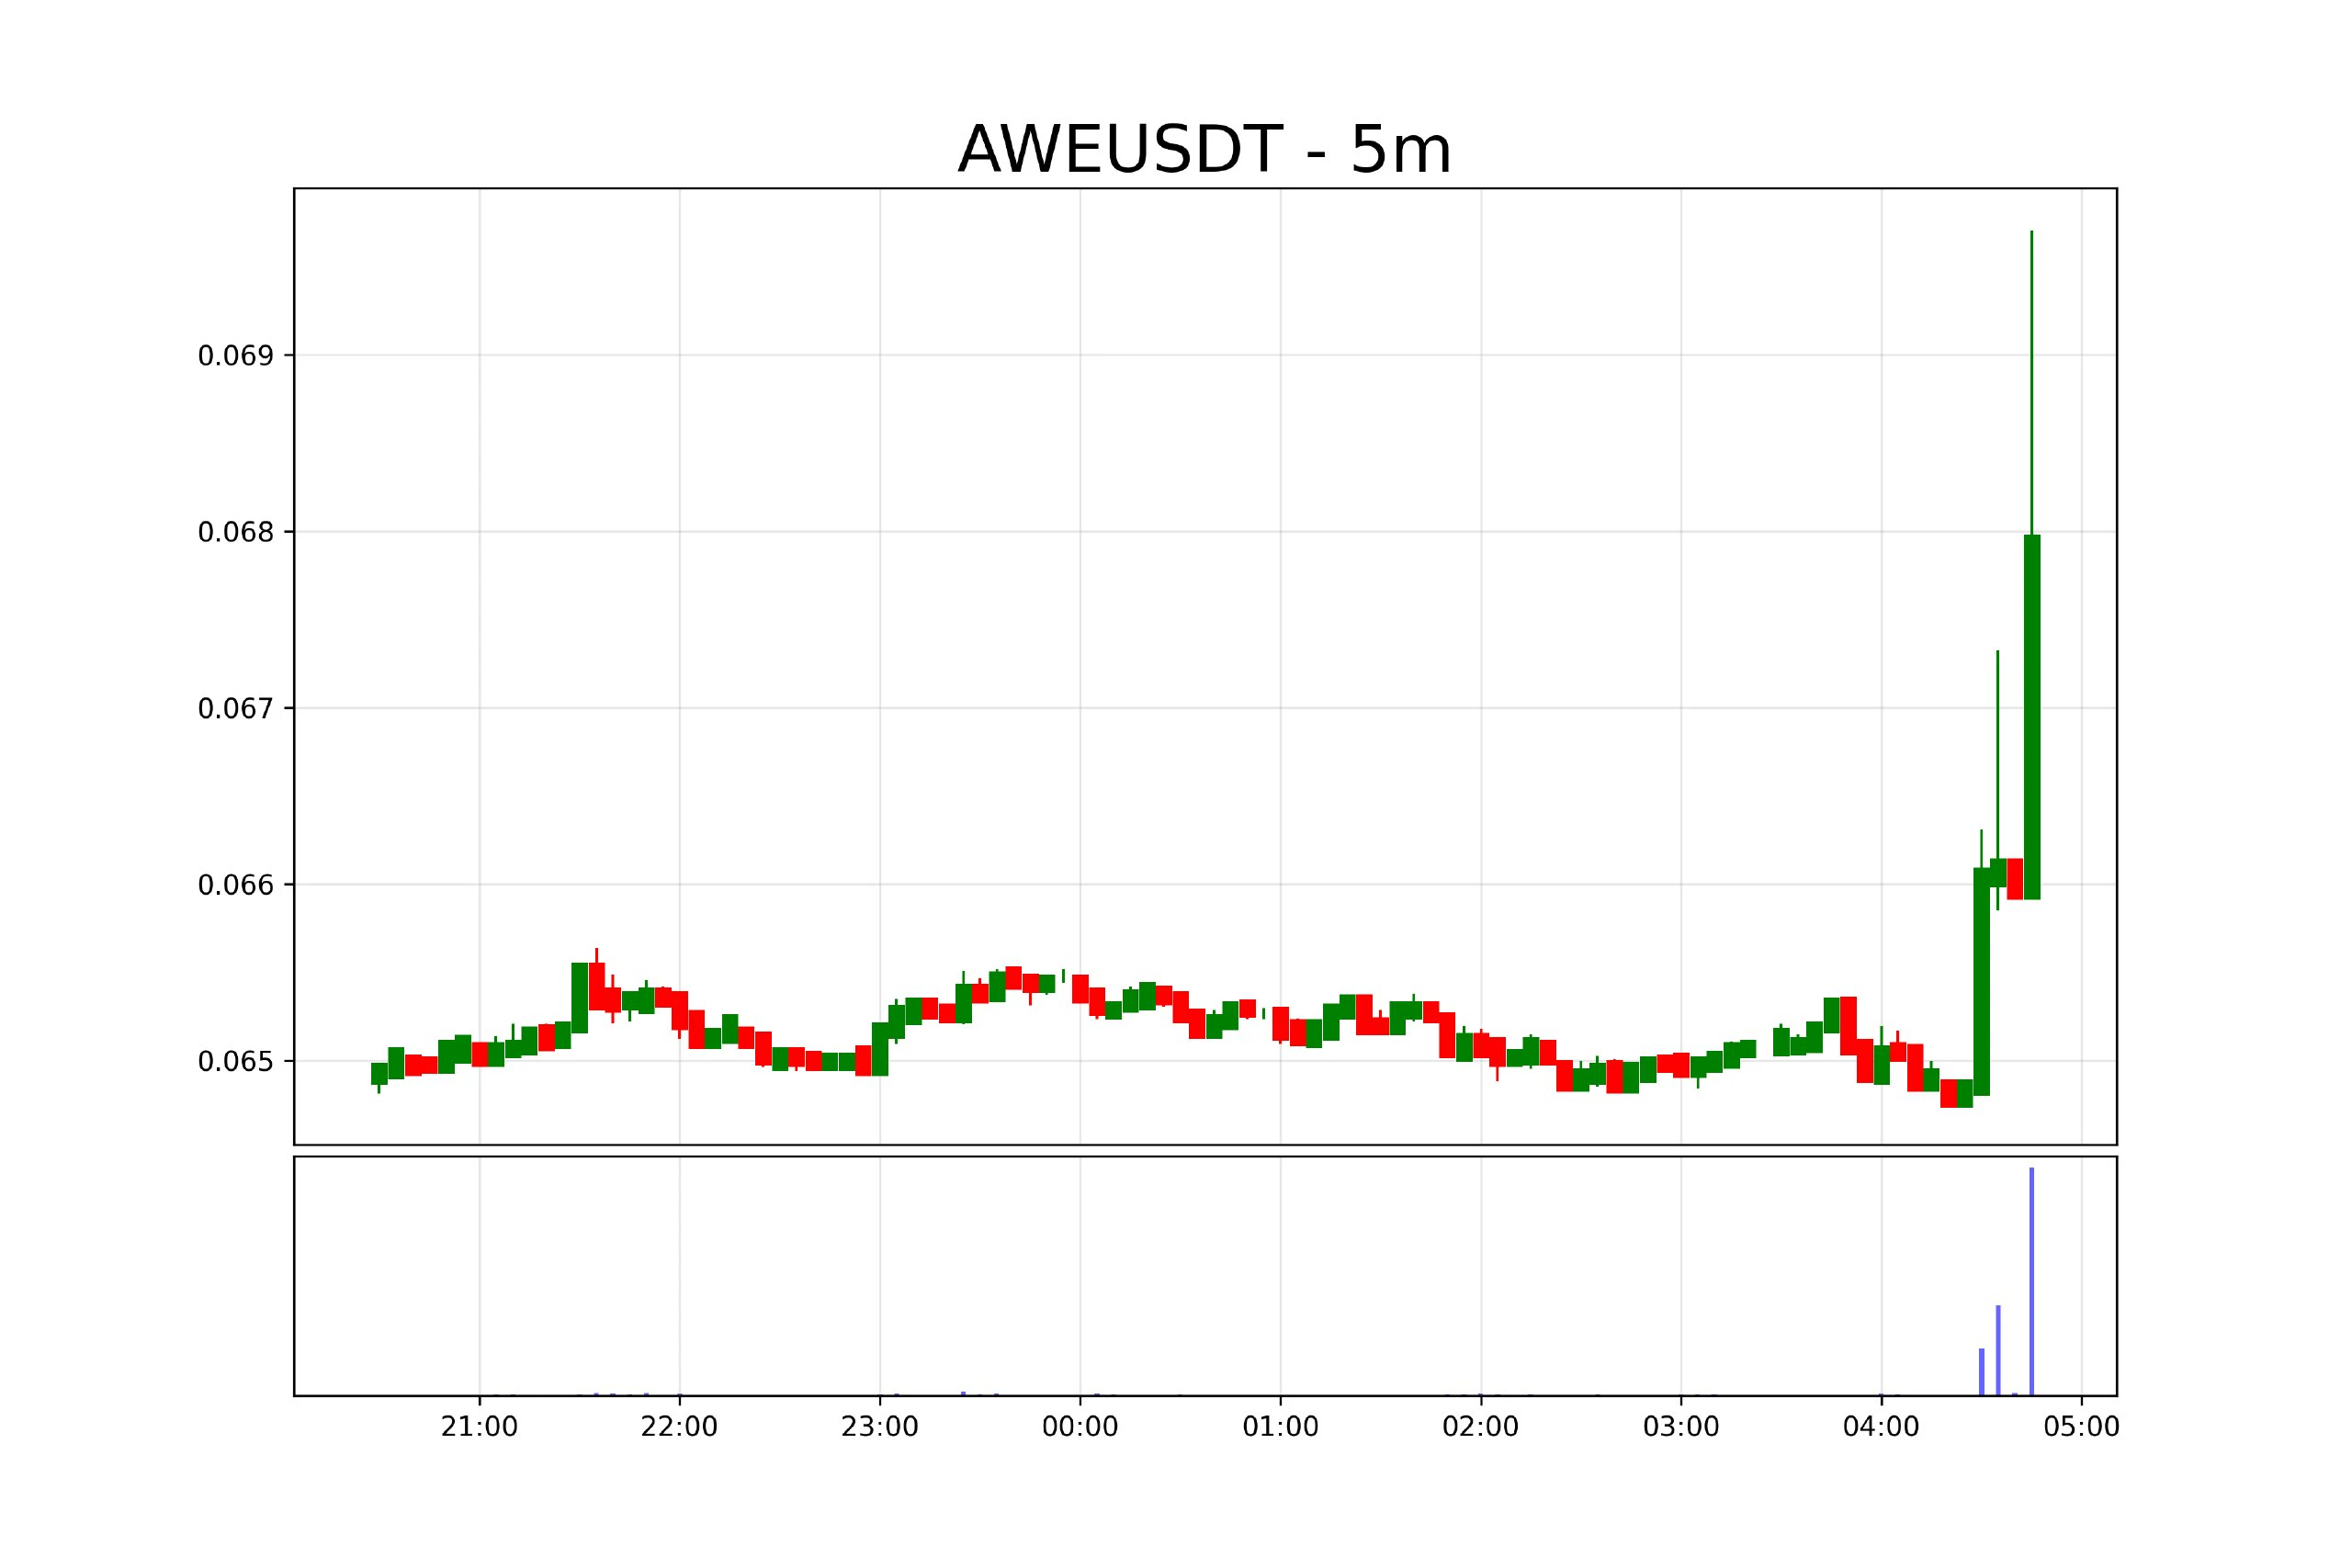
$AWE USDT is showing renewed market activity, with volume jumping 1,470.9% and price gaining 4.5% over 24 hours. Currently trading at $0.06794, the token could be approaching a key decision zone as buyers attempt to extend the recovery.
📊 Key Technical Levels
Support: $0.0655–$0.0665
Resistance: $0.0690–$0.0710
Next Target: $0.0725–$0.0750
Breakout Trigger: A strong close above $0.0710
Risk Level: A move below $0.0655 could weaken the setup.
🔥 VIP Outlook: Bullish continuation becomes more attractive if price clears resistance with sustained volume. If sellers defend the upper zone, expect p
post-image
AWE-1.45%
Is Google’s AI Making More Money but Burning More Cash? Is This Investment Worth It?
$GOOGL Google will report Q3 earnings after the U.S. market closes tonight. The market expects revenue of about $128 billion, up 25% year over year, while Google Cloud revenue is expected to reach $29.16 billion, up 92.3%. These are all market expectations ahead of the earnings report.
I think the biggest question for Google now is whether AI can really generate profits. The company’s full-year capital expenditure guidance is as high as $195 billion to $205 billion, and investment continues to grow. No matter
post-image
GOOGL+1.15%
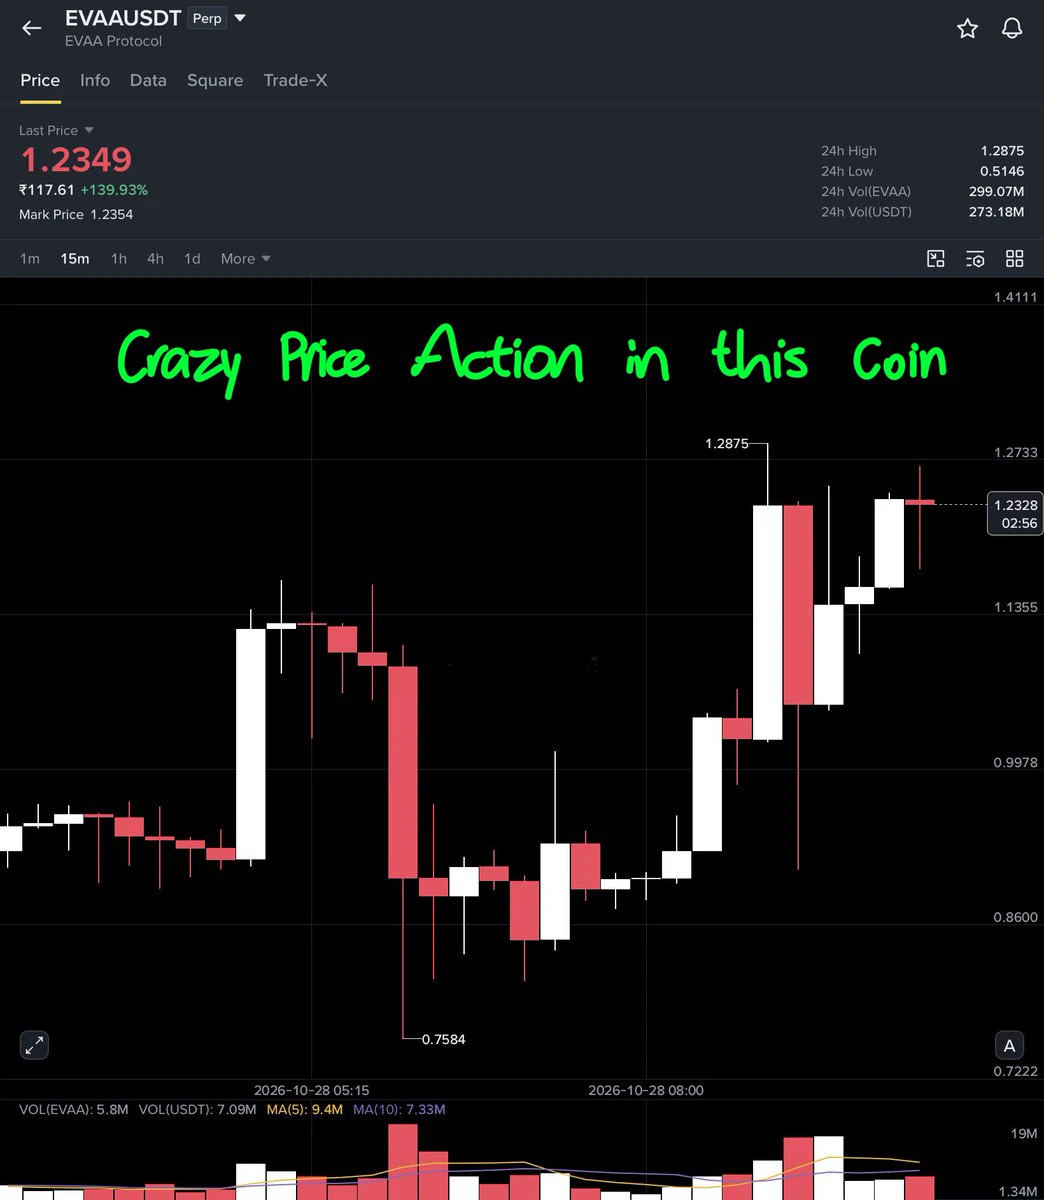
BE CAREFUL WITH $EVAA , FRIENDS!
THIS COIN IS CRAZY VOLATILE!
Just look at this price action!
Within the past few hours,Price dropped sharply toward $0.758 after trading around $1.16, then bounced back above $1.20. Now it’s trading near $1.23, with 15-minute candles showing massive swings.
This is not a coin to trade blindly. One wrong entry can wipe out your profits.
Here’s my trading plan:
If EVAA breaks above the recent high at $1.2875 and sustains the breakout, I’m watching these targets:
Targets - 1.31, 1.35, 1.40, 1.50, 1.70
Stop-loss: 1.20
But if price loses $1.04, bearish momentum co
post-image
EVAA-0.49%
  • 1
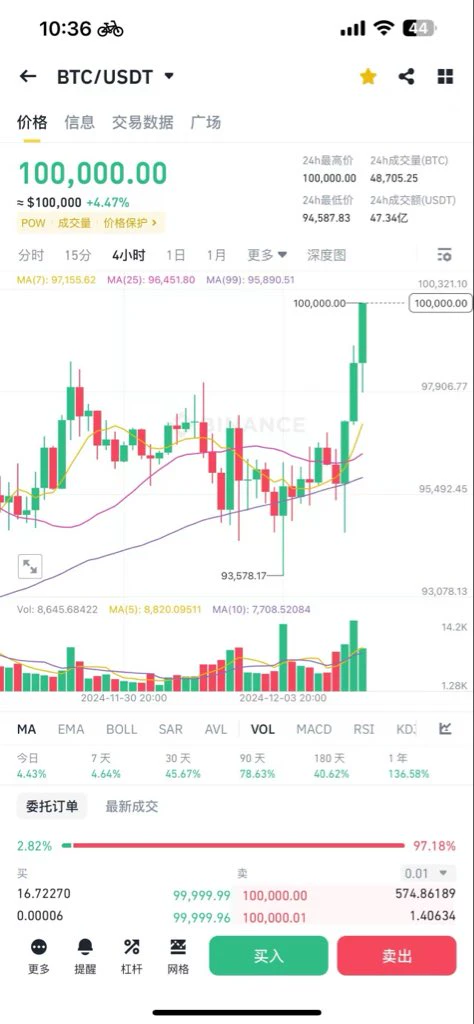
When BTC just broke through 100k $BTC
When will it hit the next 100k? What year, month, and day???
post-image
BTC-0.67%
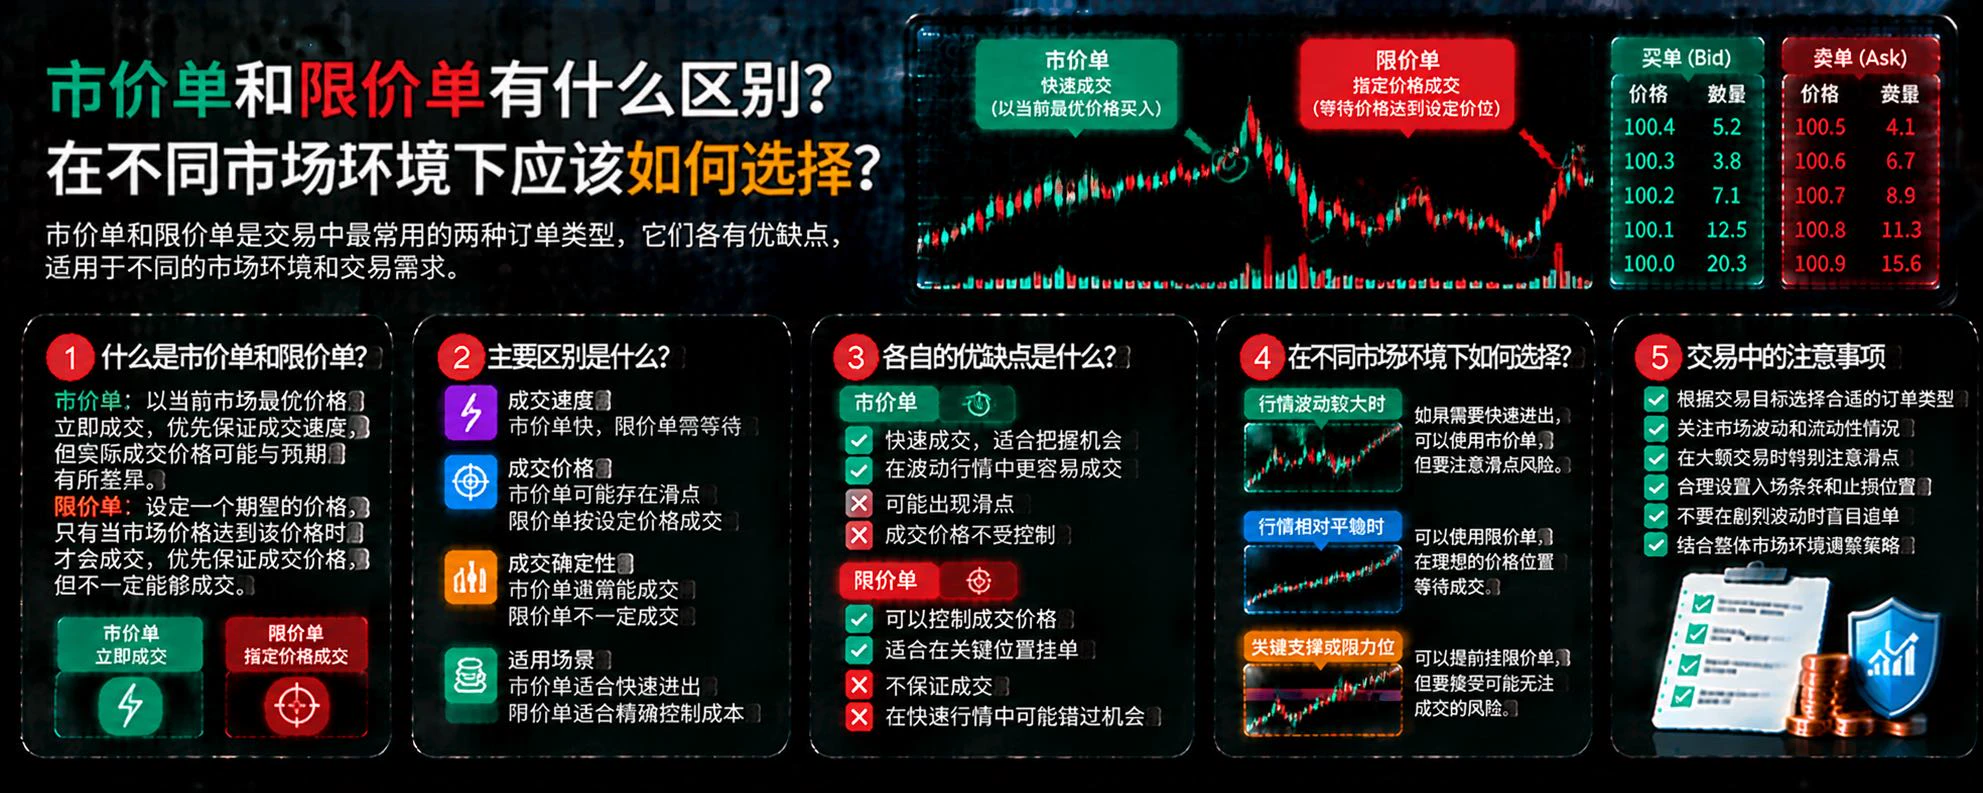
What is the difference between market orders and limit orders? How should you choose in different market conditions?
In cryptocurrency trading, the order type you use affects not only how quickly your trade executes but also the actual execution price. Market orders and limit orders are the two most common order types. Understanding the difference between them can help reduce unnecessary trading costs.
First, what is a market order?
A market order is an order that executes as quickly as possible at the prices currently available in the market. Its advantage is that it can usually be filled qui
post-image
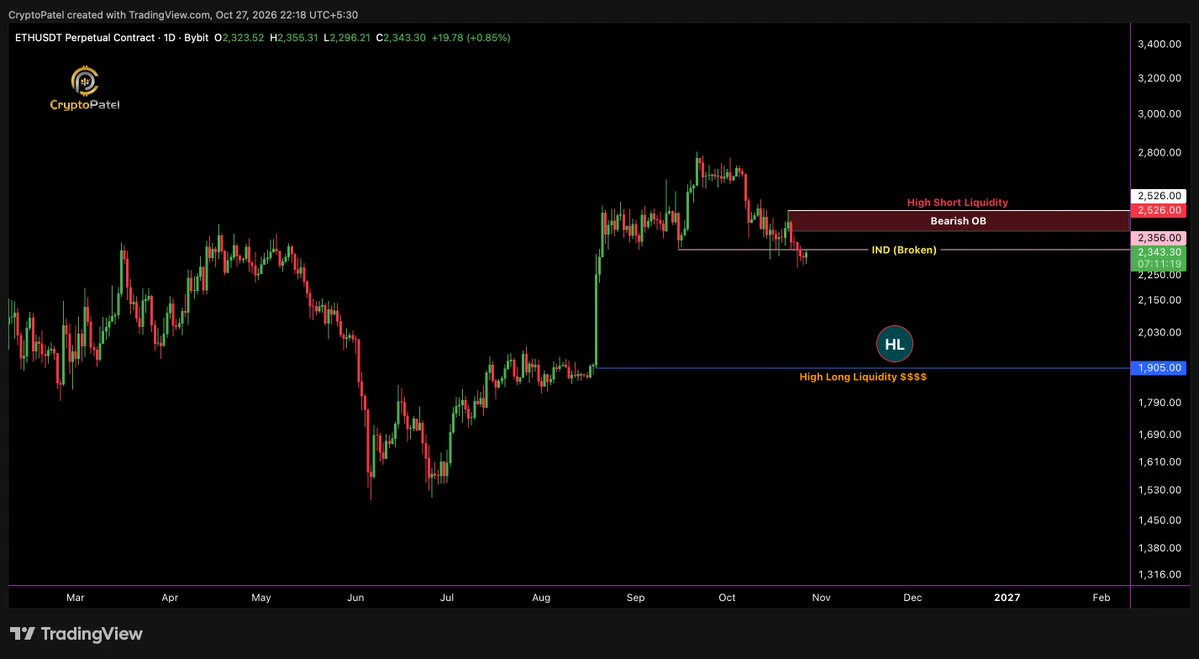
$ETH : I'M WATCHING THE LIQUIDITY, NOT CHASING THE CANDLE.
🔻 Below: $2,356 (Swept) / $1,905
🔺 Above: $2,526 (Bullish Above Toward $3K/$5K)
A sweep alone won't trigger my bias. I want to see how price reacts after taking liquidity.
Reclaim + structure shift = confirmation to watch.
No confirmation, no forced trade.
post-image
ETH-1.26%
🔹AI Stocks Take Off Ahead of the Fed Decision! The Semiconductor Index Jumps 3.6 and CoreWeave Surg
live-cover
LIVE2,719
SK Hynix’s earnings came out during the overnight session, and the entire memory sector surged. Taking this opportunity, I’ll share my view again:
Wall Street is under orders to pump the market right now. It fell too fast before, so technically this is a rebound testing resistance; it actually has nothing to do with earnings. So many companies beat earnings expectations last week, and didn’t their stocks still crash?
At the neocloud level, Wall Street is temporarily ignoring their CDS and probability of bankruptcy, as well as financing risks. Is it because these risks really don’t exist?
At th
TOKEN-0.16%
MSFT-0.21%
SOXL+11.61%
Institutions are openly buying the dip! $BTC Will the whales still wick down to liquidate longs?
Be greedy when others are fearful—the chips at the bottom are always blood-soaked!
Analysis: On the news front, institutions are accumulating at 80K, influencers are calling the bottom at 94K, while retail traders are bearish. The 1-hour outflows are whales playing dead. Look at the liquidation map: 80,000-80,500 below is packed with long positions ready to be liquidated, while short fuel starts building above 81,500. The whales have a cunning plan: before the Fed rate decision, wick down to liqui
post-image
BTC-0.67%
$useless long
8R
sl: $0.16415
Tp: $0.18717
USELESS-14.68%
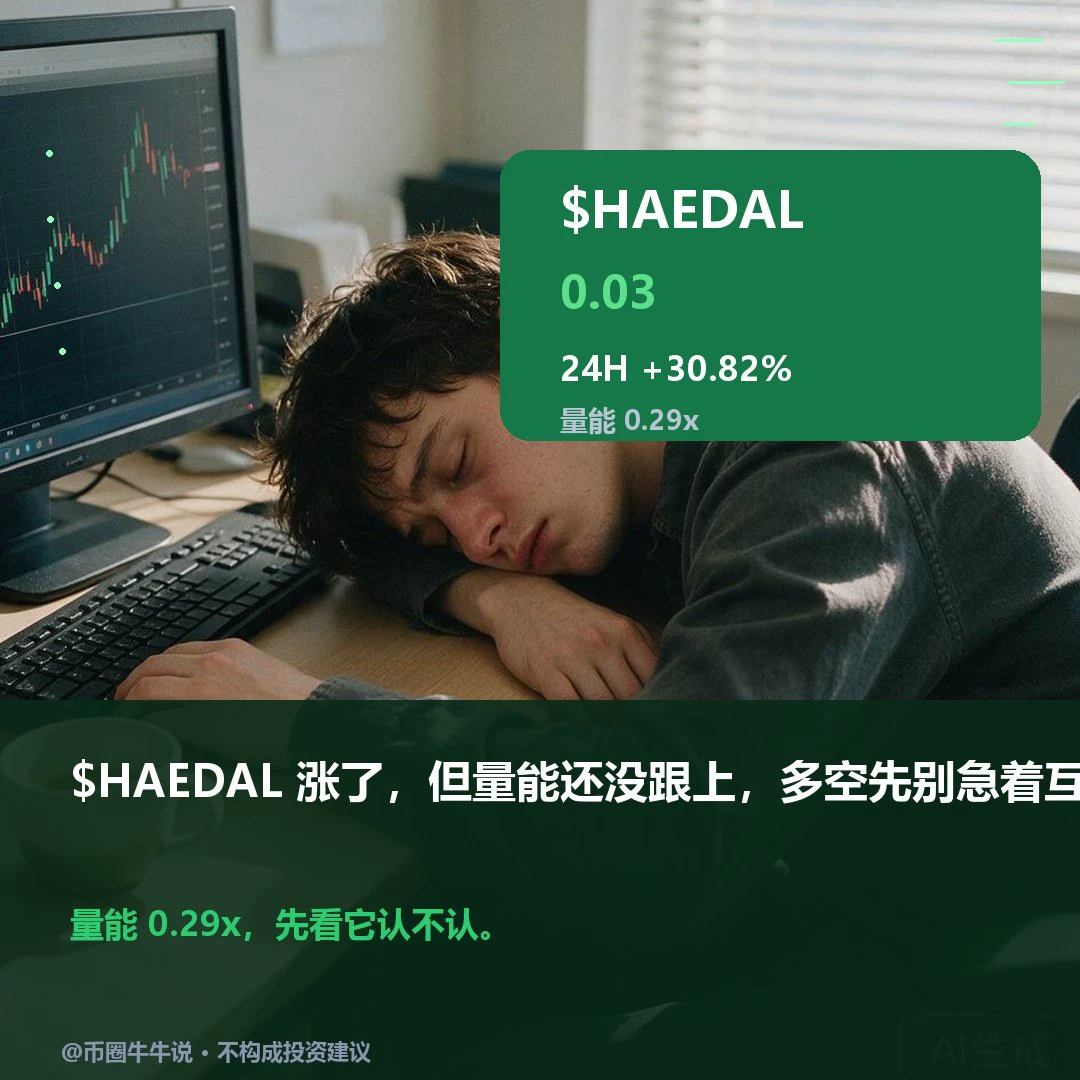
$HAEDAL Currently at 0.02946, up 30.82% over 24H (range: 0.02214–0.03395). The 1H trend is strong, with an RSI of 55; the 4H trend is strong, with an RSI of 80. If it breaks above 0.03395 decisively, watch for further upside; if it falls below the 0.02223 support, the short-term structure may weaken. Market volatility is high; for observation only.
post-image
HAEDAL+5.59%
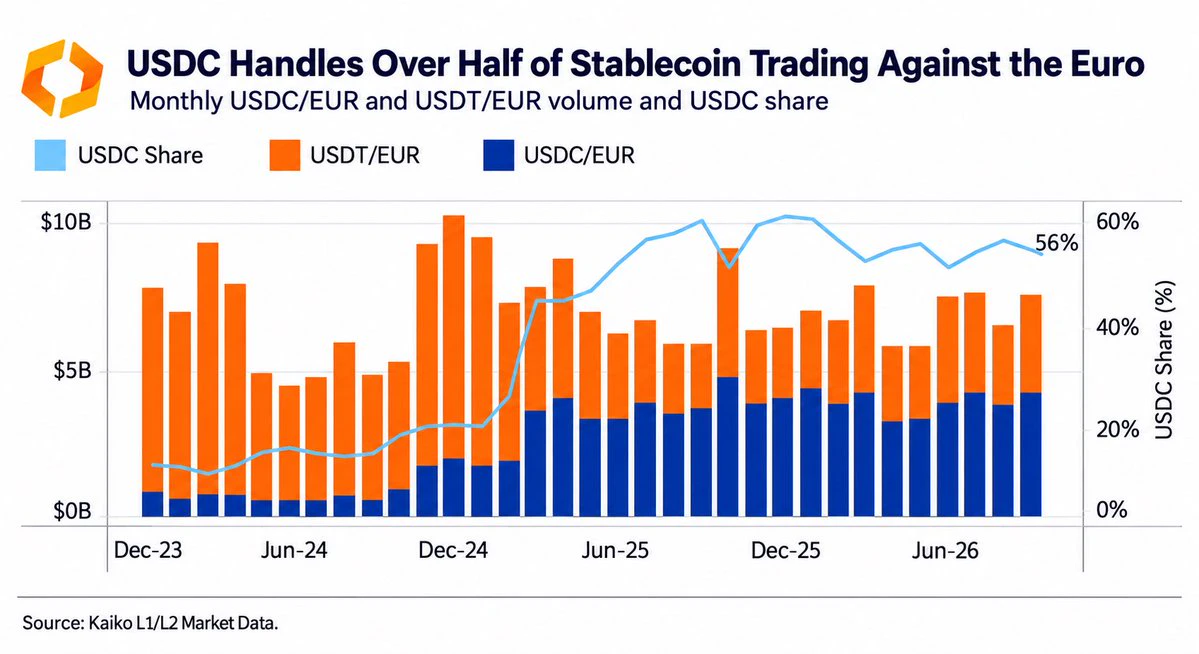
USDC went from 10% to 56% of euro-paired stablecoin trading, despite USDT having roughly 2.5x its global circulating supply.
➥ Kaiko’s latest data shows how much @circle has gained in Europe’s trading markets.
• USDC share of EUR stablecoin volume: 10% → 56%
• USDC/EUR order-book depth: 40% above USDT/EUR
• USDT global supply: 2.5x USDC
A lot of this comes down to MiCA.
As European exchanges restricted USDT access for EEA customers, trading activity and liquidity increasingly concentrated around USDC.
What’s notable is that the smaller stablecoin now has deeper euro order books, giving it an a
post-image
USDC+0.01%
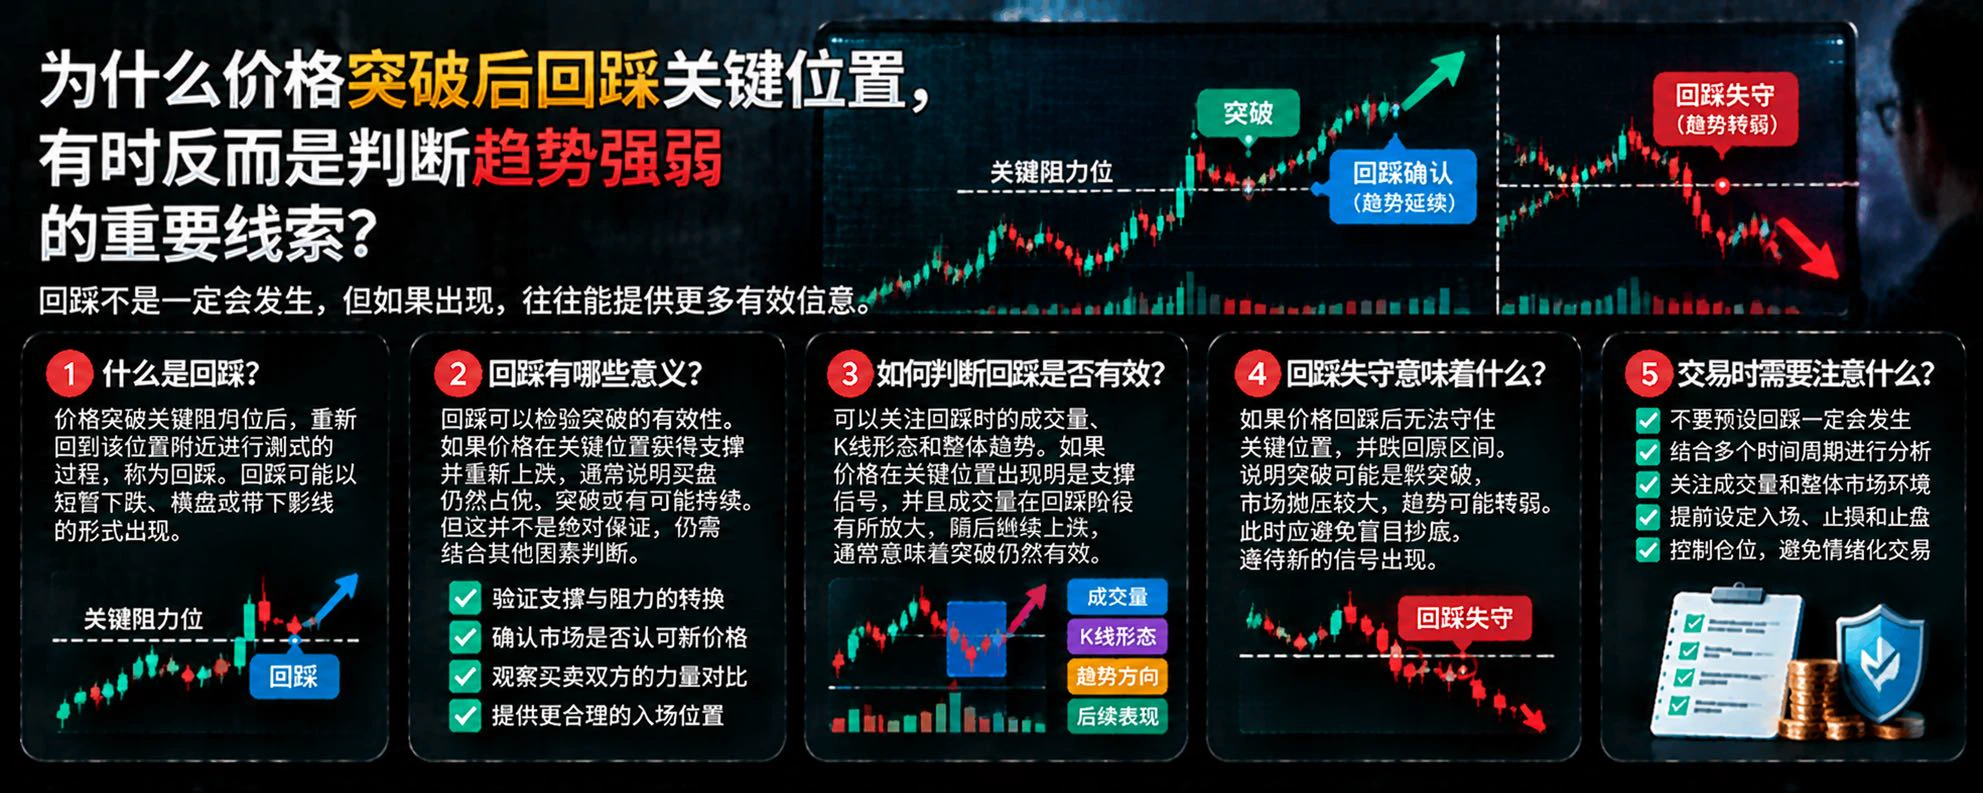
Why is a retest of a key level after a price breakout sometimes an important clue for assessing trend strength?
In crypto markets, a price breakout above resistance does not necessarily mean it will continue rising immediately. Sometimes, the price returns to near the breakout level before choosing a direction. This phenomenon is called a retest, and it can help traders assess whether the breakout has received further confirmation.
First, what is a retest?
When the price breaks above a key resistance level and then returns to test the area, this is a common retest. The former resistance level
post-image
Load More

Join 40 M users in our growing community

⚡️ Join 40 M users in the crypto craze discussion

💬 Engage with your favorite top creators

👍 See what interests you

Trending Topics

FedDecisionCountdown

26.27k Views1.22k Discussing

The Fed will announce its rate decision on October 28 at 18:00 (UTC), followed by a press conference at 18:30 (UTC). Markets widely expect rates to remain unchanged, with attention turning to future policy signals. Could this decision break crypto out of its trading range? What signals are you watching?

GateFirstToLaunchGoldCFD7X23Trading

37.41k Views6.33k Discussing

SKHynixQ3RevenueHitsRecordHigh

2.31k Views2.6k Discussing

View More