Square
Following
Hot
News
Profile

GateUser-505646d6

vip
Active for: 1.6y
Peak Tier 0
No content yet
0
Following
11
Followers
46
Liked
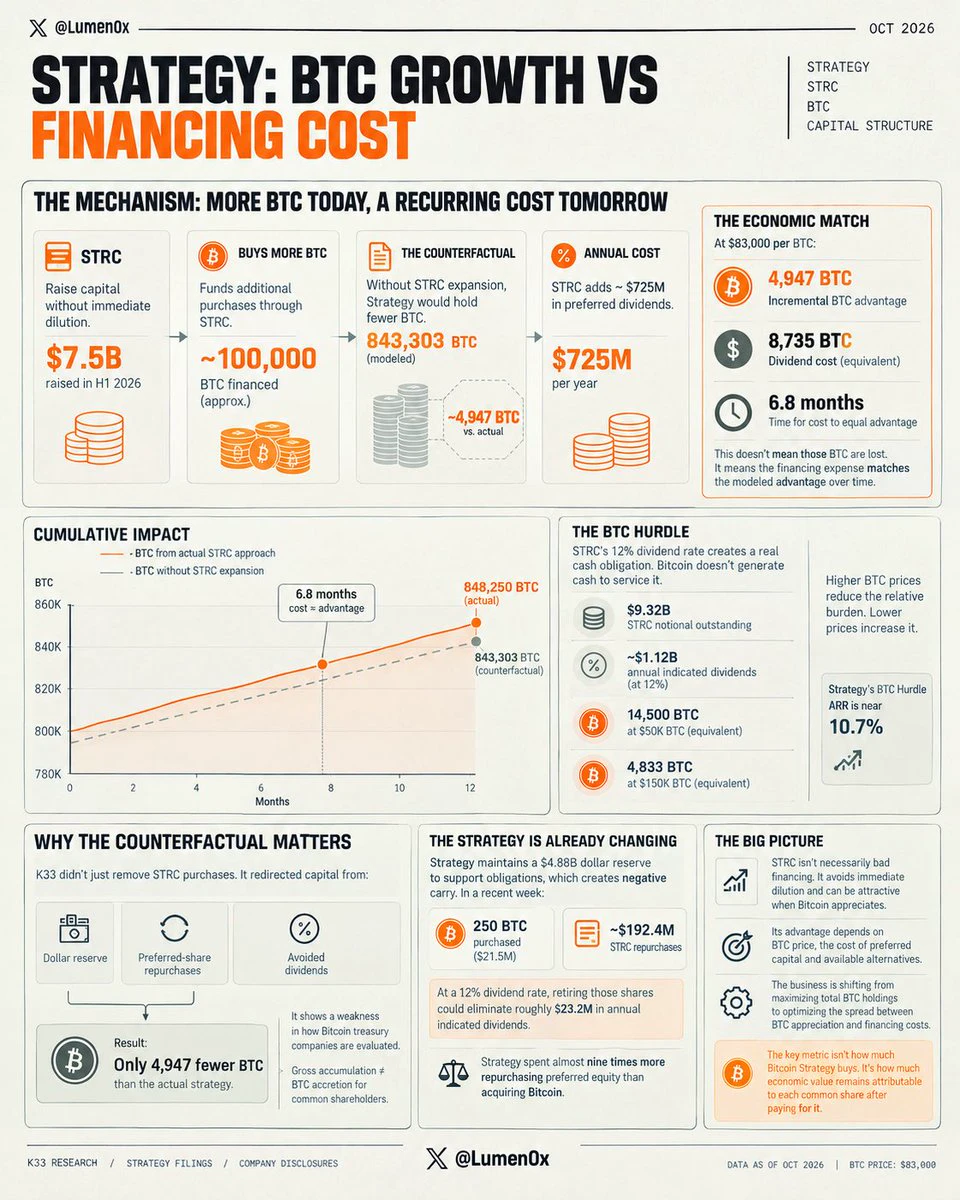
What if buying more Bitcoin actually makes a Bitcoin treasury company less attractive to its shareholders?
Sounds contradictory, but K33 Research’s latest analysis of Strategy raises exactly this problem.
@Strategy holds 848,250 BTC.
But K33 modeled an alternative capital structure where Strategy would hold 843,303 BTC without aggressively expanding its STRC preferred-stock program.
That’s a difference of just 4,947 BTC.
Yet STRC raised approximately $7.5B in H1 2026 and helped finance nearly 100,000 BTC.
So where did the advantage disappear?
——
⬢ The Cost Of Buying Bitcoin
STRC allows Strateg
post-image
BTC+1.13%
STRC+0.26%
MSTR+5.58%
Ethereum has issued nearly 800,000 ETH so far in 2026.
Transaction fees burned just 16,525 ETH.
The supply ledger through October 9 shows:
- Gross issuance: 796,623 ETH
- Transaction-fee burn: 16,525 ETH
- Net supply increase after all destruction: 778,413 ETH
- Fee burn / issuance: 2.07%
So even after fee burns and other forms of ETH destruction are accounted for, Ethereum’s supply is up roughly 0.64% this year.
That puts a number on one of the trade-offs behind cheaper blockspace.
Ethereum can process more activity while keeping transaction costs lower, but that activity is not currently gen
ETH+3.42%
Tokenization used to mean putting an asset onchain.
A Treasury bill became a token. Then stocks. Then funds.
@Ondo and @BlackRock have now taken the next step.
Ondo’s Intelligent Portfolios package BlackRock-designed strategies into single transferable tokens:
• BLKHIon
• BLKDIGon
• BLKGRWon
Each contains 6–9 tokenized ETFs. BlackRock sets the model, Ondo implements it, and the baskets are rebalanced quarterly.
Security → tokenized security → tokenized fund → tokenized portfolio
The portfolio itself becomes the asset.
———
One Token Can Represent An Entire Investment Mandate
BLKHIon is income-f
ONDO+8.06%
BLK+4.47%
BLKHION+0.06%
BLKDIGON+0.75%
BLKGRWON+0.70%
Prediction markets just closed another record month.
@Kalshi processed:
• $60.7B contract volume
• $14.7B dollars paid
• 345.7M trades
• $1.0B open interest
• +57% 30d volume growth
• $3.24B record day on September 27
But the significant number may be 80.5%.
That was Kalshi’s share of tracked prediction-market volume in September.
The sector is growing quickly. The activity underneath that growth is much more concentrated.
…
➥ $60.7B Is Not $60.7B Of Capital
Kalshi’s $60.7B represents contract notional.
Actual dollars paid were roughly $14.7B, while open interest was approximately $1B.
Those n
KALSHI+3.17%
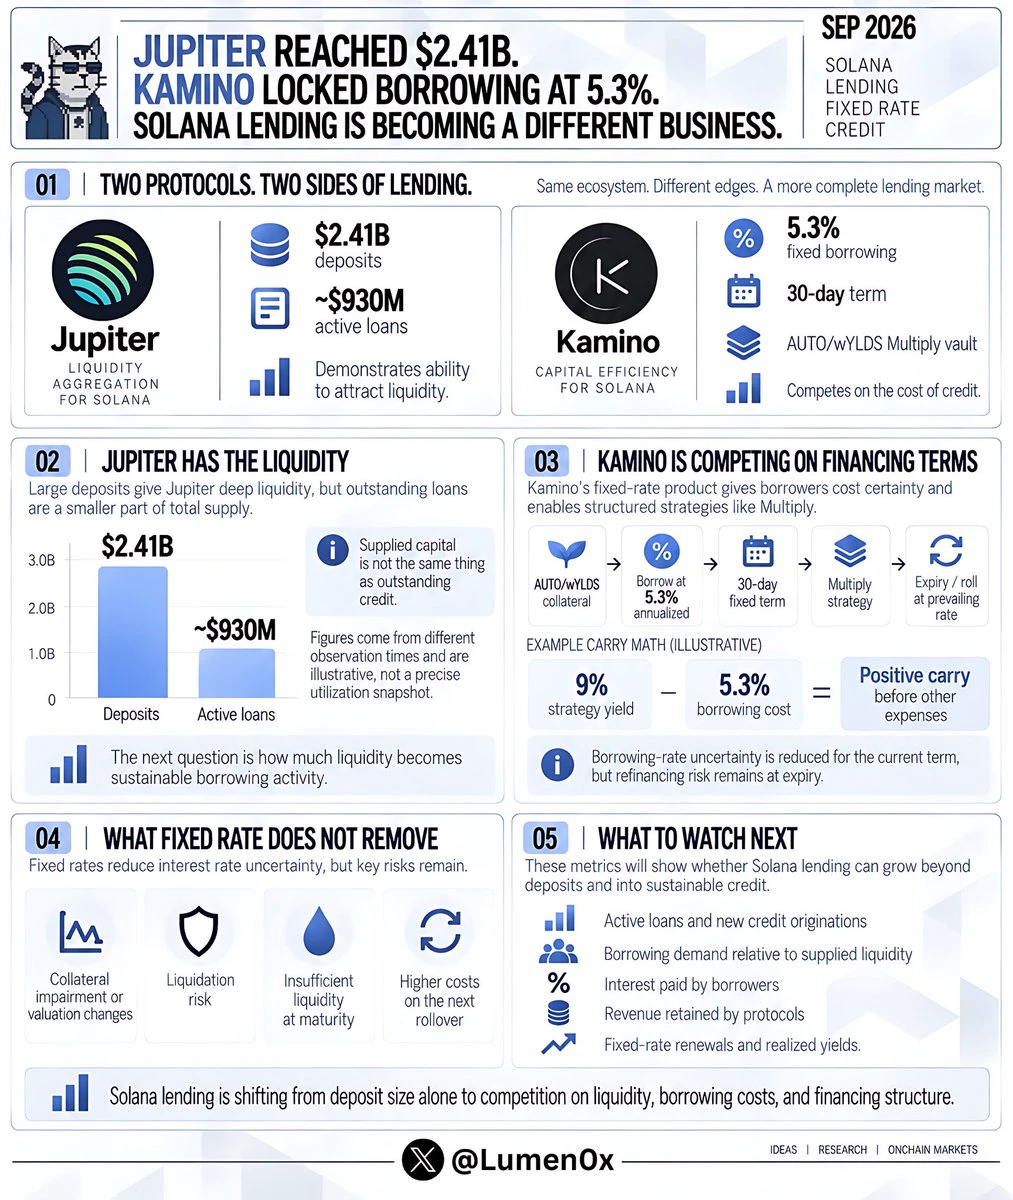
Jupiter Lend just hit $2.41B in deposits.
Around the same time, Kamino introduced a lending product offering fixed borrowing at 5.3%.
Two Solana protocols, two developments, but I think the more useful comparison is what each one tells us about the lending market.
Jupiter is attracting liquidity.
Kamino is giving borrowers more ways to use it.
And those aren’t necessarily the same business.
──────────
@JupiterExchange announced a new deposit record on September 22, with Jupiter Lend reaching $2.41B.
A separate DeFiLlama reading puts active loans around $930M.
These figures come from different
post-image
JUP+3.73%
KMNO+19.11%
SOL+3.21%
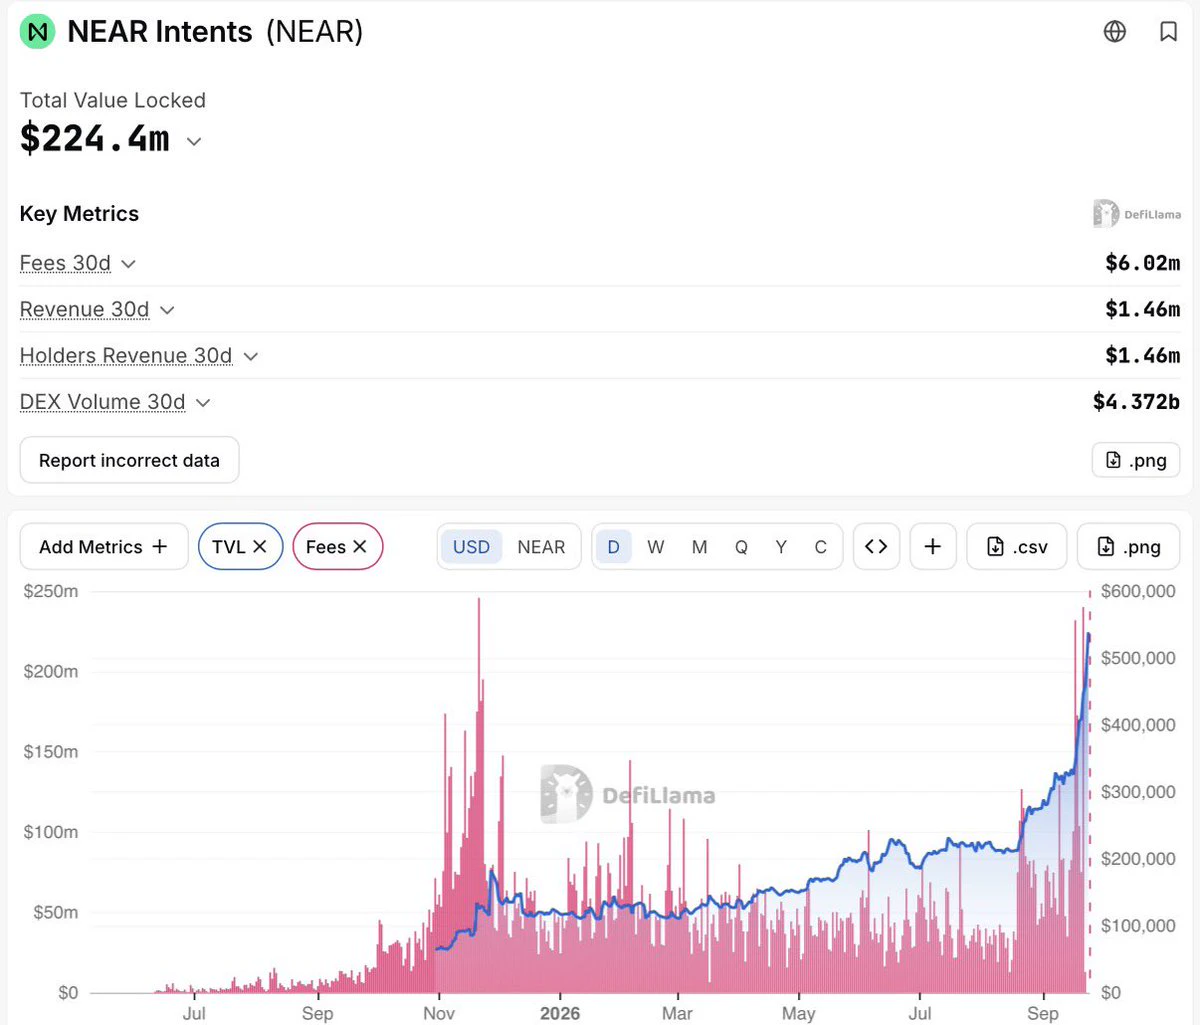
More than $30B has been swapped through NEAR Intents.
The latest week alone contributed $1.41B.
Here’s the breakdown:
- All-time: $30.50B
- Last 30 days: $4.37B
- Last seven days: $1.41B
So roughly a third of the monthly volume happened in just one week.
That’s around $201M a day, compared with $129M across the preceding 23 days.
@NEARProtocol gets talked about a lot through its AI story. Meanwhile, its swap infrastructure is putting up these numbers.
Now, this doesn’t tell us how many swaps came from AI agents. But honestly, $30B in cumulative volume doesn’t need an AI label to deserve attent
post-image
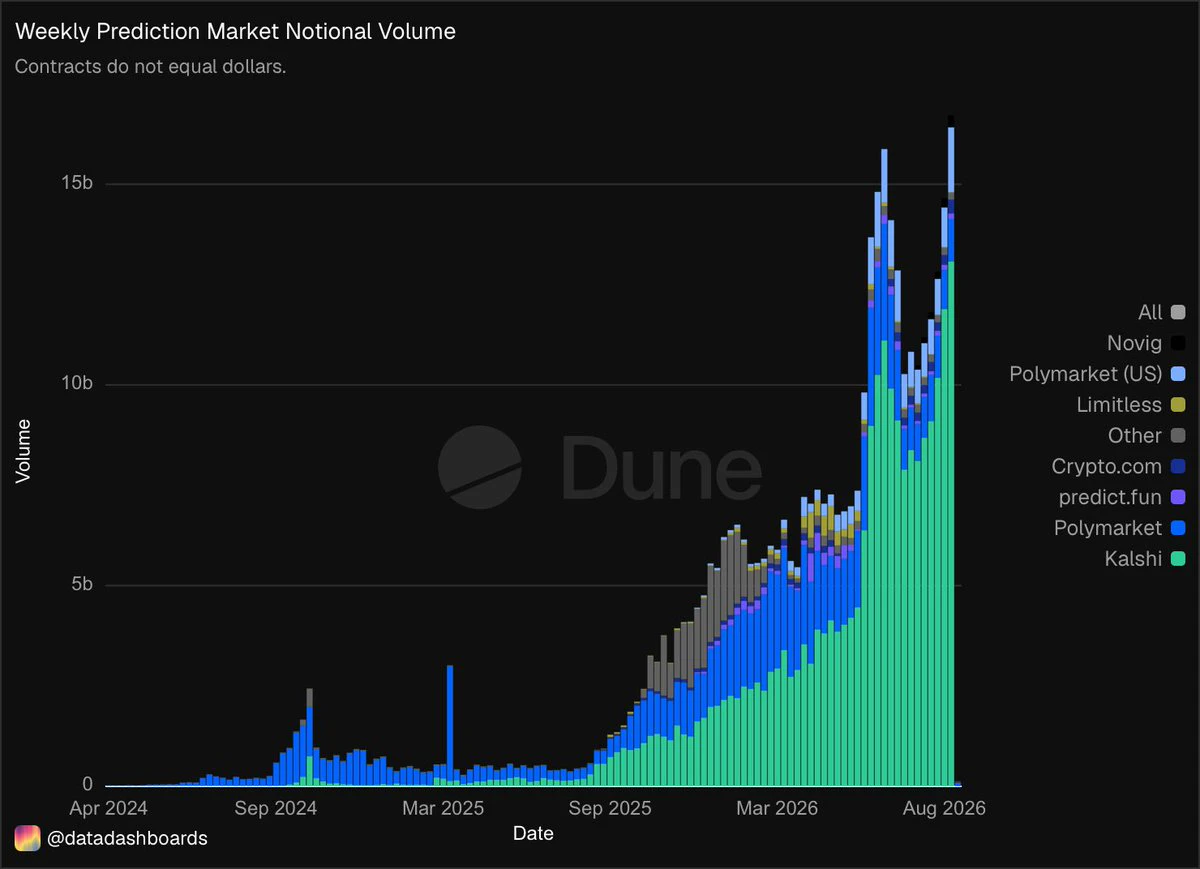
Prediction markets are starting to look pretty crowded.
The liquidity isn’t.
Trading volume across prediction markets hit a record $5.83B during the NFL opening weekend.
@Kalshi alone accounted for $4.89B of it.
That’s roughly 84% of the total.
Meanwhile, @Polymarket did around $404M on Sunday.
What’s interesting is how different that looks from the competitive landscape.
There are now around 16 prediction-market platforms fighting for users.
Kalshi.
Polymarket.
DraftKings.
FanDuel.
Robinhood.
Coinbase.
Underdog.
And plenty of smaller competitors.
They’re spending heavily on ads, sign-up bonus
post-image
KALSHI+3.17%
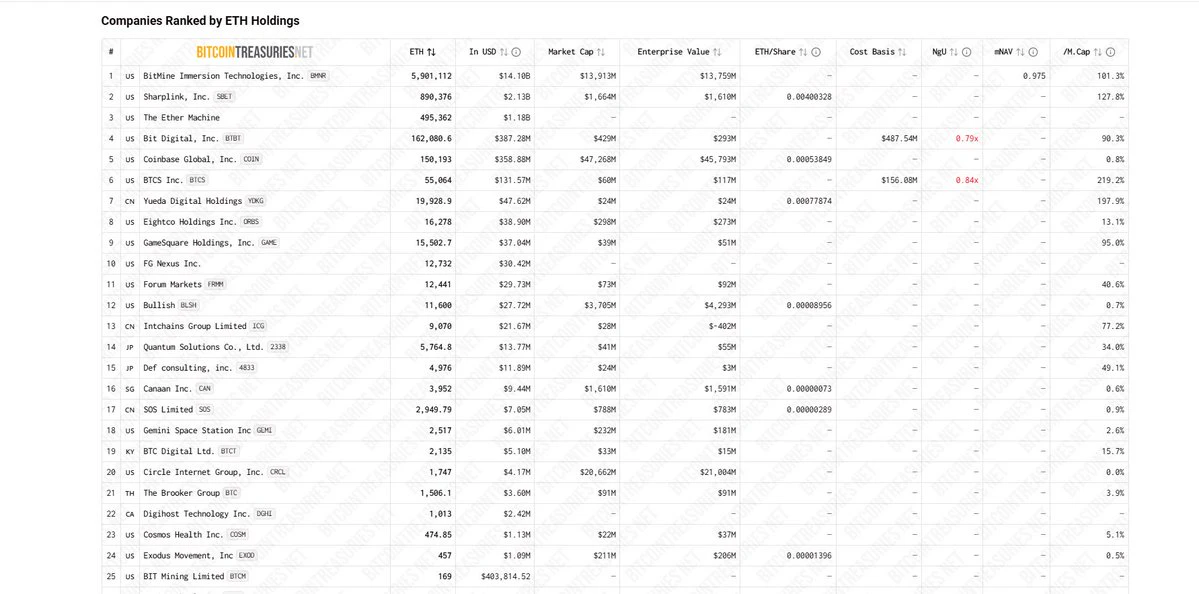
ETH’s institutional flow map is getting harder to read from ETF flows alone.
Bitmine now holds 5.90M ETH, roughly 4.9% of total supply.
Then layer in:
• Corporate treasuries
• Spot ETFs
• Exchange balances
• Staked ETH
The ownership picture is becoming heavily concentrated.
But ownership isn’t the same as float.
A large ETH balance sitting in a treasury, ETF or staking contract doesn’t create the same marginal pressure as ETH sitting on an exchange.
That distinction is becoming increasingly important as institutional accumulation scales.
The real variable isn’t how much ETH institutions own.
I
post-image
ETH+3.42%
BMNR+4.85%
Schwab is taking its crypto menu from 2 assets to 5.
BTC and ETH launched in May. Now SOL, AVAX and LINK are coming.
The five-asset menu is revealing:
BTC → monetary asset
ETH → smart-contract settlement
SOL → alternative high-throughput execution
AVAX → application-specific infrastructure
LINK → oracle infrastructure
Schwab isn’t trying to replicate a crypto exchange with thousands of tokens.
It’s building a curated crypto allocation.
The firm says the additions are based on “established cryptocurrencies that align with client demand.” Schwab has 39M active brokerage accounts and more than $1
BTC+1.13%
ETH+3.42%
SOL+3.21%
AVAX+5.07%
High DEX volume looks impressive on infographics until you ask a more important question: how much of that activity actually becomes protocol revenue?
Uniswap, Aerodrome, Raydium and PancakeSwap regularly rank among the largest DEXs by trading activity, but volume alone tells you little about how much economic value is retained by the protocol or its tokenholders.
The better framework is to separate:
– Volume: how much trading happens
– Fees: what traders pay
– Revenue: what the protocol actually retains
– LP economics: what remains after adverse selection and other costs
This last part is oft
UNI+6.90%
AERO+11.23%
RAY+2.95%
CAKE+0.54%
  • 1
➥ Bitcoin sitting in the $60K - $64K range all week with sell-side exhaustion at historic lows was the setup.
The move to $70K was the confirmation.
Sellers ran out of inventory. Price found the path of least resistance upward. That’s how these things tend to resolve.
The part I’m less convinced about is what comes next.
– Adjusted Sell-Side Risk Ratio at 20.23%
– Net Realized Profit/Loss 7-day SMA spiking
– Spot netflows positive at $556M over 30 days with $233M in the last 24 hours alone.
Profitable holders are selling into this rally at an accelerating rate.
That’s not inherently bearish.
BTC+1.13%
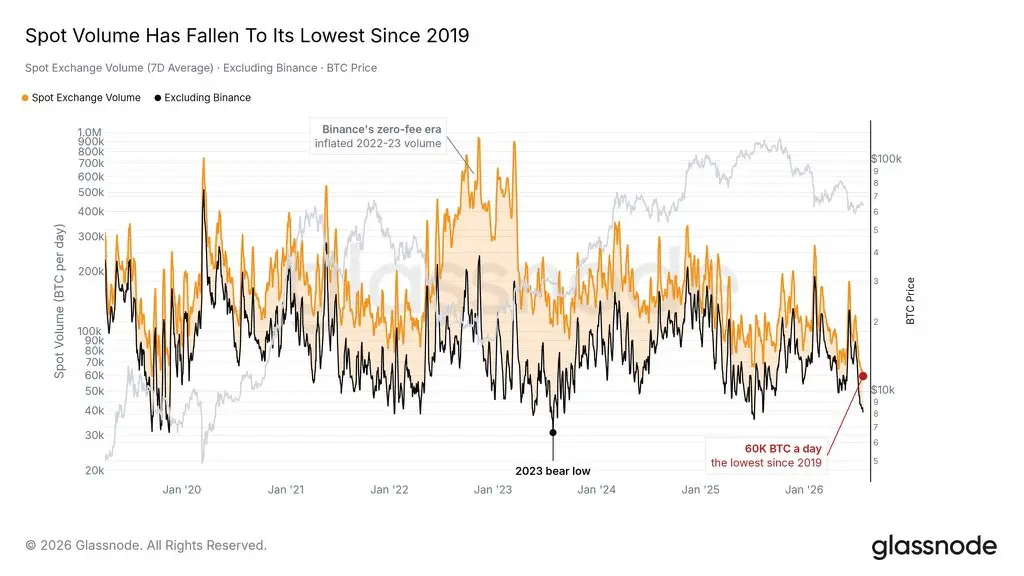
Bitcoin’s price and Bitcoin’s participation are telling two different stories.
Price has held up remarkably well.
Activity hasn’t.
A few data points stand out:
• Spot trading volume is at its lowest level since 2019
• Spot ETF demand remains soft
• Exchange flows continue to cool
• Futures basis has traded below the U.S. 2-year Treasury yield since February
This is one of those periods where the market isn’t falling apart.
It’s simply not attracting the same level of capital or trading activity.
The result is a market that’s proving resilient, but not yet broadly re-engaged.
That divergence is
post-image
BTC+1.13%
Traders who hold perp positions for a long time often see funding costs add up, even when the trade is right.
That's why @grvt_io's Stable Funding stands out. More predictable funding costs make it easier to hold and manage positions with confidence.
At the same time, GRVT Earn keeps your idle balance generating yield, so your capital doesn't sit unused.
Trade with one part, earn with the rest, all without moving funds across platforms.
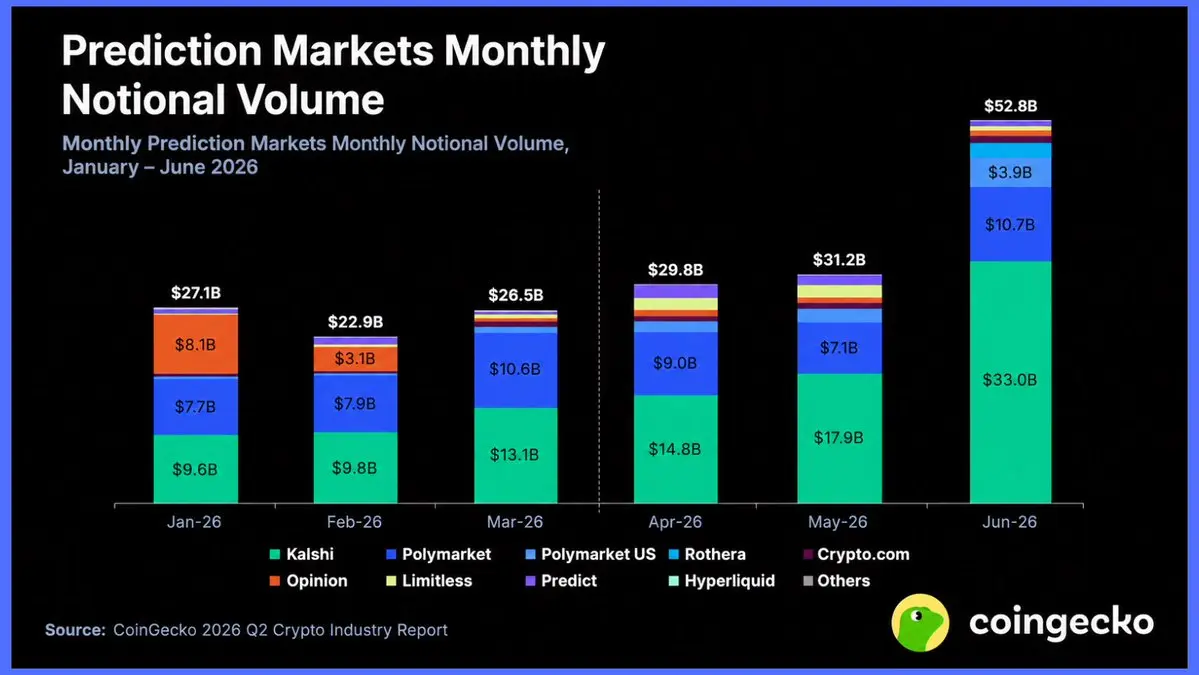
Q1 to Q2 2026. One quarter.
➤ Prediction market volume: $113.8B, Up 48.7%
➤ Top 10 CEX spot volume: $1.95T, Down 27.9%
Everything else in crypto contracted that quarter.
Perp futures were down 10%.
Stablecoins were down 1.6%, their first decline since 2023.
Prediction markets went the other way.
That’s one quarter of divergence, not a trend yet.
Calling it “counter-cyclical” this early is a claim, not a conclusion.
The test is simple.
Does this hold for two more quarters, or does it collapse the moment spot volume recovers?
If prediction market volume keeps climbing through a spot rally, that’
post-image