











#夏日创作营
Summer Wave in the Crypto Market: Current Outlook and End-of-Month Closing Levels
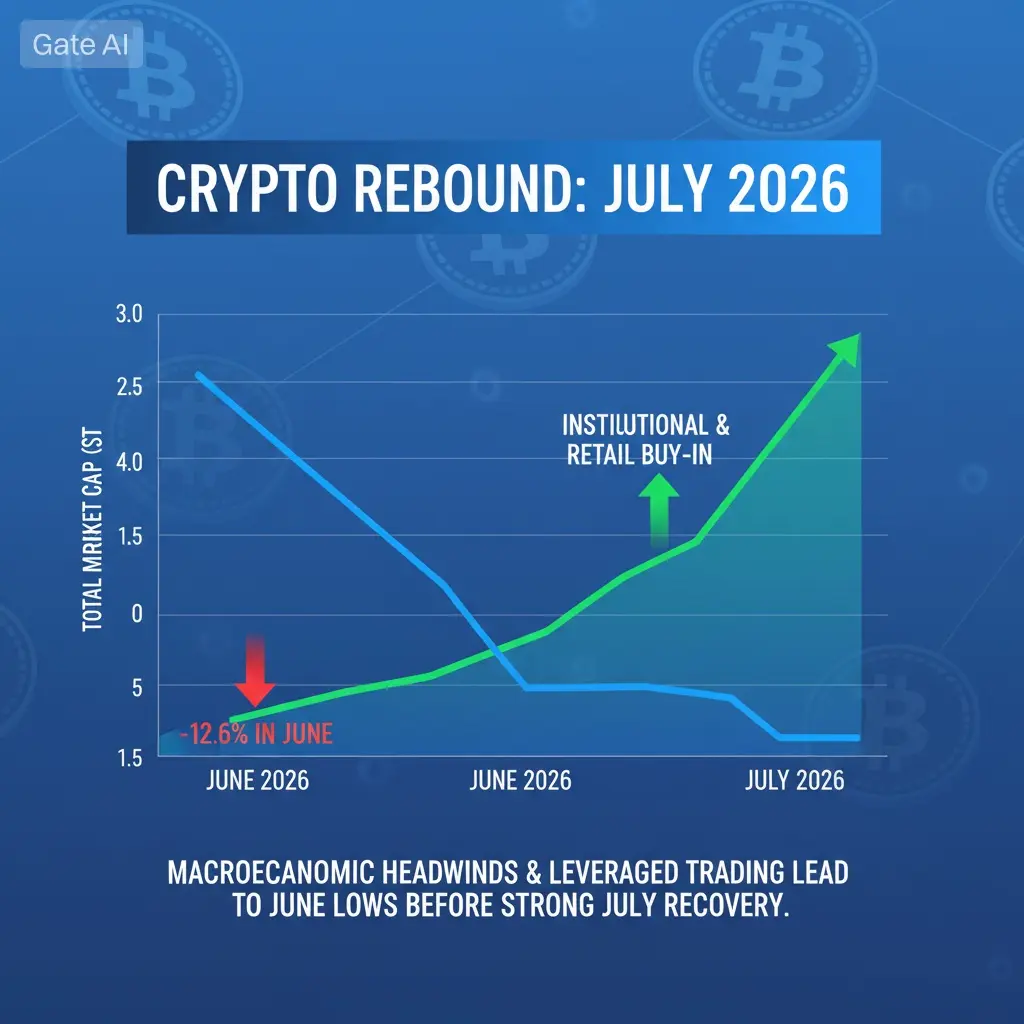
The cryptocurrency market has recovered as of July 2026 following the sharp declines in June. In June, the total market capitalization retreated by 12.6%, testing bottom levels due to macroeconomic pressures and leveraged trading, before giving way to institutional and individual purchases. Approximately $190 billion in new capital injected into the market in the first half of July revived the traditional "Green July" seasonal bull run. Stabilization in spot ETF inflows and the isolation of long-term accumulation suggest the market is evolving towards an upward downward trend (expected rise).
Current State and Fundamental Dynamics of the Crypto Market
The total cryptocurrency market capitalization is attempting to stabilize around the 2.22 spot level. While short-term US-Iran tensions and improvements in tech sentiment are creating temporary pressures, on-chain data indicates that strong hands are not selling.
* Institutional Purchases: US spot Bitcoin ETFs ended their 8-week uninterrupted outflow period and began recording net weekly inflows.
* Strength of Alternative Sectors: CoinGecko systematically reports that while the overall market contracted, prediction markets (prediction markets) and tokenized real-world assets (RWA) reached record trading volumes in July, ensuring sustainability.
* Leverage Clearing: Large liquidations in futures trading alleviated excessive leverage fatigue in the market, creating a healthier uptrend.
Major Cryptocurrency Month-End Closing Levels
As of July 2026, the critical support and resistance levels to be followed individually for major cryptocurrencies are as follows:
Bitcoin (BTC)
Bitcoin has bounced strongly from the local low of $57,000 - $60,000 tested in June. It is currently consolidating in the $63,000 - $64,000 range.
* Closing Resistance Levels: The critical resistance to overcome in the first instance is the $65,000 level. A week-long break above this level would normally target $67,000 (Fibonacci 38.2) and the psychological barrier of $70,000.
* Closing Support Levels: In case of a potential pullback, the strongest support area is the $61,100-$60,000 band. A decline in this region risks falling towards the $57,000-$58,000 levels.
Ethereum (ETH)
Although Ethereum is under strong selling pressure due to ETF exits and internal foundation splits, its recovery may exhibit a more aggressive momentum compared to Bitcoin. The process is dynamic for ETH, which is trading around $1,850.
* Closing Resistance Levels: The most important barrier in the near term is the $1,880-$1,900 region, which intersects with the downtrend line. If this level is breached, the target could shift to $1,960 and above, which was set at the end of July.
* Closing Support Levels: The psychological barrier of $1,800 is the first protective shield. The main support level is at $1,546.
Volatility (XRP)
Despite the pilot partnerships for corporate integration with JPMorgan and Mastercard, XRP continues to be under pressure from a "Death Cross" on the technical chart. The price, stuck between $1.08 and $1.10, is at a breakout level.
* Closing Resistance Levels: A high-volume breakout of the $1.15 and $1.20 resistance levels is needed to break out of the detailed learning curve.
* Closing Support Levels: In downward movements, the psychological support level is $1.00, followed by the critical level of $0.92.
We believe it's important for people to monitor resistance breakouts (especially $65,000 in BTC) during this process.
Solana (SOL)
Solana has proven its ecosystem strength by dominating 95% of the tokenized stock (SPCX) trading volume on Jupiter. It is among the altcoins with the highest potential for positive divergence from the market.
* Closing Resistance Levels: The short-term target is to break above the $80 resistance. If this happens, the end-of-month closing could move to the $88-$95 range.
* Closing Support Levels: The main support level for the price has formed a strong foundation in the $74-$70 range.
Cryptocurrency Current Price (Approx.) Critical Support Level | Critical Resistance Level End-of-Month Expectation
Bitcoin (BTC) $63,800 $60,000 [1.4.2] \vert{} $67,000 Positive / Bullish
Ethereum (ETH) $1,850 | $1,800 [1.3.4] \vert{} $1,960 Moderate-Positive
Solana (SOL) | $75 $70\vert{} $85 Positive
Ripple (XRP) | $1.09 $1.00\vert{} $1.20 Sideways / Cautious
Conclusion and Summer Camp Strategy
July 2026 is literally a "decision month" for the cryptocurrency market. The end of liquidation processes, the revival of institutional appetite in the spot ETF market, and the softening of macroeconomic data flows give strong signals that the end-of-month closings may be in favor of the bulls. It is of strategic importance for investors and content creators to closely follow resistance breakouts (especially $65,000 in BTC) during this period.
Global macroeconomic data and corporate earnings reports to be released next week (July 20-24, 2026) have the potential to directly trigger technical breakouts in the cryptocurrency market. While recent lower-than-expected US inflation data (CPI/PPI) has boosted risk appetite, the market will face a new volatility test next week.
Key Macroeconomic Developments for Next Week
1. European Central Bank Interest Rate Decision and S&P Global US PMI Data (July 23-24)
Data Details: The European Central Bank's monetary policy stance and the US Preliminary Manufacturing and Services PMI (Purchasing Managers Index) data to be released on Friday will signal global liquidity.
Market Impact: Better-than-expected US PMI data could indicate strong economic activity, boosting the US Dollar Index and putting pressure on cryptocurrencies. Weaker-than-expected PMI data, on the other hand, would ease the Fed's hand in interest rate cuts, supporting an upward breakout in cryptocurrencies.
2. Q2 Financial Results of US Giants (Google, Tesla, etc.)
Update: Mid-week (after market close on Wednesday, July 22), tech giants Alphabet (Google) and Tesla will announce their second-quarter financial results.
Market Impact: Bitcoin, which has a high correlation with the Nasdaq index, may enter a risk-on mode with strong earnings reports from AI and technology stocks. Conversely, poor earnings reports could lead to corrections in equity markets, pulling BTC back to its local support levels.
$ETH $SOL $XRP
Summer Wave in the Crypto Market: Current Outlook and End-of-Month Closing Levels
The cryptocurrency market has recovered as of July 2026 following the sharp declines in June. In June, the total market capitalization retreated by 12.6%, testing bottom levels due to macroeconomic pressures and leveraged trading, before giving way to institutional and individual purchases. Approximately $190 billion in new capital injected into the market in the first half of July revived the traditional "Green July" seasonal bull run. Stabilization in spot ETF inflows and the isolation of long-term accumulation suggest the market is evolving towards an upward downward trend (expected rise).
Current State and Fundamental Dynamics of the Crypto Market
The total cryptocurrency market capitalization is attempting to stabilize around the 2.22 spot level. While short-term US-Iran tensions and improvements in tech sentiment are creating temporary pressures, on-chain data indicates that strong hands are not selling.
* Institutional Purchases: US spot Bitcoin ETFs ended their 8-week uninterrupted outflow period and began recording net weekly inflows.
* Strength of Alternative Sectors: CoinGecko systematically reports that while the overall market contracted, prediction markets (prediction markets) and tokenized real-world assets (RWA) reached record trading volumes in July, ensuring sustainability.
* Leverage Clearing: Large liquidations in futures trading alleviated excessive leverage fatigue in the market, creating a healthier uptrend.
Major Cryptocurrency Month-End Closing Levels
As of July 2026, the critical support and resistance levels to be followed individually for major cryptocurrencies are as follows:
Bitcoin (BTC)
Bitcoin has bounced strongly from the local low of $57,000 - $60,000 tested in June. It is currently consolidating in the $63,000 - $64,000 range.
* Closing Resistance Levels: The critical resistance to overcome in the first instance is the $65,000 level. A week-long break above this level would normally target $67,000 (Fibonacci 38.2) and the psychological barrier of $70,000.
* Closing Support Levels: In case of a potential pullback, the strongest support area is the $61,100-$60,000 band. A decline in this region risks falling towards the $57,000-$58,000 levels.
Ethereum (ETH)
Although Ethereum is under strong selling pressure due to ETF exits and internal foundation splits, its recovery may exhibit a more aggressive momentum compared to Bitcoin. The process is dynamic for ETH, which is trading around $1,850.
* Closing Resistance Levels: The most important barrier in the near term is the $1,880-$1,900 region, which intersects with the downtrend line. If this level is breached, the target could shift to $1,960 and above, which was set at the end of July.
* Closing Support Levels: The psychological barrier of $1,800 is the first protective shield. The main support level is at $1,546.
Volatility (XRP)
Despite the pilot partnerships for corporate integration with JPMorgan and Mastercard, XRP continues to be under pressure from a "Death Cross" on the technical chart. The price, stuck between $1.08 and $1.10, is at a breakout level.
* Closing Resistance Levels: A high-volume breakout of the $1.15 and $1.20 resistance levels is needed to break out of the detailed learning curve.
* Closing Support Levels: In downward movements, the psychological support level is $1.00, followed by the critical level of $0.92.
We believe it's important for people to monitor resistance breakouts (especially $65,000 in BTC) during this process.
Solana (SOL)
Solana has proven its ecosystem strength by dominating 95% of the tokenized stock (SPCX) trading volume on Jupiter. It is among the altcoins with the highest potential for positive divergence from the market.
* Closing Resistance Levels: The short-term target is to break above the $80 resistance. If this happens, the end-of-month closing could move to the $88-$95 range.
* Closing Support Levels: The main support level for the price has formed a strong foundation in the $74-$70 range.
Cryptocurrency Current Price (Approx.) Critical Support Level | Critical Resistance Level End-of-Month Expectation
Bitcoin (BTC) $63,800 $60,000 [1.4.2] \vert{} $67,000 Positive / Bullish
Ethereum (ETH) $1,850 | $1,800 [1.3.4] \vert{} $1,960 Moderate-Positive
Solana (SOL) | $75 $70\vert{} $85 Positive
Ripple (XRP) | $1.09 $1.00\vert{} $1.20 Sideways / Cautious
Conclusion and Summer Camp Strategy
July 2026 is literally a "decision month" for the cryptocurrency market. The end of liquidation processes, the revival of institutional appetite in the spot ETF market, and the softening of macroeconomic data flows give strong signals that the end-of-month closings may be in favor of the bulls. It is of strategic importance for investors and content creators to closely follow resistance breakouts (especially $65,000 in BTC) during this period.
Global macroeconomic data and corporate earnings reports to be released next week (July 20-24, 2026) have the potential to directly trigger technical breakouts in the cryptocurrency market. While recent lower-than-expected US inflation data (CPI/PPI) has boosted risk appetite, the market will face a new volatility test next week.
Key Macroeconomic Developments for Next Week
1. European Central Bank Interest Rate Decision and S&P Global US PMI Data (July 23-24)
Data Details: The European Central Bank's monetary policy stance and the US Preliminary Manufacturing and Services PMI (Purchasing Managers Index) data to be released on Friday will signal global liquidity.
Market Impact: Better-than-expected US PMI data could indicate strong economic activity, boosting the US Dollar Index and putting pressure on cryptocurrencies. Weaker-than-expected PMI data, on the other hand, would ease the Fed's hand in interest rate cuts, supporting an upward breakout in cryptocurrencies.
2. Q2 Financial Results of US Giants (Google, Tesla, etc.)
Update: Mid-week (after market close on Wednesday, July 22), tech giants Alphabet (Google) and Tesla will announce their second-quarter financial results.
Market Impact: Bitcoin, which has a high correlation with the Nasdaq index, may enter a risk-on mode with strong earnings reports from AI and technology stocks. Conversely, poor earnings reports could lead to corrections in equity markets, pulling BTC back to its local support levels.
$ETH $SOL $XRP