
#BitcoinETFSees7272BTCOutflow
14 Days. 66,000 BTC. $4.5 Billion Gone. What This ETF Outflow Streak Actually Tells Us About Market Perception
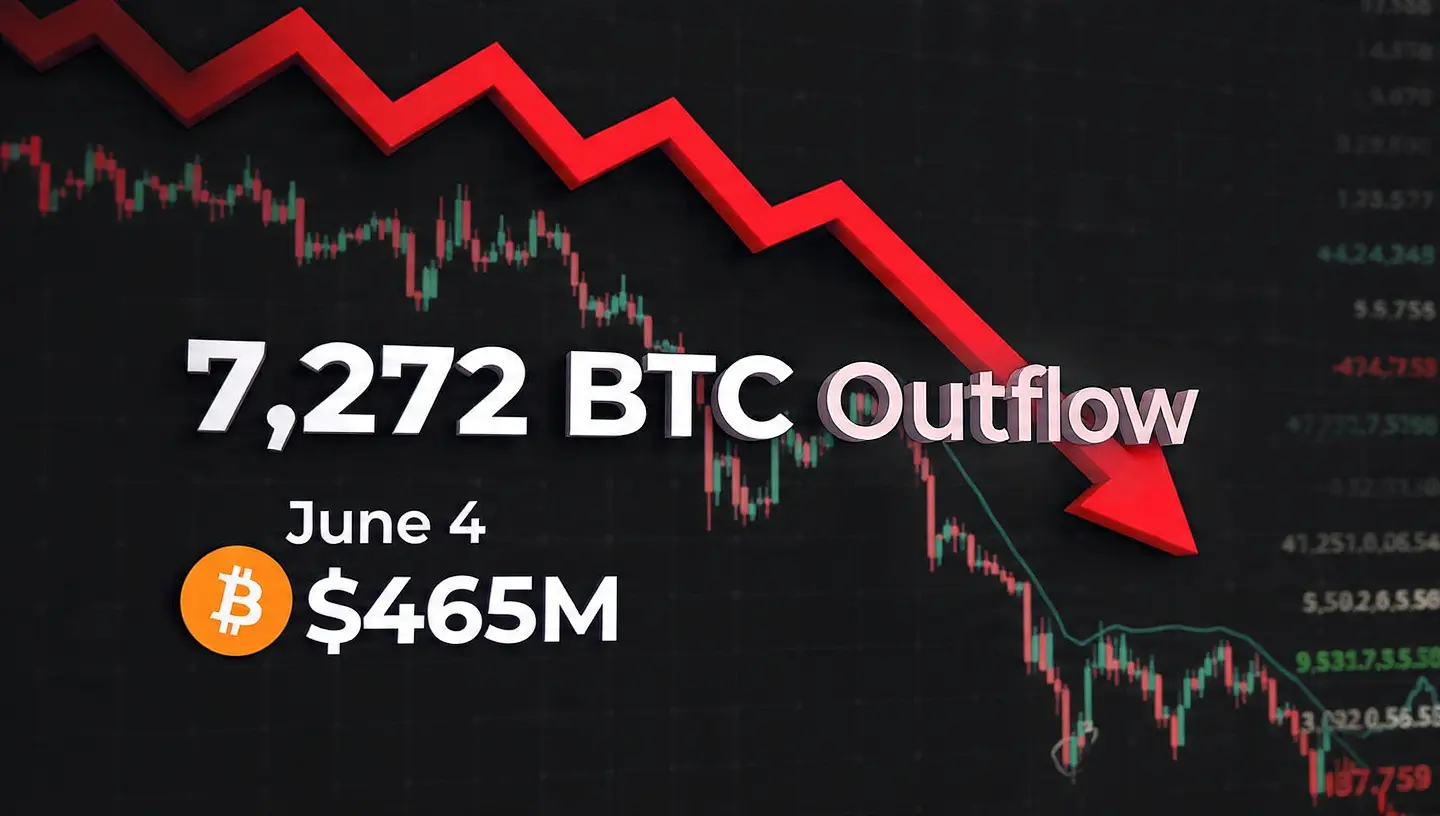
On June 4, U.S. spot Bitcoin ETFs recorded a net outflow of 7,272 BTC — roughly 657.54 million in a single day. That day marked the 14th consecutive trading day of outflows, a streak never seen since the ETFs launched. BlackRock's IBIT alone shed approximately 342 million, and Fidelity's FBTC lost around 54 million. Over the full 14-day stretch, cumulative redemptions climbed to roughly 66,000 BTC, exceeding 4.5 billion. Bitcoin briefly dipped below $62,000, touching a near four-month low.
The numbers are staggering, but the real story isn't in the arithmetic. It's in what those numbers reveal about how markets perceive value, how sentiment and fundamentals interact, and why different investors respond to the same data in completely different ways.
Let's start with the most misunderstood dynamic in crypto: the gap between business fundamentals and investor sentiment. Bitcoin's network fundamentals — hash rate, adoption curves, institutional infrastructure development — have not collapsed. The blockchain is running. Developers are building. Countries are still drafting regulatory frameworks around digital assets. But fundamentals don't move prices on a 14-day timeframe. Sentiment does. And sentiment, right now, is being driven by something fundamentals can't counter: the visual of capital leaving the very vehicles that were supposed to bring it in.
Spot ETFs were hailed as the bridge between Wall Street and Bitcoin. They were the narrative that turned "institutional adoption" from a prediction into a product you could buy on your brokerage dashboard. When that bridge starts bleeding — when IBIT, the flagship from the world's largest asset manager, sees $342 million walk out in one day — the narrative cracks. Not because the product is broken, but because perception shifts. Investors begin asking: if the institution that built this bridge is watching people leave, should I be leaving too?
This is the interaction between businesses, expectations, and market sentiment over time. ETF providers like BlackRock and Fidelity aren't just passive conduits. Their brands carry weight. When IBIT posts outflows, it signals something beyond a number — it signals that even the "smart money" channel is experiencing pressure. The expectation was that ETFs would create a floor of institutional demand. The reality is that institutions are not a monolith. Some are tactical allocators rebalancing quarterly. Some are hedge funds executing momentum strategies. Some are wealth managers responding to client risk tolerance changes. They all use the same ETF wrapper, but their strategies, timeframes, and reasons for exiting are entirely different.
Recognizing that different investors use different strategies is essential to reading this moment correctly. The 14-day streak doesn't mean "everyone is dumping Bitcoin." It means a subset of ETF-positioned capital is realigning. Some of that realignment is driven by macro headwinds — hawkish Fed rhetoric pushing risk-off positioning. Some is profit-taking after earlier accumulation phases. Some is genuine fear. And some, paradoxically, may be rotation into other opportunities — the AI infrastructure boom has attracted approximately $400 billion in deployment over the past six months, and capital is fluid. It flows toward perceived momentum. Right now, that momentum isn't in crypto.
Which brings us to the hardest part: discipline. When you see 14 consecutive days of redemptions, when BTC drops below $62,000, when the Fear & Greed Index reportedly touched levels suggesting near-capitulation — maintaining discipline is not a slogan. It's a real, psychological, gut-level challenge. Your portfolio is shrinking. The narrative that justified your position is being challenged daily. The people you trusted to hold the floor are walking away. And every instinct in your body says: cut the loss, step aside, wait for clarity.
But here's what discipline actually means in practice. It doesn't mean ignoring the data — that's denial. It means processing the data without letting it dictate decisions that belong to your strategy, not your emotions. A structured investment approach says: I entered with a thesis, I sized my position to survive drawdowns, I defined my exit criteria before the drawdown happened, and I'm not rewriting those criteria because the market printed 14 red candles. The investor who follows structure rather than impulse is the one who, historically, captures recoveries. The one who exits on fear is the one who sells the bottom to someone who stayed.
Now the deeper question: which is actually more difficult — staying disciplined during volatility, or identifying the right opportunity at the right time? Honestly, they're the same skill seen from different angles. Discipline is the ability to act on what you already know without second-guessing it under pressure. Timing is the ability to recognize when new conditions create an opening that aligns with your framework. Both require you to separate signal from noise. Both require you to resist the gravitational pull of crowd sentiment. And both require you to accept that you won't always be right — but you'll be wrong in a way you can learn from, rather than a way that devastates your capital.
The 14-day outflow streak is noise for some investors and signal for others. For tactical traders, it's a signal to reduce exposure until flows stabilize. For long-term allocators, it's noise — a temporary dislocation that may create entry opportunities once sentiment resets. For observers of innovation and growth across industries, it's context: capital rotates between sectors, and right now AI is drawing the tide. Bitcoin's long-term trajectory doesn't depend on a 14-day flow streak. Its short-term price does.
What matters most is not whether you interpret this as bullish or bearish. What matters is whether your interpretation comes from a structured framework or from the emotional reflex of watching $4.5 billion walk out the door. The market doesn't reward conviction born from panic. It rewards conviction born from process.
This streak will end. Flows will eventually reverse — they always do, historically, after extreme streaks, sometimes within days. The question isn't when. The question is whether, when that reversal comes, you'll be positioned according to your plan or according to your fear.
14 Days. 66,000 BTC. $4.5 Billion Gone. What This ETF Outflow Streak Actually Tells Us About Market Perception
On June 4, U.S. spot Bitcoin ETFs recorded a net outflow of 7,272 BTC — roughly 657.54 million in a single day. That day marked the 14th consecutive trading day of outflows, a streak never seen since the ETFs launched. BlackRock's IBIT alone shed approximately 342 million, and Fidelity's FBTC lost around 54 million. Over the full 14-day stretch, cumulative redemptions climbed to roughly 66,000 BTC, exceeding 4.5 billion. Bitcoin briefly dipped below $62,000, touching a near four-month low.
The numbers are staggering, but the real story isn't in the arithmetic. It's in what those numbers reveal about how markets perceive value, how sentiment and fundamentals interact, and why different investors respond to the same data in completely different ways.
Let's start with the most misunderstood dynamic in crypto: the gap between business fundamentals and investor sentiment. Bitcoin's network fundamentals — hash rate, adoption curves, institutional infrastructure development — have not collapsed. The blockchain is running. Developers are building. Countries are still drafting regulatory frameworks around digital assets. But fundamentals don't move prices on a 14-day timeframe. Sentiment does. And sentiment, right now, is being driven by something fundamentals can't counter: the visual of capital leaving the very vehicles that were supposed to bring it in.
Spot ETFs were hailed as the bridge between Wall Street and Bitcoin. They were the narrative that turned "institutional adoption" from a prediction into a product you could buy on your brokerage dashboard. When that bridge starts bleeding — when IBIT, the flagship from the world's largest asset manager, sees $342 million walk out in one day — the narrative cracks. Not because the product is broken, but because perception shifts. Investors begin asking: if the institution that built this bridge is watching people leave, should I be leaving too?
This is the interaction between businesses, expectations, and market sentiment over time. ETF providers like BlackRock and Fidelity aren't just passive conduits. Their brands carry weight. When IBIT posts outflows, it signals something beyond a number — it signals that even the "smart money" channel is experiencing pressure. The expectation was that ETFs would create a floor of institutional demand. The reality is that institutions are not a monolith. Some are tactical allocators rebalancing quarterly. Some are hedge funds executing momentum strategies. Some are wealth managers responding to client risk tolerance changes. They all use the same ETF wrapper, but their strategies, timeframes, and reasons for exiting are entirely different.
Recognizing that different investors use different strategies is essential to reading this moment correctly. The 14-day streak doesn't mean "everyone is dumping Bitcoin." It means a subset of ETF-positioned capital is realigning. Some of that realignment is driven by macro headwinds — hawkish Fed rhetoric pushing risk-off positioning. Some is profit-taking after earlier accumulation phases. Some is genuine fear. And some, paradoxically, may be rotation into other opportunities — the AI infrastructure boom has attracted approximately $400 billion in deployment over the past six months, and capital is fluid. It flows toward perceived momentum. Right now, that momentum isn't in crypto.
Which brings us to the hardest part: discipline. When you see 14 consecutive days of redemptions, when BTC drops below $62,000, when the Fear & Greed Index reportedly touched levels suggesting near-capitulation — maintaining discipline is not a slogan. It's a real, psychological, gut-level challenge. Your portfolio is shrinking. The narrative that justified your position is being challenged daily. The people you trusted to hold the floor are walking away. And every instinct in your body says: cut the loss, step aside, wait for clarity.
But here's what discipline actually means in practice. It doesn't mean ignoring the data — that's denial. It means processing the data without letting it dictate decisions that belong to your strategy, not your emotions. A structured investment approach says: I entered with a thesis, I sized my position to survive drawdowns, I defined my exit criteria before the drawdown happened, and I'm not rewriting those criteria because the market printed 14 red candles. The investor who follows structure rather than impulse is the one who, historically, captures recoveries. The one who exits on fear is the one who sells the bottom to someone who stayed.
Now the deeper question: which is actually more difficult — staying disciplined during volatility, or identifying the right opportunity at the right time? Honestly, they're the same skill seen from different angles. Discipline is the ability to act on what you already know without second-guessing it under pressure. Timing is the ability to recognize when new conditions create an opening that aligns with your framework. Both require you to separate signal from noise. Both require you to resist the gravitational pull of crowd sentiment. And both require you to accept that you won't always be right — but you'll be wrong in a way you can learn from, rather than a way that devastates your capital.
The 14-day outflow streak is noise for some investors and signal for others. For tactical traders, it's a signal to reduce exposure until flows stabilize. For long-term allocators, it's noise — a temporary dislocation that may create entry opportunities once sentiment resets. For observers of innovation and growth across industries, it's context: capital rotates between sectors, and right now AI is drawing the tide. Bitcoin's long-term trajectory doesn't depend on a 14-day flow streak. Its short-term price does.
What matters most is not whether you interpret this as bullish or bearish. What matters is whether your interpretation comes from a structured framework or from the emotional reflex of watching $4.5 billion walk out the door. The market doesn't reward conviction born from panic. It rewards conviction born from process.
This streak will end. Flows will eventually reverse — they always do, historically, after extreme streaks, sometimes within days. The question isn't when. The question is whether, when that reversal comes, you'll be positioned according to your plan or according to your fear.