


#分享美股交易赢英伟达股票 The U.S. stock market has surged 16% in two months: it has only happened four times in history, the most recent being before the 1987 crash!
The strong rebound in U.S. stocks over the past two months is triggering historical alarms. The S&P 500 index has risen 16% from April to May, a gain that has only occurred four times since World War II, three of which happened during recovery phases after a recession, with the only non-recession precedent being just a few months before the 1987 "Black Monday" crash.
Deutsche Bank macro strategist Henry Allen pointed out that this current rally is not occurring in the context of a recession recovery, making historical comparisons particularly striking. Meanwhile, credit spreads remain at historic lows, but signals of consumer pressure are accumulating, Fed rate hike expectations are rising, and divergence between the sovereign bond market and stocks continues to widen. With multiple risk factors stacking up, tail risks in the market are unusually concentrated.
Henry Allen wrote in his report, "The tail risks currently distributed are exceptionally prominent, both geopolitically and in the market."
Rare historical precedent, only one in a non-recession context!
The S&P 500 index gained 16% over April and May, a rare occurrence only four times since WWII. Three of these were strong rebounds following recessions: the recovery after the COVID-19 pandemic from April to May 2020, the rebound after the global financial crisis from March to April 2009, and the recovery after the first oil crisis from January to February 1975. The fourth was from January to February 1987. At that time, only a few months remained before October's "Black Monday"—when the S&P 500 plunged 20% in a single day.
Henry Allen emphasized that this rally is supported by fundamentals, including enthusiasm for artificial intelligence and strong economic data, but "the pace of the rise has already broken all recent precedents." In an economy that has not emerged from a recession, such a rapid rebound has never ended well in history. Additionally, the S&P 500 is on track to achieve its fourth consecutive year of double-digit gains, a record that has not been seen since the late 1990s.
Overly optimistic credit markets, consumer pressure signals being ignored!
The stock market's strength is also spreading to credit markets. Credit spreads in the U.S. and Europe are now narrower than before the U.S.-Iran conflict erupted, indicating high risk tolerance. However, warning signals at the consumer level are accumulating. The U.S. savings rate in April was only 2.6%, a level only seen during two periods in history: a single month in 2022 (when excess savings accumulated during the COVID-19 pandemic were being depleted), and just before the global financial crisis. Meanwhile, the University of Michigan consumer confidence index hit its lowest level since records began in 1952 in May. The monetary policy environment is also tightening. The European Central Bank is widely expected to raise interest rates this month, and market bets on the Fed raising rates in 2026 are heating up—April’s U.S. PCE inflation was 3.8% year-over-year, supporting this expectation.
Henry Allen pointed out that historically, hawkish Fed stances tend to coincide with widening credit spreads, as seen in 2022, late 2018, and from 2015 to 2016. The current calm in credit markets is a clear deviation from this historical pattern.
Bond markets alone under pressure, divergence from stocks continues to widen!
Despite the stock and credit markets showing high immunity to geopolitical risks, the sovereign bond market has taken a very different path. Over the past month, the 10-year U.S. Treasury yield has almost completely followed oil prices, diverging sharply from other asset classes. In mid-May, sovereign bond yields hit multi-year highs: the 30-year U.S. Treasury yield rose to 5.18%, the highest since 2007; the 10-year German bund yield rose to 3.19%, the highest since 2011. At that time, stocks were just a step away from their all-time highs, while bond yields reached levels unseen in over a decade. This divergence has shown no signs of convergence to date.
Henry Allen believes that bonds price inflation and fiscal risks more directly, making them more sensitive to geopolitical shocks. The ongoing divergence between stocks and bonds itself reflects the fragility of the current market.
Oil prices unexpectedly stable, becoming a key support for risk assets!
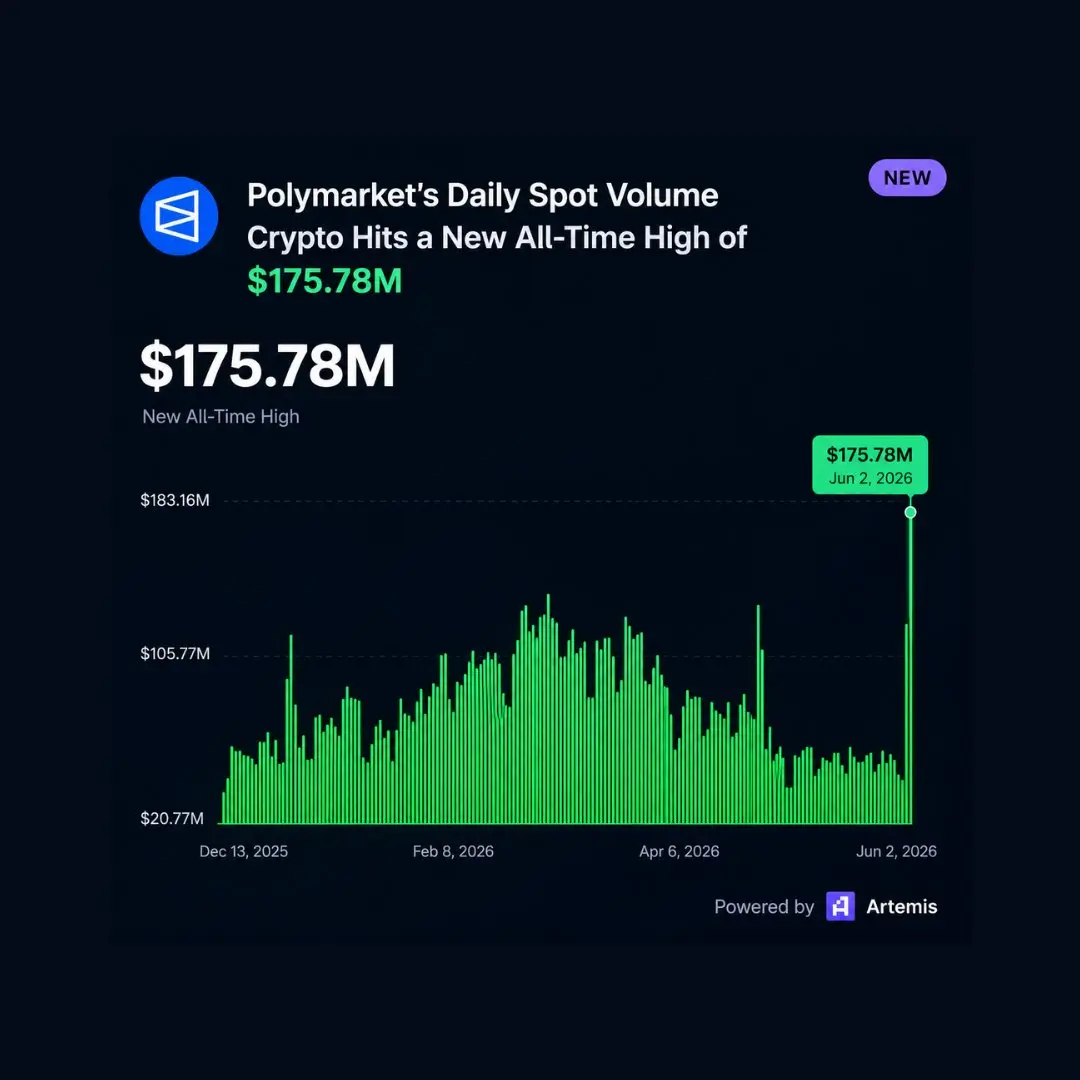
The blockade of the Strait of Hormuz lasted much longer than initially expected, but oil prices responded surprisingly mildly, partly explaining the resilience of risk assets. When the Iran-U.S. conflict erupted on February 28, the White House initially projected the action would last 4 to 6 weeks. However, the Strait of Hormuz remains blocked to this day. According to Polymarket data, the probability of normal navigation resuming by the end of June has dropped sharply from about 80% in mid-April to 22%.
Nevertheless, oil futures curves remain relatively stable. Two weeks after the conflict broke out on March 13, Brent crude oil six-month futures closed at $85.66 per barrel; by June 1, the contract was still around $84.88, nearly unchanged.
Henry Allen pointed out that because oil futures curves have not shifted significantly upward, investors have not priced in severe stagflation risks, avoiding larger-scale sell-offs in risk assets. However, he also warned that if the Strait of Hormuz remains blocked, whether this support can be maintained remains uncertain. $US500
The strong rebound in U.S. stocks over the past two months is triggering historical alarms. The S&P 500 index has risen 16% from April to May, a gain that has only occurred four times since World War II, three of which happened during recovery phases after a recession, with the only non-recession precedent being just a few months before the 1987 "Black Monday" crash.
Deutsche Bank macro strategist Henry Allen pointed out that this current rally is not occurring in the context of a recession recovery, making historical comparisons particularly striking. Meanwhile, credit spreads remain at historic lows, but signals of consumer pressure are accumulating, Fed rate hike expectations are rising, and divergence between the sovereign bond market and stocks continues to widen. With multiple risk factors stacking up, tail risks in the market are unusually concentrated.
Henry Allen wrote in his report, "The tail risks currently distributed are exceptionally prominent, both geopolitically and in the market."
Rare historical precedent, only one in a non-recession context!
The S&P 500 index gained 16% over April and May, a rare occurrence only four times since WWII. Three of these were strong rebounds following recessions: the recovery after the COVID-19 pandemic from April to May 2020, the rebound after the global financial crisis from March to April 2009, and the recovery after the first oil crisis from January to February 1975. The fourth was from January to February 1987. At that time, only a few months remained before October's "Black Monday"—when the S&P 500 plunged 20% in a single day.
Henry Allen emphasized that this rally is supported by fundamentals, including enthusiasm for artificial intelligence and strong economic data, but "the pace of the rise has already broken all recent precedents." In an economy that has not emerged from a recession, such a rapid rebound has never ended well in history. Additionally, the S&P 500 is on track to achieve its fourth consecutive year of double-digit gains, a record that has not been seen since the late 1990s.
Overly optimistic credit markets, consumer pressure signals being ignored!
The stock market's strength is also spreading to credit markets. Credit spreads in the U.S. and Europe are now narrower than before the U.S.-Iran conflict erupted, indicating high risk tolerance. However, warning signals at the consumer level are accumulating. The U.S. savings rate in April was only 2.6%, a level only seen during two periods in history: a single month in 2022 (when excess savings accumulated during the COVID-19 pandemic were being depleted), and just before the global financial crisis. Meanwhile, the University of Michigan consumer confidence index hit its lowest level since records began in 1952 in May. The monetary policy environment is also tightening. The European Central Bank is widely expected to raise interest rates this month, and market bets on the Fed raising rates in 2026 are heating up—April’s U.S. PCE inflation was 3.8% year-over-year, supporting this expectation.
Henry Allen pointed out that historically, hawkish Fed stances tend to coincide with widening credit spreads, as seen in 2022, late 2018, and from 2015 to 2016. The current calm in credit markets is a clear deviation from this historical pattern.
Bond markets alone under pressure, divergence from stocks continues to widen!
Despite the stock and credit markets showing high immunity to geopolitical risks, the sovereign bond market has taken a very different path. Over the past month, the 10-year U.S. Treasury yield has almost completely followed oil prices, diverging sharply from other asset classes. In mid-May, sovereign bond yields hit multi-year highs: the 30-year U.S. Treasury yield rose to 5.18%, the highest since 2007; the 10-year German bund yield rose to 3.19%, the highest since 2011. At that time, stocks were just a step away from their all-time highs, while bond yields reached levels unseen in over a decade. This divergence has shown no signs of convergence to date.
Henry Allen believes that bonds price inflation and fiscal risks more directly, making them more sensitive to geopolitical shocks. The ongoing divergence between stocks and bonds itself reflects the fragility of the current market.
Oil prices unexpectedly stable, becoming a key support for risk assets!
The blockade of the Strait of Hormuz lasted much longer than initially expected, but oil prices responded surprisingly mildly, partly explaining the resilience of risk assets. When the Iran-U.S. conflict erupted on February 28, the White House initially projected the action would last 4 to 6 weeks. However, the Strait of Hormuz remains blocked to this day. According to Polymarket data, the probability of normal navigation resuming by the end of June has dropped sharply from about 80% in mid-April to 22%.
Nevertheless, oil futures curves remain relatively stable. Two weeks after the conflict broke out on March 13, Brent crude oil six-month futures closed at $85.66 per barrel; by June 1, the contract was still around $84.88, nearly unchanged.
Henry Allen pointed out that because oil futures curves have not shifted significantly upward, investors have not priced in severe stagflation risks, avoiding larger-scale sell-offs in risk assets. However, he also warned that if the Strait of Hormuz remains blocked, whether this support can be maintained remains uncertain. $US500