Share crypto content and earn up to 60% commissions through content mining.
placeholder
gatefun
Actually, I really don't just know how to catch the knife and buy the dip 🥹
@ourbit You should be able to tell, right?
View Original
post-image
  • Reward
  • Comment
  • Repost
  • Share
$88 SOL, are you going to buy the dip?
Public companies are nearly $1 billion in unrealized losses, major investors sold off net $9.2 million in the past 24 hours, price dropped below $90, RSI directly hit 17.3—extremely oversold. But just five days ago, Visa, Western Union, and Meta simultaneously reached out to Solana, Firedancer 1.0 just went live.
First look at the surface: blood flowing, panic spreading.
In the past 24 hours, it fell 3.6%, bottomed at $88.4, market cap dropped below $52 billion, net outflow of $9.2 million in 24 hours. Price from the all-time high of $294 has fallen
SOL-2.91%
USDC0.04%
RWA-2.13%
View Original
post-image
  • Reward
  • Comment
  • Repost
  • Share
#GateSquareMayTradingShare | #ETH |
The Headline
US Approves Limited H200 Chip Sales to ~10 Chinese Companies – Up to 75,000 Units Each
Yes, you read that right.
The Biden (or current) administration has reportedly greenlit restricted H200 AI GPU exports to select Chinese firms — but with tight per-company caps.
At first glance, this looks like a partial easing.
In reality, it's a carefully calibrated chess move.
Why This Matters for AI, Tech Stocks & Crypto
The H200 isn't just another chip.
It's the backbone of advanced AI training, large language models, and high-performance computing.
For
ETH-1.98%
FET-3.89%
post-image
  • Reward
  • Comment
  • Repost
  • Share
$KAT (1h) - Bearish Continuation Breakdown
Bias: Short
Entry (Zone): 0.00876 - 0.00882
Targets:
TP1: 0.00862
TP2: 0.00850
TP3: 0.00834
Stop Loss: 0.00892
Why this Setup:
I’m looking for a failed reclaim of the 0.0088 area after the sharp selloff, and I want to fade any weak bounce back into resistance. The trend is still heavy on the 1h, so I’m aiming for continuation lower if price loses momentum again.
#GateSquareMayTradingShare
KAT-4.43%
post-image
  • Reward
  • Comment
  • Repost
  • Share
This is a story about looking at the root line, regardless of how much water it contains, just a simple entertainment small reference.
If I make enough 50 million in the crypto circle, I will choose to stop: this profit system should be sealed away!
A decade of hard work in the crypto career, from the 20k principal I saved up in 2016 to the assets that now allow me to lie flat, has never relied on luck.
By then, this profit method, praised by crypto friends as the "Eternal Profit System," should also be sealed away along with my retirement.
The core of the system is "Three Lines Determ
BTC-2.36%
LTC-1.54%
LUNA-2.88%
ETH-1.98%
View Original
post-image
  • Reward
  • Comment
  • Repost
  • Share
$TRX is moving quietly near support while the rest of the market stays unstable… and that calmness is getting interesting. 👀
After the sharp rally toward $0.3556, price cooled down and started building a stable base around $0.351.
Sellers pushed hard, but bulls refused to lose control of the structure.
This kind of slow consolidation often comes before a strong directional move. ⚡️
▫️Entry Zone: $0.3510 – $0.3520
▫️SL: Below $0.3495
▫️TP1: $0.3540
▫️TP2: $0.3556
▫️TP3: $0.3580+
Volume is stabilizing while momentum slowly rebuilds candle by candle.
If TRX breaks above resistance cleanly, the n
TRX-0.2%
post-image
  • Reward
  • Comment
  • Repost
  • Share
The day before yesterday, a surge higher, and the buying momentum soared to the sky.
Yesterday, a pullback, and the selling pressure flowed straight down.
This round of rise and fall, with two waves totaling nearly 6,000 points, is enough to get through the weekend.
View Original
post-image
post-image
  • Reward
  • Comment
  • Repost
  • Share
XPIN-8.97%
post-image
CryptoSat
💰 $XPIN Rejection
🔽 SHORT
✳️ ENTRY: 0.001484 – 0.001510 – 0.001545
🎯 TARGETS: 0.001456 – 0.001410 – 0.001360 – 0.00130 – 0.0012190 – 0.001100
🀄️ LEVERAGE: 10x
🔴 STOPLOSS: 0.001570
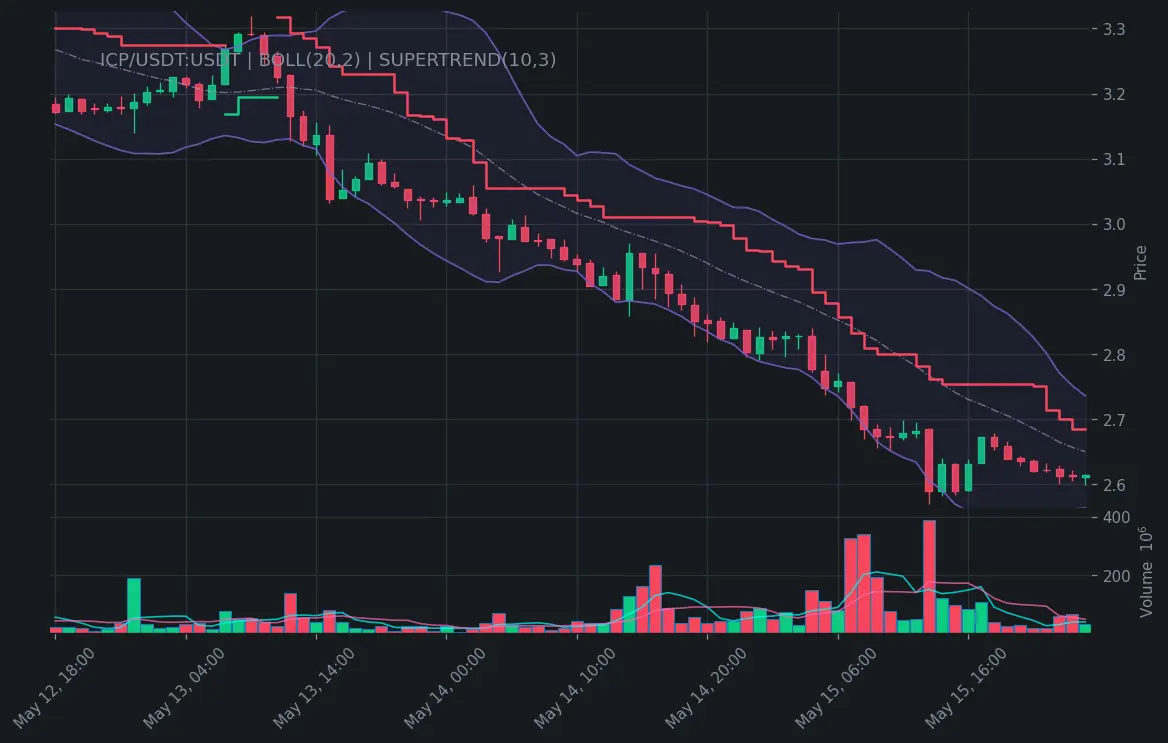
#XPIN is showing clear rejection after tagging the upper Bollinger Band and recent swing high, printing a bearish structure with lower highs. RSI momentum is cooling from the 60 zone with visible negative divergence on the 4H, while MACD is flattening near the zero line with early bearish tilt. We’re seeing strong resistance behavior around the 0.00149–0.00151 area where sellers stepped in aggressively on solid volume after the rally extension. This volume-backed rejection from overextended levels sets up a high-probability corrective move lower. DCA your shorts into the three evenly spaced entries (tighter into SL) on any bounce, scale partial profits at each target, and trail the rest. Clean swing setup — let’s catch this downside leg.
repost-content-media
  • Reward
  • Comment
  • Repost
  • Share
Damn, I’ve been watching this ICP trend all day. At the 2.614 price level, the dog-finance sharks are quietly unloading under the radar. The trading volume has been shrinking like something out of hell. The suckers are still sitting there, cluelessly taking the bag. I’ll be damned—this kind of pure technical anomaly is definitely the main players playing dirty; the smart money already bailed. What are you still standing there for?
Don’t ask me why. On the chart, that bearish candle is clearly engulfing everything. In the short term, there’s still room to fall. Listen to your big brother for on
ICP-7.49%
View Original
post-image
  • Reward
  • Comment
  • Repost
  • Share
#GateSquareMayTradingShare Oil Shock?
🛢️ $XTIUSD **105.81** +3.09%
🛢️ $XBRUSD 111.97 +2.12%
Global oil inventories are shrinking at one of the fastest rates ever recorded.
The market is entering a completely new phase.
📉 Visible global oil stockpiles stood near 8.5B barrels when the Iran conflict escalated.
📉 Major banks now estimate daily drawdowns of 4.8–7.1M barrels.
📉 That’s historic extreme territory.
Two critical levels traders are watching:
⚠️ ~7.6B barrels → operational stress + volatility accelerate.
⚠️ ~6.8B barrels → supply flexibility tightens, physical delivery pressure spi
XTIUSD2.54%
XBRUSD2.12%
post-image
  • Reward
  • 1
  • Repost
  • Share
HighAmbition:
good 💯
BTC Drops Below $79K With $76,000 Support Level Now in Play - - #btc
BTC-2.36%
post-image
  • Reward
  • Comment
  • Repost
  • Share
🔅𝗪𝗵𝗮𝘁 𝗗𝗶𝗱 𝗬𝗼𝘂 𝗠𝗶𝘀𝘀𝗲𝗱 𝗶𝗻 𝗖𝗿𝘆𝗽𝘁𝗼 𝗶𝗻 𝗹𝗮𝘀𝘁 24𝗛?🔅
-
$BTC stalls near $82K resistance again
• CLARITY Act advances, boosting market sentiment
• ETFs post mixed flows amid volatile demand
$ETH BTC, ETH open green but fade intraday
• CME plans broad crypto index futures launch
• Tokenized Treasuries surpass $15B milestone
• Market cap holds near $2.7T as traders eye breakout
#CLARITYActPassesSenateCommittee
BTC-2.36%
ETH-1.98%
post-image
  • Reward
  • Comment
  • Repost
  • Share
My kitten is always most active in the morning.
After I finish breakfast and want to continue sleeping, she runs parkour on the bed😭😭😭.
View Original
post-image
  • Reward
  • Comment
  • Repost
  • Share
BTC market analysis
gate liveLIVE
980
live-coin
  • Reward
  • 1
  • Repost
  • Share
Lock_433:
To The Moon 🌕
Jack Ma still rules the international stage
View Original
post-image
  • Reward
  • Comment
  • Repost
  • Share
Waking up to see Brother MaJi losing money
Brother MaJi has closed most of his ETH and BTC long positions, with losses rising to nearly $32 million
Currently, Brother MaJi still holds a position worth $10 million
ETH-1.98%
BTC-2.35%
View Original
  • Reward
  • Comment
  • Repost
  • Share
$SUI just went through a brutal correction from $1.41 to nearly $1.08… and fear is spreading fast across the market. 👀
But here’s the interesting part — despite heavy selling pressure, buyers are still defending the psychological $1.08 zone aggressively.
This is where weak hands usually exit while smart money starts watching closely.
Volatility is high, emotions are shaking traders out, and that’s when explosive reversals are born. ⚡️
▫️Entry Zone: $1.08 – $1.10
▫️SL: Below $1.04
▫️TP1: $1.15
▫️TP2: $1.22
▫️TP3: $1.30+
The trend still looks damaged short term, but panic selling is slowing whi
SUI-7.8%
post-image
  • Reward
  • Comment
  • Repost
  • Share
$PAXG is under heavy pressure after the rejection from the $4,762 zone, but buyers are starting to defend the market near key support again. 👀
The sharp selloff shook confidence fast, yet price is now slowing down around the $4,540 region instead of collapsing further.
That usually signals panic is fading while smart money begins watching for a rebound.
Gold-backed assets become dangerous when volatility compresses after fear. ⚡️
▫️Entry Zone: $4,535 – $4,550
▫️SL: Below $4,500
▫️TP1: $4,620
▫️TP2: $4,700
▫️TP3: $4,760+
Volume surged during the dump, but sellers are losing momentum while supp
PAXG-1.47%
post-image
  • Reward
  • Comment
  • Repost
  • Share
Bitcoin Public Reference on the 16th:
Currently forming a double top, failed twice to break 83,000 on May 6 and 11, confirming the M-top, with the neckline at 79,200 broken.
On the daily chart, the price has fallen below the Bollinger middle band (7933), short-term moving averages are turning downward, and bullish momentum is weakening.
The US dollar is relatively strong (DXY 99.27), US Treasury yields are rising, and liquidity is tightening. The US-Iran situation has not improved.
Trading suggestion: Consider shorting on rebounds near 79,500-80,000
First 🎯78,000
Second 🎯77,000
If the
BTC-2.35%
View Original
post-image
  • Reward
  • Comment
  • Repost
  • Share
Crypto Trading Live | Signals & Market Analysis
gate liveLIVE
753
  • Reward
  • Comment
  • Repost
  • Share
Load More