


XRP price performance shows weakness.
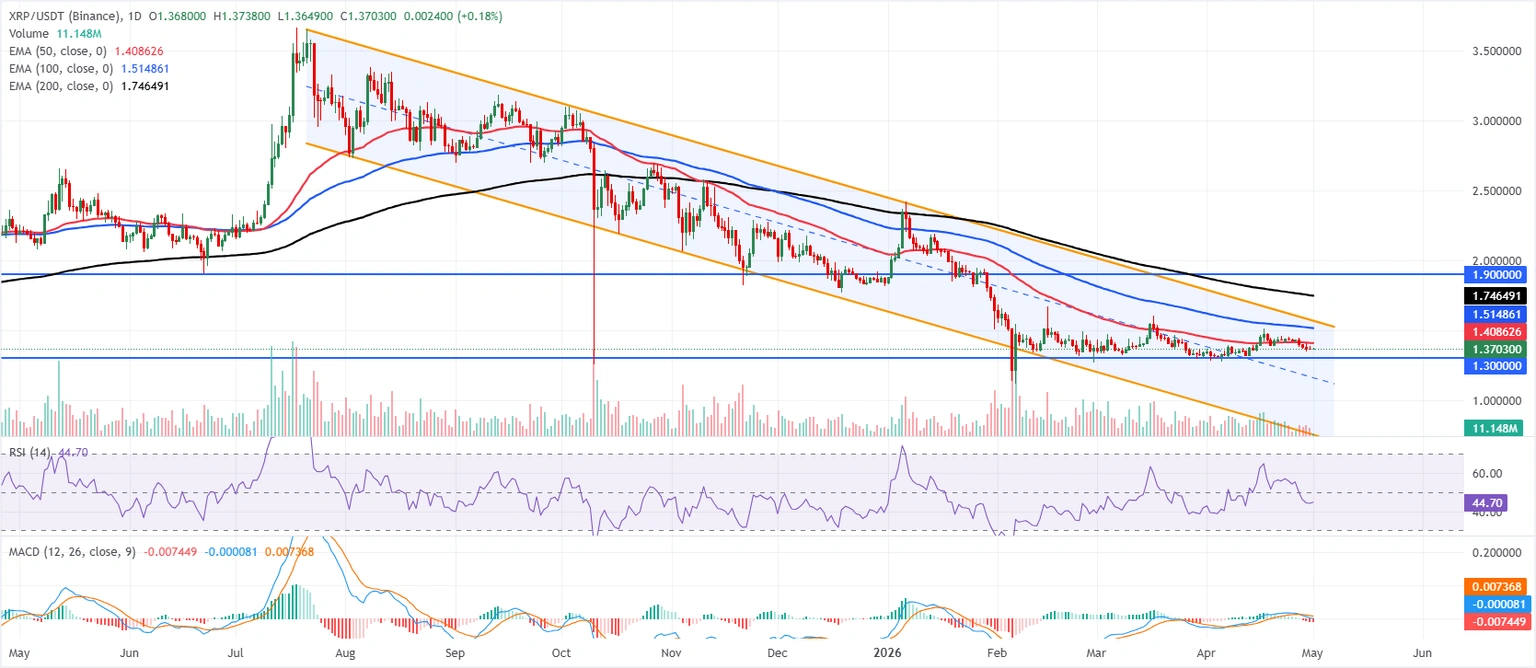
The XRP price trades at $1.37 on Friday, maintaining a short-term downtrend, as it remains within a broader parallel descending channel, staying below all major exponential moving averages. The 50-day exponential moving average at $1.40 is the nearest support level, while the 100-day EMA at $1.51 and the upper boundary of the channel near $1.56 form a multi-layered resistance barrier.
Momentum is weak, with the daily Relative Strength Index at 44 still below the neutral 50 line, while the MACD indicator has slipped further into negative territory, indicating that rallies are likely to remain vulnerable as the price trades below these averages.
On the other hand, there is initial demand around the horizontal support zone near $1.30, where buyers previously defended the lower end of the recent range, before the distant lower boundary of the channel near $0.75 in case selling pressure accelerates.
On the upside, a daily close above the 50-day EMA at $1.40 would be the first step toward easing immediate bearish pressure, with additional resistance appearing at the 100-day EMA around $1.51 and then at the top of the channel near $1.56; only a sustained breakout beyond these levels would begin to challenge the broader bearish structure, before horizontal resistance after $1.90.