


📢 Gate Square Daily Report | June 22
1️⃣ Geopolitical Situation: Trump warns Iran in a post, demanding that the immediate stoppage of Lebanese proxies’ provocations, or else Iran will be hit again “harder than last week,” casting a shadow once more over the ceasefire agreement.
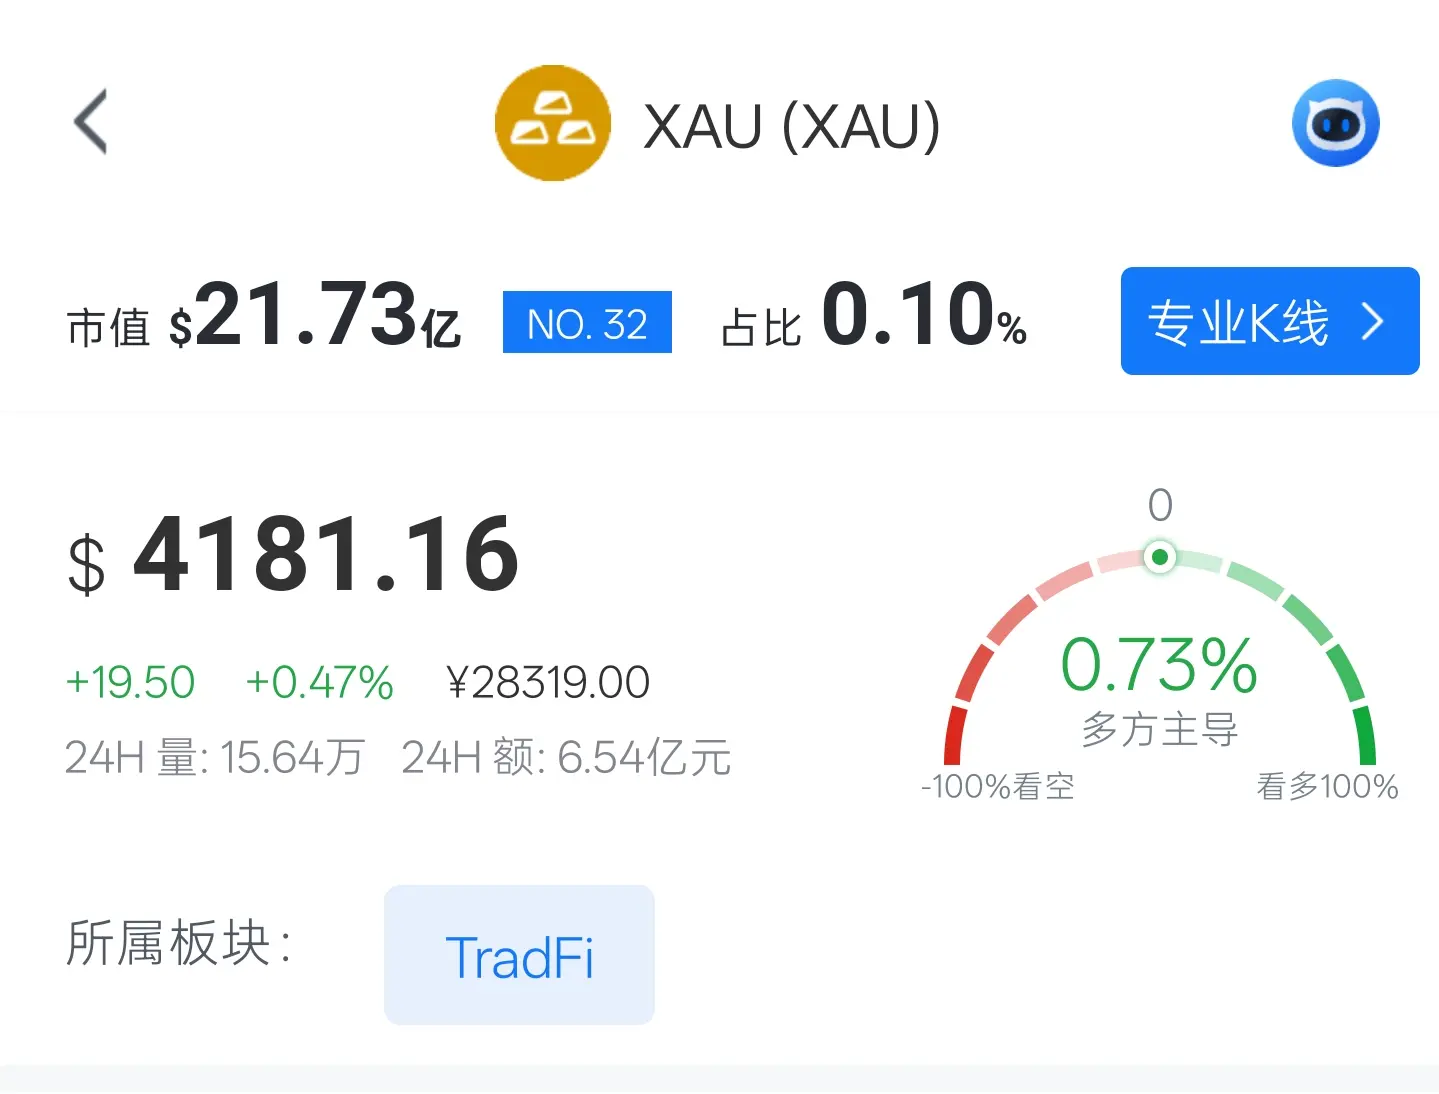
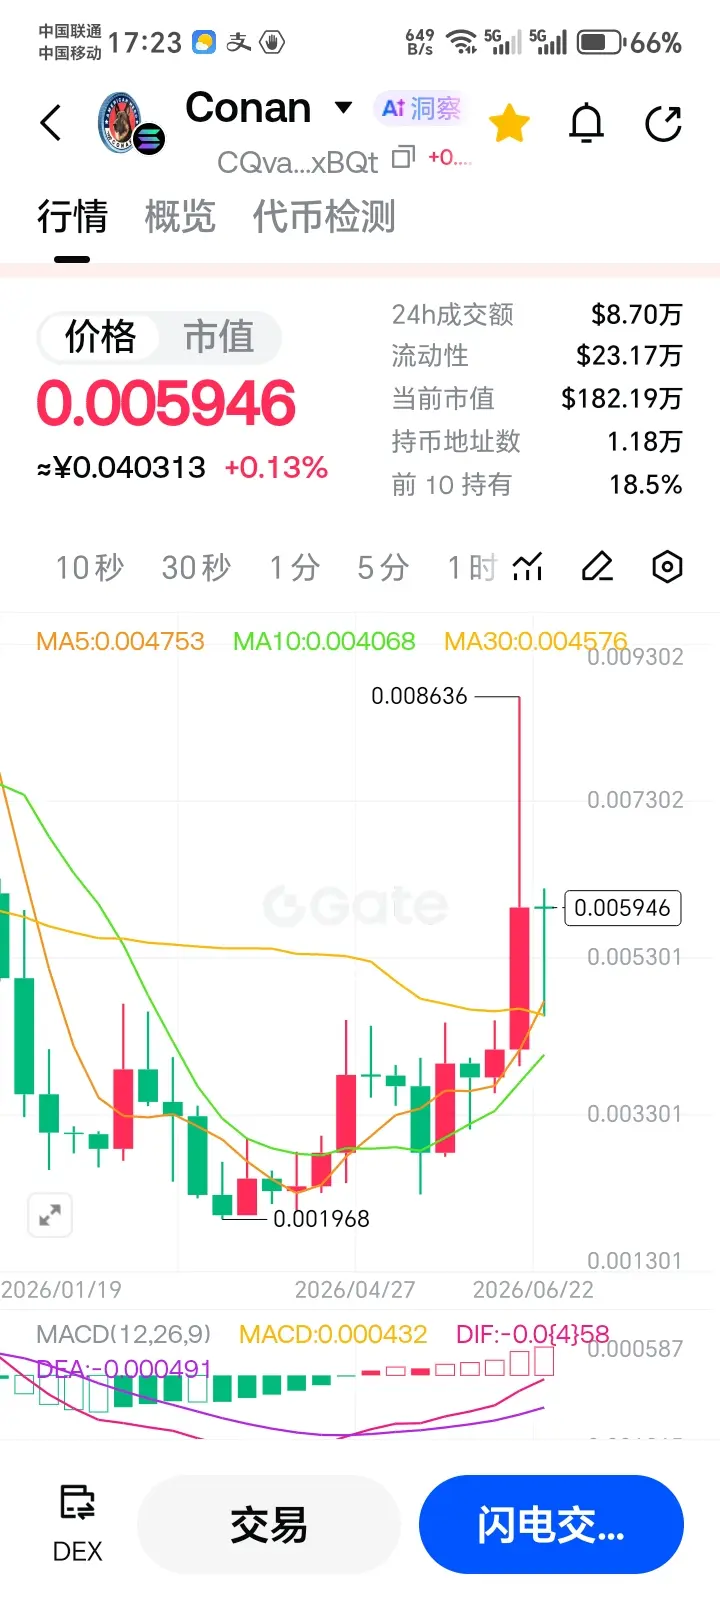
2️⃣ Market Dynamics: BTC is at $64,513, up 0.42% over 24 hours; rising tensions in the Strait of Hormuz have heightened market caution.
3️⃣ Security Incidents: Taiko ERC20 Vault was attacked, with losses exceeding $1 million; Ethereum’s largest “sandwich” arbitrage bot was hit with a reverse attack, resulting in losses of $7.5 million.
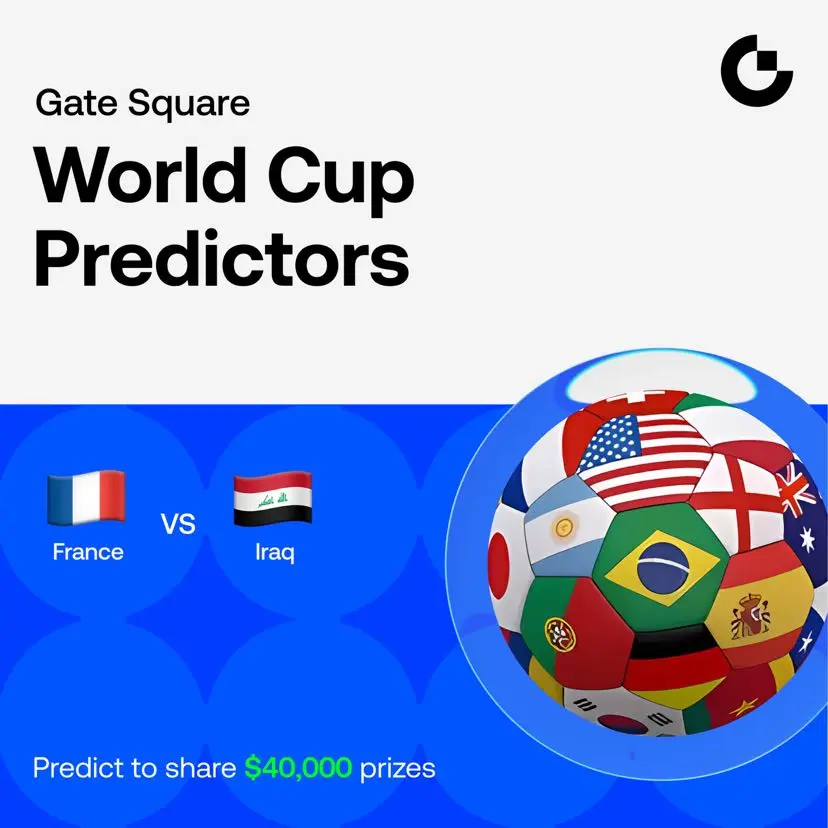
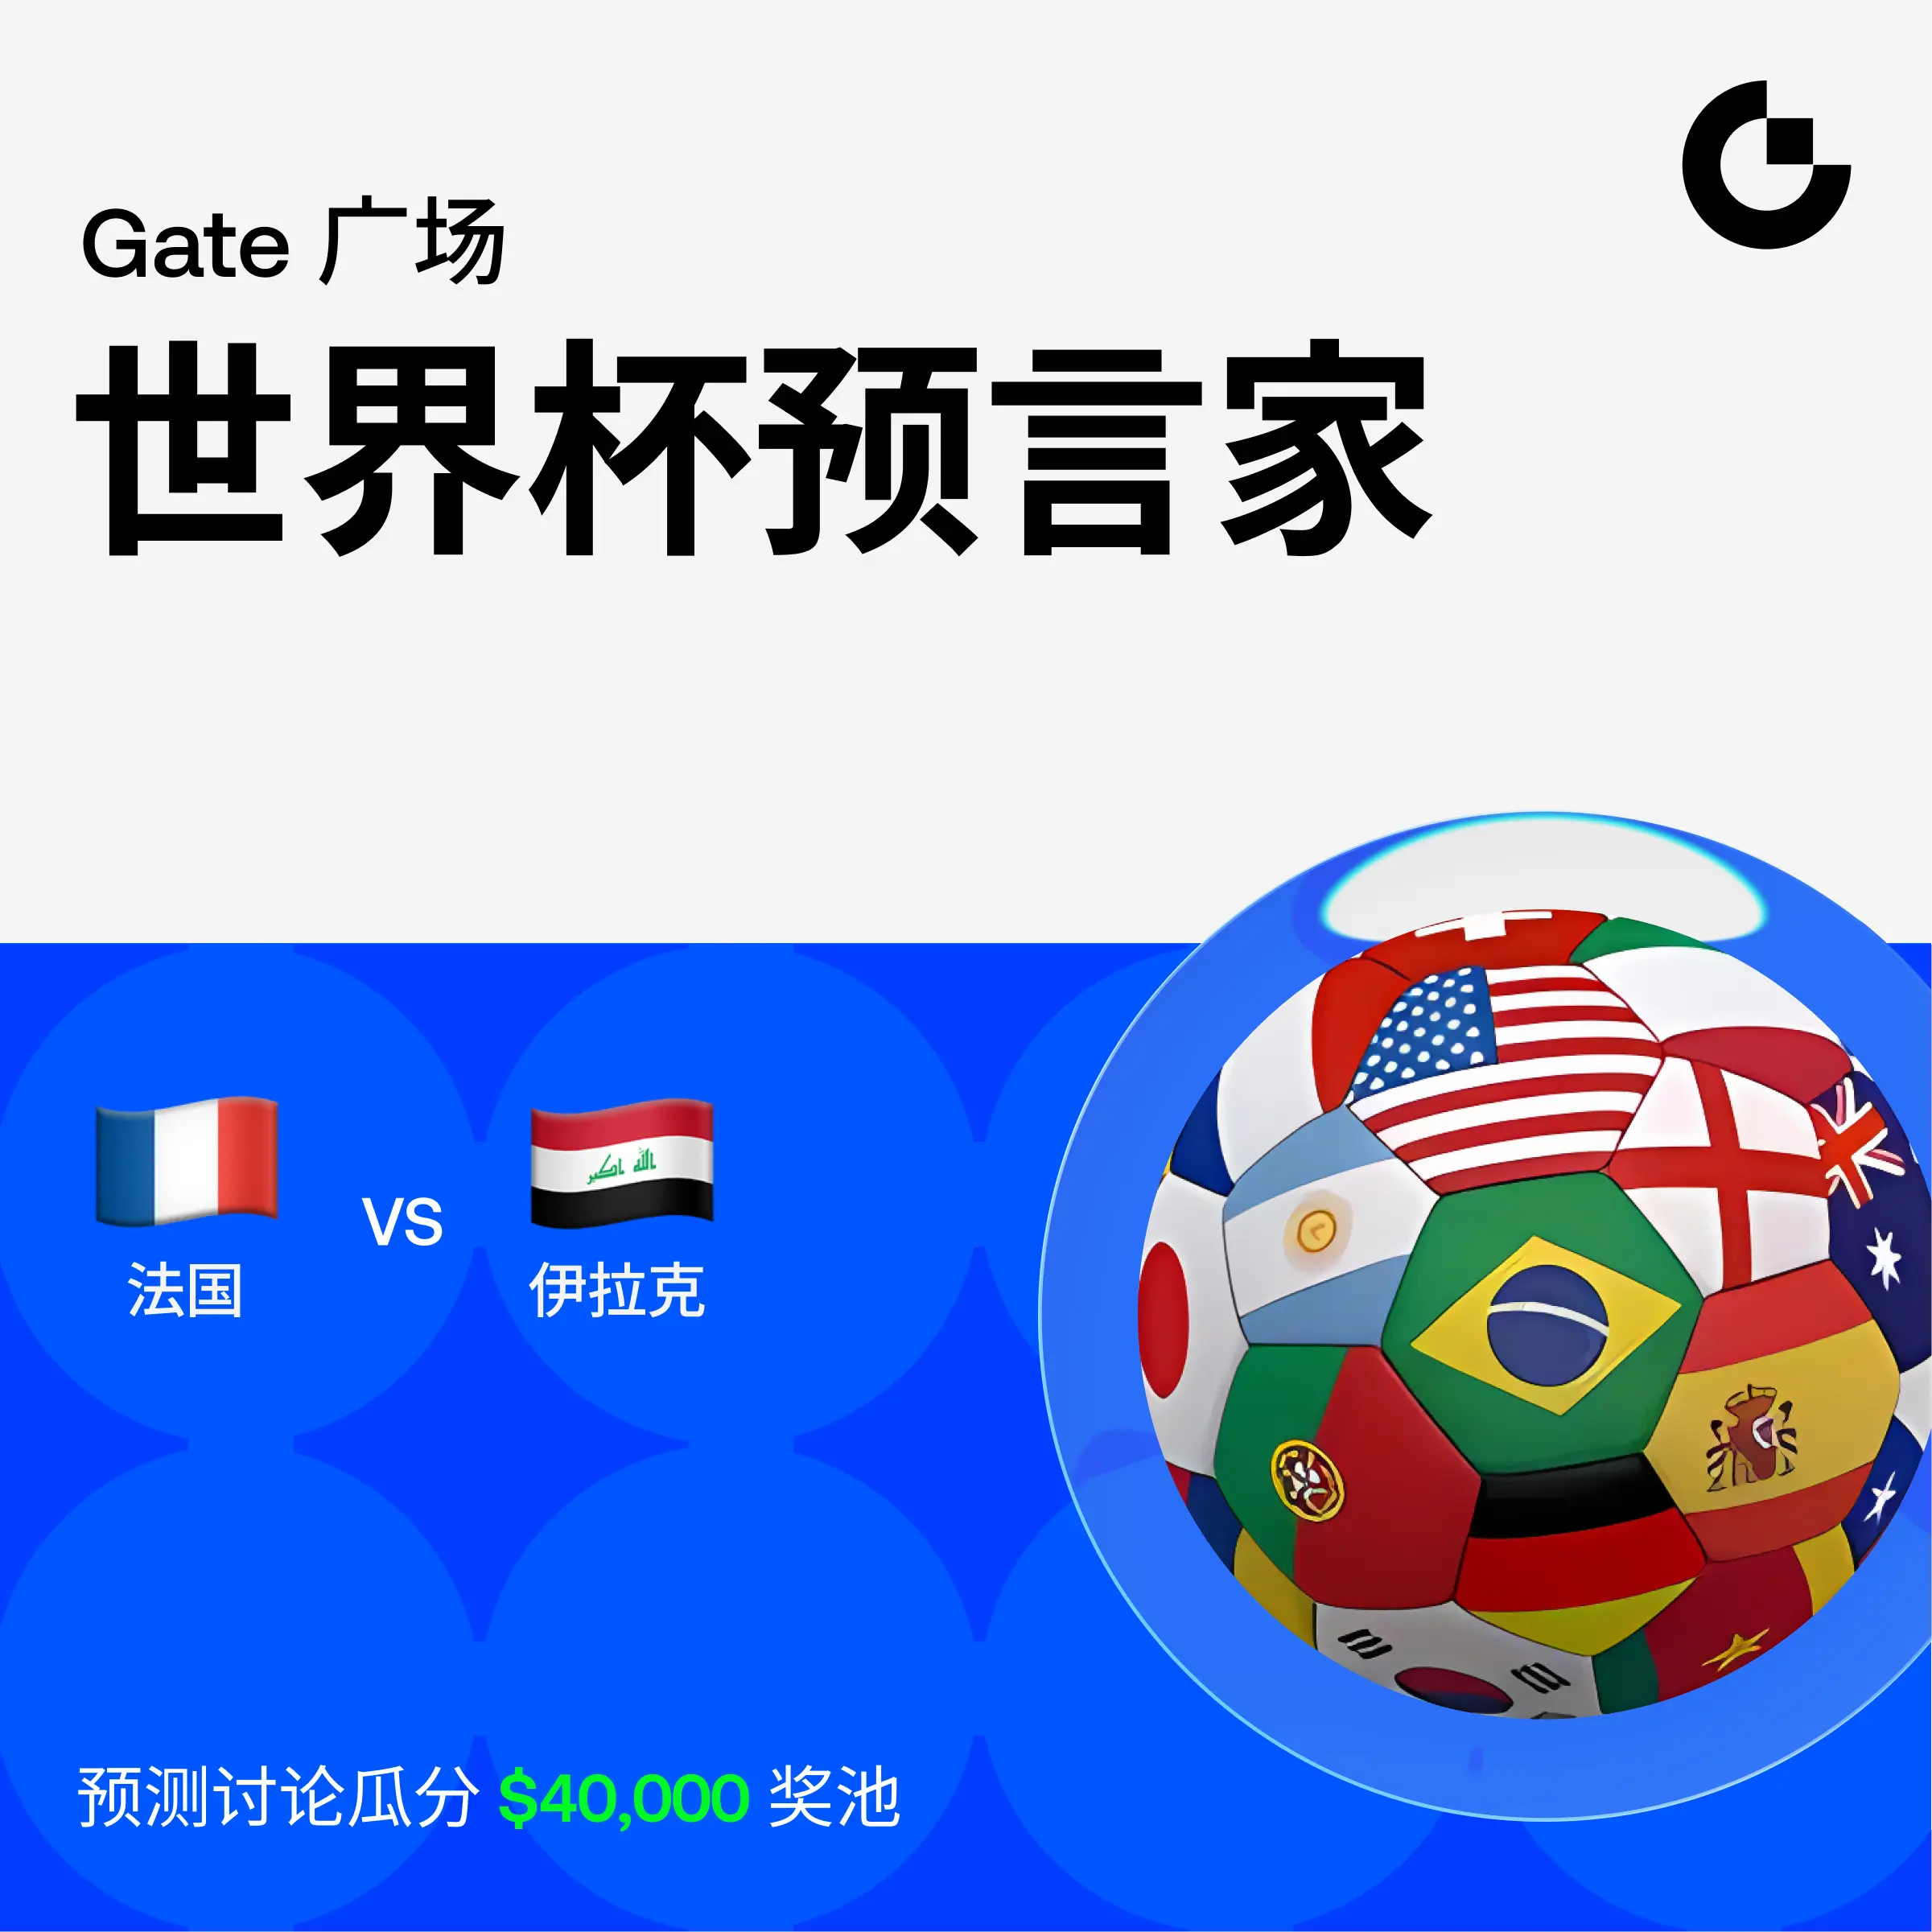
4️⃣ Prediction Markets: The World Cup delivers shock after shock—Cape Verde drew 2:2 with Uruguay, Iran held Belgium to a draw, and the prediction market is once again welcoming high-odds profit opportunities.
5️⃣ Square Updates: The Gate Square “#MyGateTradingMoment” event has only the last two days remaining—this is your final chance to join in sharing the $30,000 USDT rewards.
1️⃣ Geopolitical Situation: Trump warns Iran in a post, demanding that the immediate stoppage of Lebanese proxies’ provocations, or else Iran will be hit again “harder than last week,” casting a shadow once more over the ceasefire agreement.
2️⃣ Market Dynamics: BTC is at $64,513, up 0.42% over 24 hours; rising tensions in the Strait of Hormuz have heightened market caution.
3️⃣ Security Incidents: Taiko ERC20 Vault was attacked, with losses exceeding $1 million; Ethereum’s largest “sandwich” arbitrage bot was hit with a reverse attack, resulting in losses of $7.5 million.
4️⃣ Prediction Markets: The World Cup delivers shock after shock—Cape Verde drew 2:2 with Uruguay, Iran held Belgium to a draw, and the prediction market is once again welcoming high-odds profit opportunities.
5️⃣ Square Updates: The Gate Square “#MyGateTradingMoment” event has only the last two days remaining—this is your final chance to join in sharing the $30,000 USDT rewards.