Share crypto content and earn up to 60% commissions through content mining.
placeholder
gatefun
DOGE bulls fake a move around 0.07525—are the bears immediately closing the net?

$DOGE /USDT - SHORT

Trading plan:
Entry: 0.07515 – 0.07535
SL: 0.07618
TP1: 0.07455
TP2: 0.07409
TP3: 0.07339

Why focus on this setup?
- The 1D trend is clearly bearish; the 4h signal points to SHORT—95% confidence isn’t just for show.
- Around 0.07525, RSI on 15m = 57; rebounds lack strength—this is the entry window.
- Downside targets: TP1 = 0.07455, TP2 = 0.07409; the risk-reward ratio is close to 3:1. SL set at 0.07618, risk is controllable.
- Why now? EMA suppression + declining volume—an anti-bull trap
DOGE1.51%
View Original
post-image
  • Reward
  • Comment
  • Repost
  • Share
#LIT
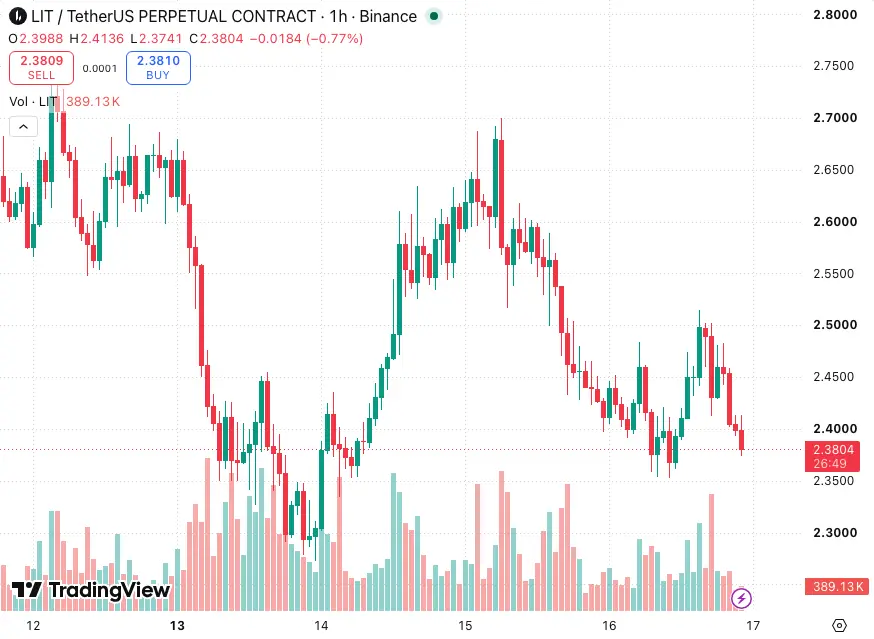
Lighter is an Ethereum-based Layer 2 decentralized perpetual exchange (DEX) that has gained significant attention in the crypto market. The platform recently announced the completion of its Q2 share buyback program, burning 15.63 million LIT tokens, which has contributed to the current bullish momentum in the token price.
Current Market Status
As of the latest data, LIT is trading at approximately 2.59 USDT, showing a positive change of 3.64 percent with a price increase of 0.0910 USDT. The 24-hour trading volume stands at over 11 million USDT, indicating healthy liquidity and active mar
post-image
  • Reward
  • Comment
  • Repost
  • Share
$LTC
LTC is charting its own course
While the overall picture remains in a fear zone, LTC is currently up 1.18% around $45.12, stabilizing in a narrow range. The market is hesitant, but LTC is managing to hold its ground.
The key difference here is the divergence between sentiment and technical analysis. While the Fear and Greed Index hovers around 32, the RSI for LTC is at 62.2, shifting from neutral to strong. The MACD histogram is near the zero line, short-term momentum is neutral, meaning there's an upward trend but no overheating. Funding is also calm.
On-chain analysis supports this sta
LTC1.86%
post-image
  • Reward
  • Comment
  • Repost
  • Share
#WorldCupChampionPrediction
As the FIFA World Cup 2026 enters its decisive stage, every remaining match has the potential to reshape the race for the biggest prize in international football. Knockout football is no longer about simply playing well for ninety minutes. Success now depends on tactical discipline, squad depth, mental strength, and the ability to perform under immense pressure. With only a handful of teams still competing, the championship picture has become much clearer.
Based on current performances, tactical consistency, squad quality, and the latest sentiment reflected in pred
post-image
  • Reward
  • Comment
  • Repost
  • Share
Name a #memecoin that you think can do #100x in just one year: ⁉️
MEME2.73%
post-image
  • Reward
  • Comment
  • Repost
  • Share
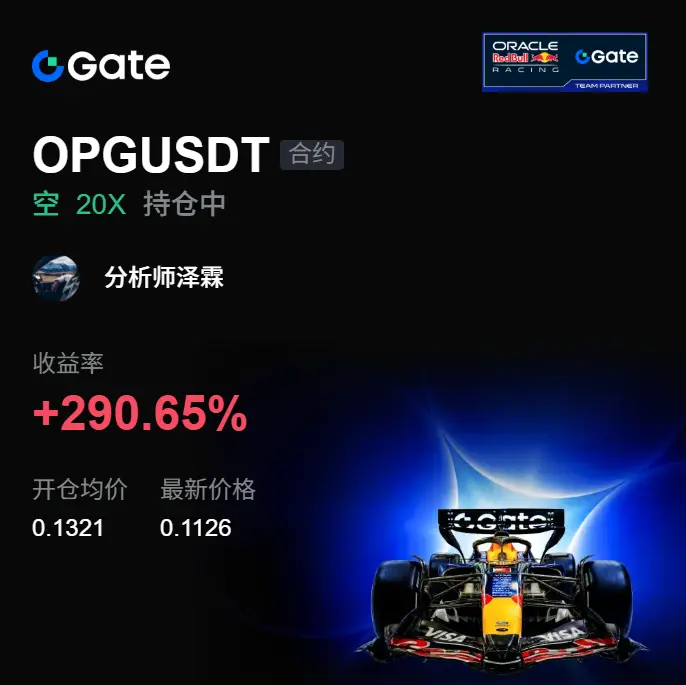
This short trade is pretty straightforward. When $OPG was suppressed at higher levels and didn’t break through, I felt this bullish move didn’t look right—on the surface it’s still ranging, but in reality it already started leaking strength.

When the price neared 0.2047, what really caught my attention was that the rebound had no volume. It pushed up and got pressed back immediately, indicating that the above-side capital was unwilling to keep taking. I didn’t try to guess the top here; instead, I waited for weak signals to confirm and then went long. Now the price is already at 0.1181, and
OPG-5.07%
BTC0.55%
ETH1.85%
View Original
post-image
  • Reward
  • Comment
  • Repost
  • Share
Identifying candlestick patterns
gate liveLIVE
61
  • Reward
  • Comment
  • Repost
  • Share
This short position finally paid off. The sharp drop from the high in $FARTCOIN —many people were still hesitating whether to catch the rebound. At the time, I wasn’t watching for the excitement; I was checking whether the pressured level would be breached again.
When the price had earlier pushed to around 0.17378, the strength of the K-line rebound was already clearly off. There wasn’t enough follow-through above, and the capital didn’t look like it was going to keep pushing upward. So I chose to open a long in line with the weakness. Now the price is at 0.1526, and this floating profit is alr
BTC0.55%
ETH1.85%
View Original
post-image
  • Reward
  • Comment
  • Repost
  • Share
Silver $XAG /USDT short-term bearish signal — is 59.84 a trap?
XAG_USDT - Sell SHORT
Trading plan:
Entry: 59.81 – 59.87
SL: 60.09
TP1: 59.65
TP2: 59.52
TP3: 59.33
Why focus on this structure?
On the 4-hour timeframe, a SHORT signal is triggered; on the 15-minute RSI, it has already dropped to 40.99, and bearish momentum has not yet exhausted.
- Entry 59.84, TP1: 59.65, TP2: 59.52, stop loss 60.09, with a reasonable risk-reward ratio.
- The 1D trend is range-bound; currently near the upper edge of the range, with bearish odds favored.
Discussion:
Will this leg of the bearish move hit TP2 fi
XAG-0.13%
View Original
post-image
post-image
  • Reward
  • Comment
  • Repost
  • Share
$12,000,000 LP at just $200M
“single sided” 😆😆
AT-2.78%
post-image
  • Reward
  • Comment
  • Repost
  • Share
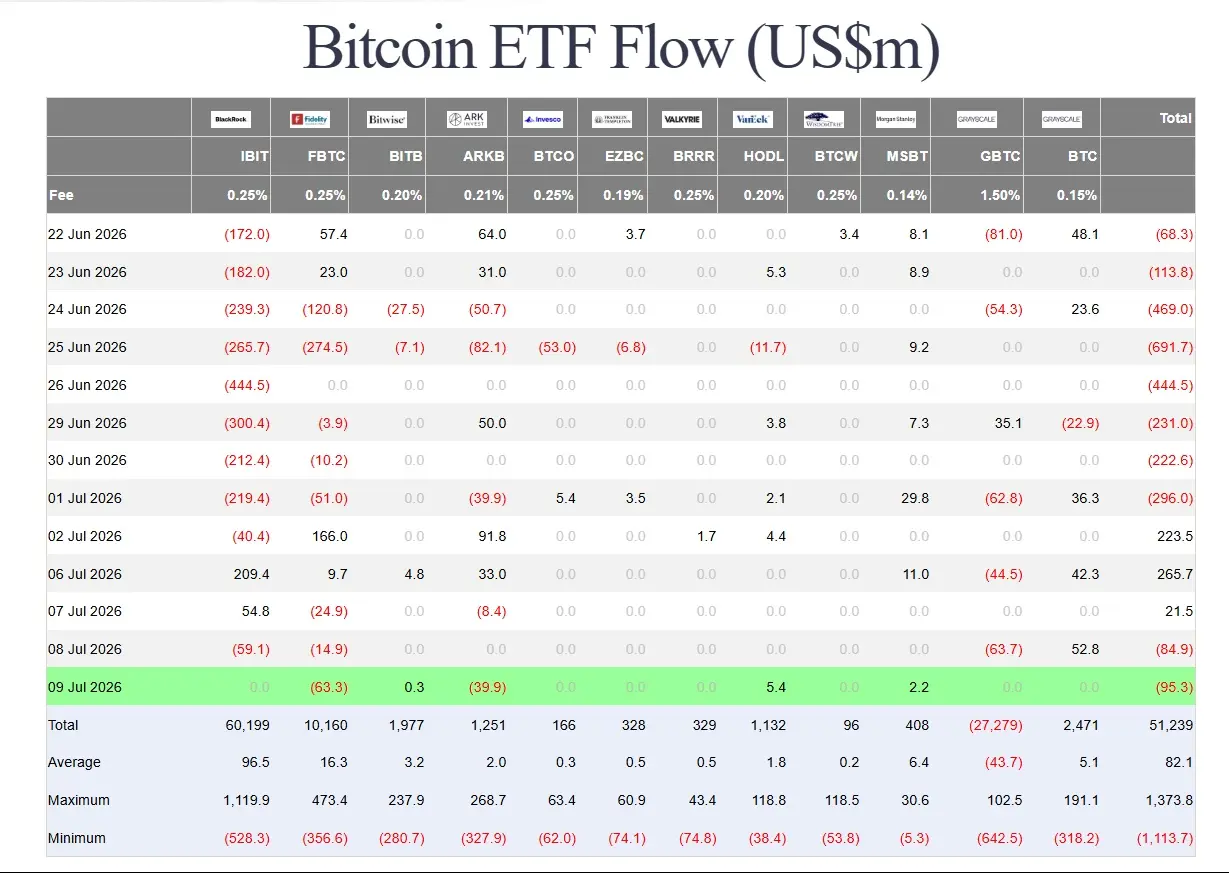
#加密市场观察 Today in the crypto world, prices can’t really rise, and they don’t fall deeply—but one data point has set a historical record.
Saturday, July 11, 2026. Bitcoin opened at $63,196, hit a high of $64,580, and closed at $64,156. In 24 hours, it rose 1.39%, and over 7 days it gained 2.51%. If you bought the dip when it hit the July 1 low of $57,000, you’re now up about 12%—but if you entered at the end of May when it was around $77,000, you’re still down 17% on paper.
But the biggest thing in crypto today isn’t whether prices are up or down—it’s that Bitcoin has been consolidating in the
BTC0.59%
BLK1.57%
IBIT1.11%
post-image
  • Reward
  • Comment
  • Repost
  • Share
$CL /USDT 4-hour SHORT signal—do you dare to follow it?

CL_USDT - Go short (SHORT)

Trading plan:
Entry: 71.75 – 71.89
SL: 72.45
TP1: 71.35
TP2: 71.04
TP3: 70.57

Why focus on this setup?
- Current price 71.82: EMA 4h confirms a bearish trend; RSI on 15m has fallen to 58.85, not overbought.
- Why now? 1D is in a ranging zone; 4h short signal + 55% confidence. TP1 71.35 has support, and SL 72.45 is a reasonable stop loss.
- If it breaks 71.77, the signal is invalid—avoid chasing the short.

Discussion:
Take profit at TP1 first (71.35), or directly wait for a rebound to hit and sweep the SL
CL0.62%
View Original
post-image
post-image
  • Reward
  • Comment
  • Repost
  • Share
Guys, who understands this! I opened the chart in the morning and instantly got sober 🚀 $EIGEN This long order finally gave an answer—after grinding people so much they wanted to throw their phone. Walking out of it really is amazing. A few days ago, when I was watching in the early morning, EIGEN’s pullback kept failing to break, the bottom was consolidating and it didn’t break down either, and the buy orders were still quietly picking up 📌 At the time, I already reminded myself: don’t rush into random selling/cutting. Going long, what you’re looking at is the rebound space after the key l
EIGEN-1.29%
BTC0.55%
ETH1.85%
View Original
post-image
  • Reward
  • Comment
  • Repost
  • Share
Many people were still hesitating just now, but $UNI already gave the answer. Longs went from 3.050 to 3.776, now they’ve locked in +1692.5%—this leg of the move is clearly extended, and the chart is more decisive than expected.

Earlier I’d already been watching this level; what really caught my attention was that during the pullback, it didn’t get heavy-volume sold through. Instead, every time it got pressed down, someone kept stepping in. Back then it looked frustrating, but a grinding range is precisely what filters people: those who are impatient leave first, those who are afraid don’t d
UNI7.40%
BTC0.55%
ETH1.85%
View Original
post-image
  • Reward
  • Comment
  • Repost
  • Share
Woke up feeling energized!😎 A few days ago, when everyone was still watching from the sidelines in the afternoon, the price action kept grinding the bottom repeatedly. The point I was watching was simple: pull back and hold, and there are people down below ready to take it—there was a hint that some funds were quietly moving in. So back then I went long.
Once you get it, execute—don’t hesitate at the last step before the finish line.
From entering at 0.14733, to now 0.1577, the return is +500.26%. This move is basically nailing the timing.📈🔥 It was truly just grinding earlier, and when it f
APE-0.93%
BTC0.55%
ETH1.85%
View Original
post-image
  • Reward
  • Comment
  • Repost
  • Share
Kept grinding a few days ago; today they just deliver the answer directly! This chart really knows how to mess with people 📉😎
When the chart hadn’t fully started yet, $ORCA looked fierce on the pump—but once it went up, nobody was there to take it. The volume couldn’t keep up. I watched it get pressured at the highs, then I decided this isn’t a good spot to chase long. At that time, calling the short direction felt more natural 📢👀

Entry reference: 1.4853. Now it’s already at 1.1932, profit +484.39%. This grind wasn’t in vain—got the rhythm nailed ✅🔥💰

Take profit when it’s time to ta
ORCA-0.15%
BTC0.55%
ETH1.85%
View Original
post-image
  • Reward
  • Comment
  • Repost
  • Share
After this drop has played out and moved through, those who were stubbornly holding through the rebound should be able to feel the key levels already. $TRX isn’t suddenly weakening—it’s just that after multiple failed attempts to push up from the high level, the rhythm had already turned bearish.
What I entered for was around 0.37331. If price can regain and hold that area, the short position logic should tighten; but what actually happened was a failed pullback and a downward shift under pressure. The key is right here. After the short side confirmed, I followed with a trade. Now the price is
TRX-0.05%
BTC0.55%
ETH1.85%
View Original
post-image
  • Reward
  • Comment
  • Repost
  • Share
SNDK on the 4-hour timeframe, the short signal has already lit up.

$SNDK /USDT - SHORT sell

Trading plan:
Entry: 1962.59 – 1971.45
SL: 2009.55
TP1: 1935.12
TP2: 1913.86
TP3: 1881.96

Why focus on this setup?
- The current price is trading below the EMA, and the RSI on the 15-minute timeframe is already overbought (64.78), increasing the pressure for a near-term pullback.
- The 1-day trend is ranging, but the 4-hour short structure is clear; the entry reference is 1967.02, with TP1 targeting 1935.12 and a reasonable risk-reward ratio.
- Why now? Wait for confirmation of the signal, then en
SNDK1.50%
View Original
post-image
post-image
  • Reward
  • Comment
  • Repost
  • Share
Everyone is getting bullish right below a major resistance. 👀
BTC is approaching 66.7K–68K, where several technical signals are converging:
• 4H MACD nearing a bearish crossover
• RSI approaching overbought
• Fibonacci 0.618 + previous swing high = strong resistance
The risk/reward for fresh longs is becoming unattractive.
I’m not blindly shorting. I’ll wait to see how price reacts at resistance.
📉 Rejection + weak momentum = potential short setup.
📈 Strong volume breakout above 68K = no trade. Buyers win, and I’ll wait for the next opportunity.
React to price. Don’t predict it.
Do yo
BTC0.59%
post-image
  • Reward
  • Comment
  • Repost
  • Share
WORLD CUP PREDICTION
gate liveLIVE
1,425
  • Reward
  • Comment
  • Repost
  • Share
Load More

Join 40 M users in our growing community

⚡️ Join 40 M users in the crypto craze discussion
💬 Engage with your favorite top creators
👍 See what interests you
  • Pinned