Crypto_Xincheng

vip
Active for: 5.3y
Peak Tier 5
Web3 Investor | Crypto Trading Practitioner BTC/ETH Dollar-Cost Averaging Sharing | Market Analysis + Jungle Opportunities Weekly Practical Tips | Helping You Avoid Pitfalls and Find Opportunities
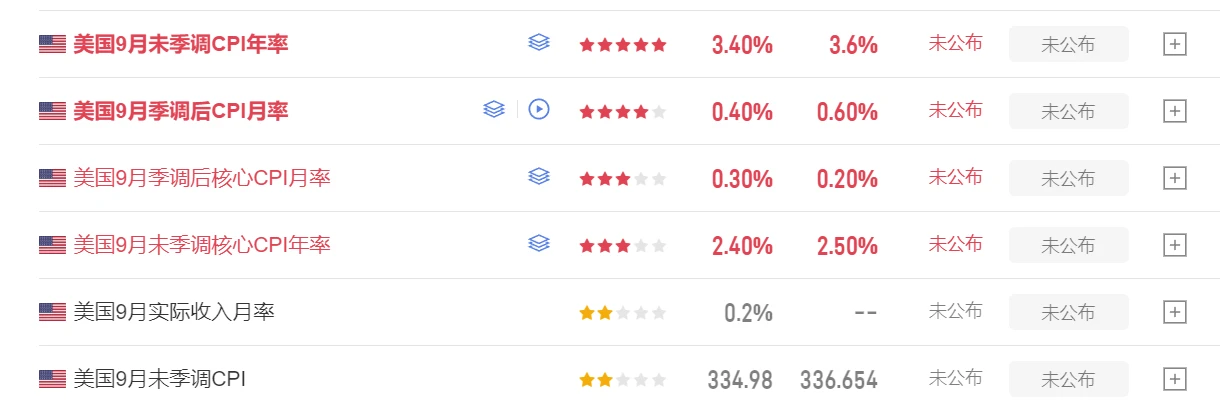
The U.S. August CPI will be released tonight at 20:30, 8:30 a.m. ET.
Market expectations: headline y/y at 3.4%, unchanged, and m/m at +0.4%; core y/y falling to 2.4% and m/m at +0.2%. The energy rebound is pushing up the headline figure, while core goods remain weak and services sticky.
This is the last key data release before the September rate decision. Payrolls have pushed the probability of a rate hike to around 60%. Core m/m is the threshold: at 0.3% or higher, rate-hike expectations would rise sharply; at 0.1%, they would cool notably. The composition matters more than a single figure.
W
post-image
ETH-0.12%
BTC-1.20%
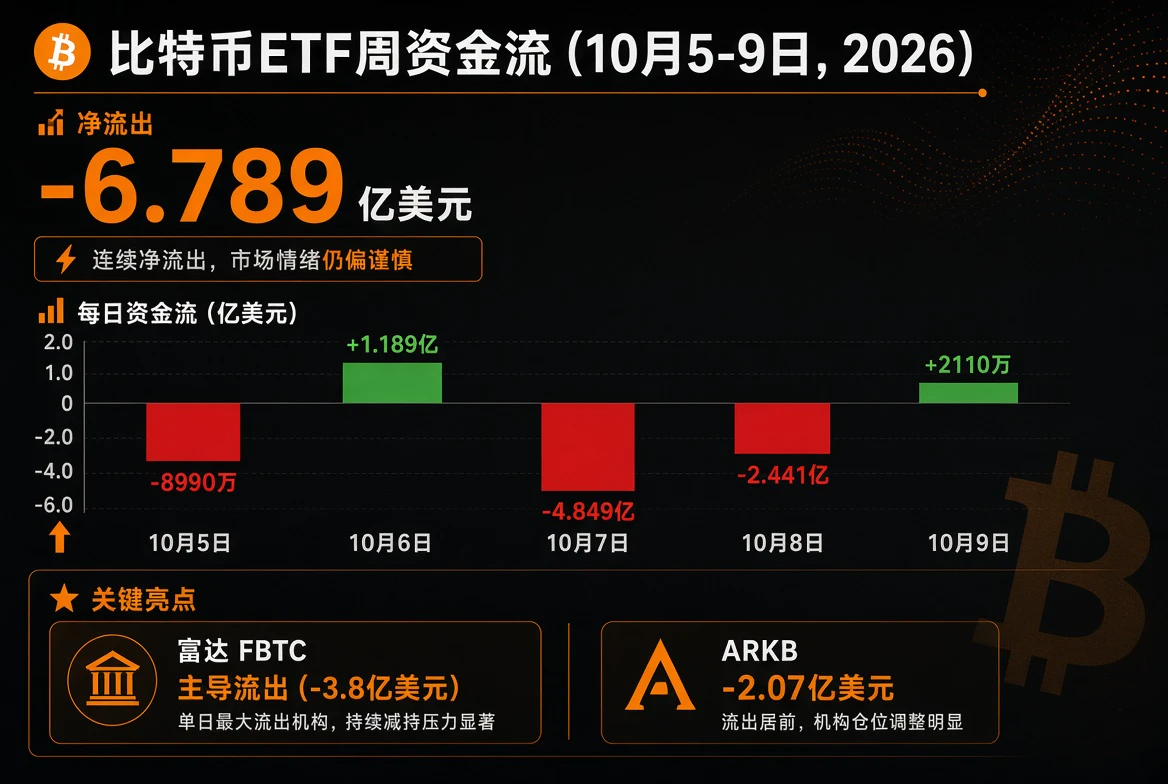
Bitcoin ETFs: Heavy inflows at the start of the month, three straight outflows after the holiday
On September 3, daily net inflows hit $730 million, the strongest day of the month. The direction changed immediately after Labor Day:
September 8 -$46.6 million
September 9 -$120 million
September 10 -$258 million
The three days saw approximately $425 million in outflows. ARKB dumped $240 million over two days, GBTC continued to see redemptions, IBIT only reduced slightly, while Morgan Stanley was still making symbolic purchases.
The cumulative monthly figure remains around +$270 million, an
BTC-1.20%
September 11 $BTC Comprehensive Market Analysis
Market news:
The U.S. August PPI released on September 10 came in hotter than expected: +0.4% month-over-month and 5.4% year-over-year, with energy making the largest contribution. At the same time, tensions in the Middle East pushed oil prices higher, with WTI rising above $100 and Brent briefly surging above $100 and even higher. The 10-year U.S. Treasury yield closed at around 4.94%–4.95%, while the 30-year yield was around 5.35%–5.36%, close to multi-year highs. Treasury buybacks of up to $6 billion the previous day failed to contain long-te
post-image
ETH-0.12%
BTC-1.20%
Tonight’s data: initial jobless claims came in at 206k, broadly in line with expectations; PPI rose 0.4% month-on-month, in line with expectations, and 5.4% year-on-year, slightly above expectations. Core PPI rose just 0.2% month-on-month, with the increase mainly driven by energy rather than broad-based overheating.
But employment remains tight, and year-on-year growth picked up again. The market has pushed the probability of a September rate hike to around 70%. The dollar and Treasury yields strengthened, while stocks and gold retreated first.
The real trigger is tomorrow’s CPI. The headline
post-image
GT+2.40%
ETH-0.12%
BTC-1.20%
$BTC The market has finally come down. I've been waiting for half a month, and it still moved down as I expected. I think the drop is far from enough.
Reasons:
①Macro: There is no certainty driving the market; it is just being pulled back and forth.
②Liquidity: Only traditional ETFs are entering, with no new capital coming in.
③Technical: Weekly zero-line resistance and daily divergence risk both indicate that a pullback is needed.
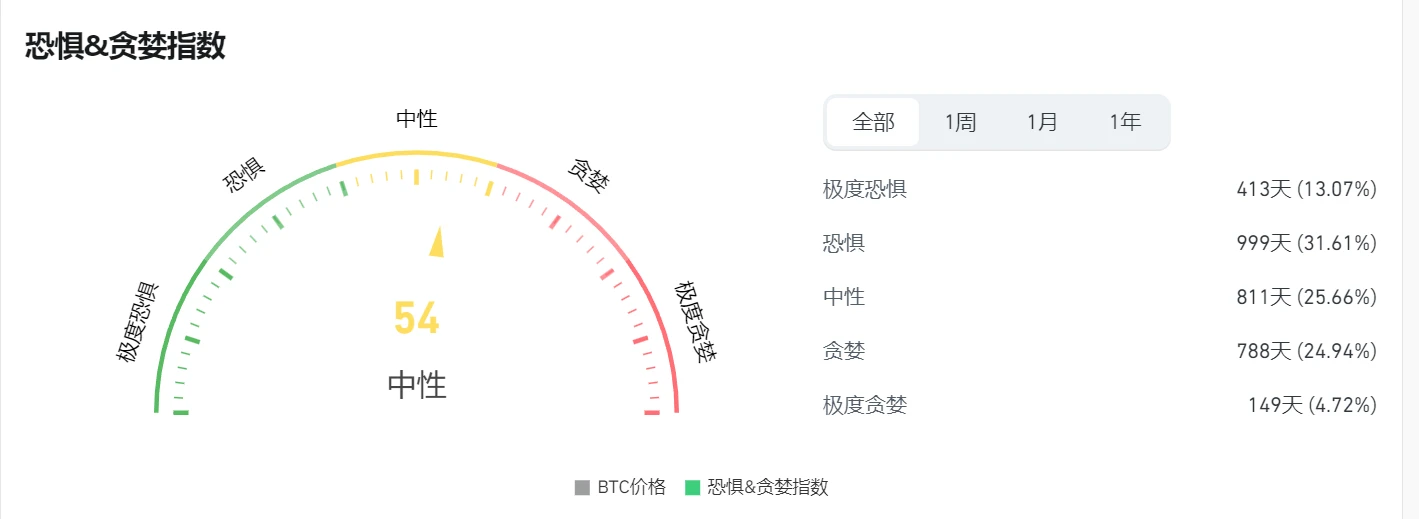
④Sentiment: The Fear Index is still hovering at 69, which indicates greed.
Therefore, none of these four aspects provides the conditions needed to start a major bul
post-image
ETH-0.12%
GT+2.40%
BTC-1.20%
Tonight at 20:30, U.S. initial jobless claims and August PPI will be released together.
Initial claims were 206,000 previously, with 205,000 expected. They will most likely continue hovering at low levels, with no clear easing in the labor market yet.
More importantly, PPI is expected to rise 0.4% month-on-month (previously 0) and increase to 5.3% year-on-year. It was flat in July, but is expected to pick up again in August.
With employment still resilient and producer prices potentially accelerating again, CPI is also due Friday. For the September rate meeting, the rate-cut narrative will be
post-image
GT+2.40%
ETH-0.12%
BTC-1.20%
September 10 $BTC Comprehensive Market Analysis
News:
Three macro developments converged on September 9:
①Brent closed near $101, breaking above $100 for the first time since July 24, prompting renewed inflation repricing
②The Treasury announced a Thursday buyback of up to $6 billion in long-term bonds, below some institutions’ $8–10 billion expectations, while the 10-year US Treasury yield jumped to around 4.85%
③The Middle East conflict escalated (the US military attacked Iranian oil tankers, while the Houthis attacked Saudi facilities), pushing up the risk premium
Interestingly, while US s
post-image
ETH-0.12%
BTC-1.20%
I just placed a short order at 2500 for $ETH . Here are my reasons:
① The weekly chart is encountering resistance at the zero line, while the daily chart has yet to firmly break above the key resistance at 2530 and continues to show bearish divergence
② The funding rate has turned positive, and longs are somewhat crowded
③ The interest-rate meeting is likely to be cautious, so I’m betting on a recovery move before the meeting
Target: 2452–2380
Stop-loss: 2550
If you agree, give me a follow. I’ll continue updating my trading logic.
post-image
ETH-0.12%
BTC-1.20%
September 9 $BTC Comprehensive Market Analysis
News:
Strong nonfarm payrolls pushed the probability of a rate hike on 9/16 to around 60%; oil prices are near 100; after the Liquid sidechain was hacked, a white hat returned most of the funds, weighing on sentiment. This week’s focus is the 9/11 CPI.
Fund flows:
ETFs still saw large net inflows last week, with a small outflow on the 8th; institutions have not withdrawn, while whales have been moving coins to exchanges in the short term. The Greed Index is around 66–69.
Technical analysis:
The daily chart remains above the moving averages, but 8
post-image
ETH-0.12%
BTC-1.20%
USD/JPY fell below 155. In one week, it plunged from above 160 to around 153, marking its strongest move since February. 155 was the floor established by the April intervention and the joint Japan-U.S. support operation in July. This time, it broke through without confirmation of a new intervention, as stop-losses on short positions and options hedging hit at the same time.
The backdrop is narrowing interest-rate differentials. Swaps are pricing in about a 98% chance of a 25-basis-point BOJ rate hike on September 18. Real wages have been rising for consecutive months, and officials say they sh
post-image
ETH-0.12%
BTC-1.20%
The Strait of Hormuz has started charging tolls again, sending oil prices soaring
Brent is back at 97–99, while WTI has risen to 94, rebounding about 18% in two weeks. Over the weekend, the U.S. military attacked an Iranian oil tanker, Iran attacked a U.S. vessel, and Saudi facilities were attacked again. Daily traffic through the strait has fallen to around 10 vessels, the lowest since May. One-fifth of the world's seaborne crude passes through here; with fewer ships, higher insurance premiums, and less shadow shipping, there is less oil that can actually be delivered.
More importantly, inven
post-image
Bitcoin perpetuals are worth about $23.9 billion, while altcoins total about $40 billion. For the first time in 21 months, altcoin positions have exceeded Bitcoin positions. But Bitcoin can be broken down further: shorts slightly outnumber longs in overall notional, while retail accounts are net long, leveraged funds on CME are net short, and spot ETFs are buying. Above $81k, about $470 million in shorts would be liquidated; below $79k, about $450 million in longs would be liquidated, leaving the two sides nearly balanced.
Altcoins do not provide a total figure for short positions across the e
ETH-0.12%
BTC-1.20%
September 7 BTC ETH Market Analysis
BTC
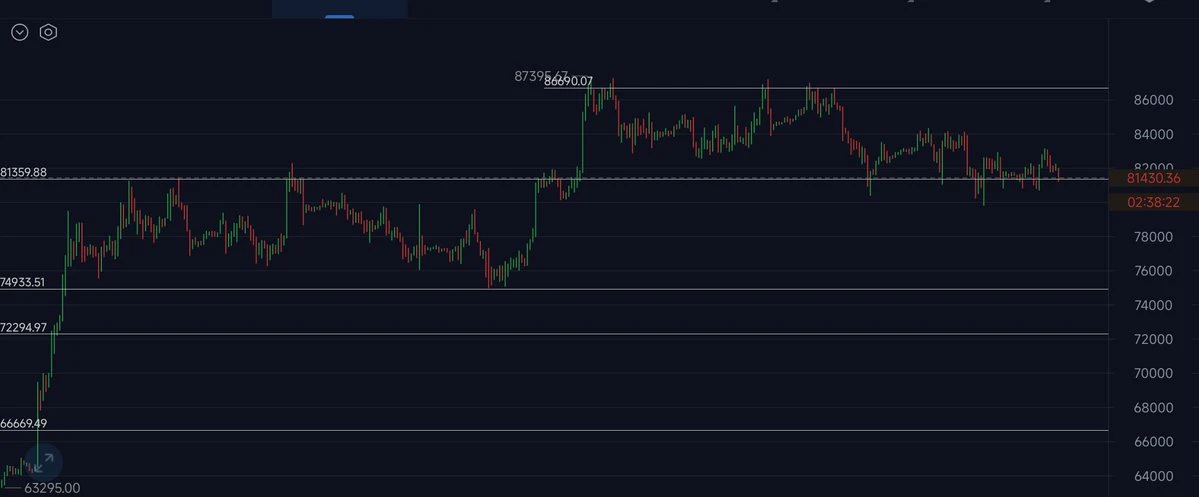
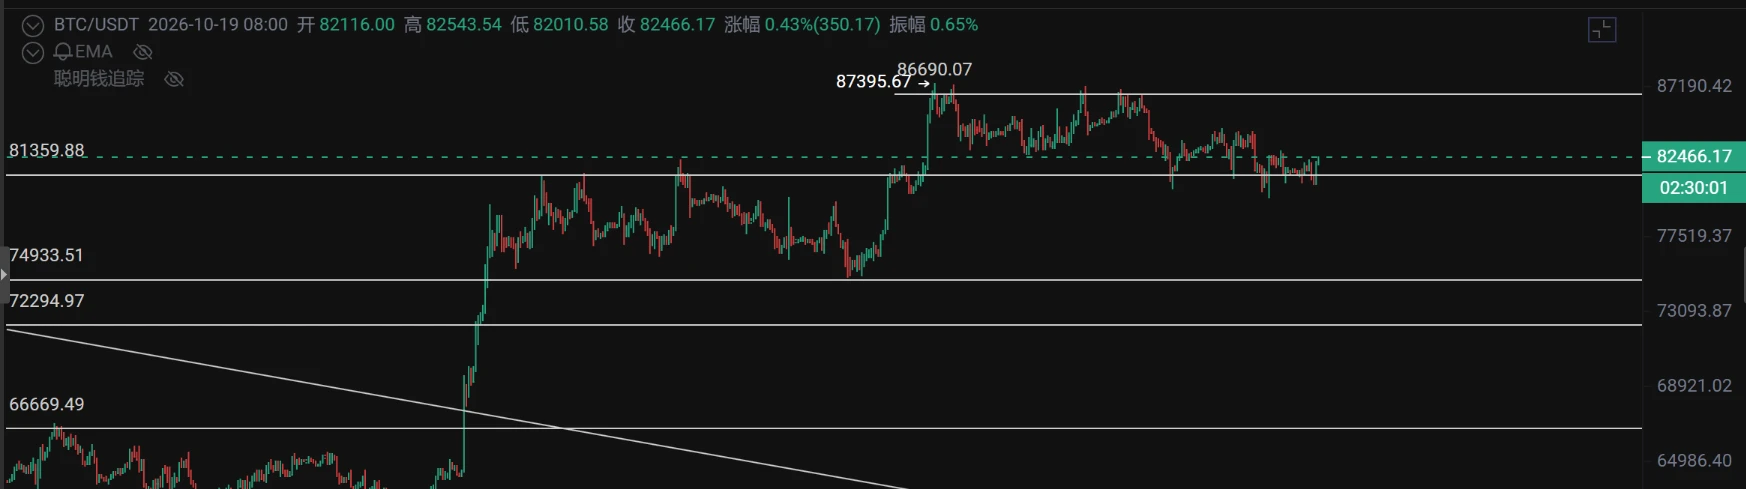
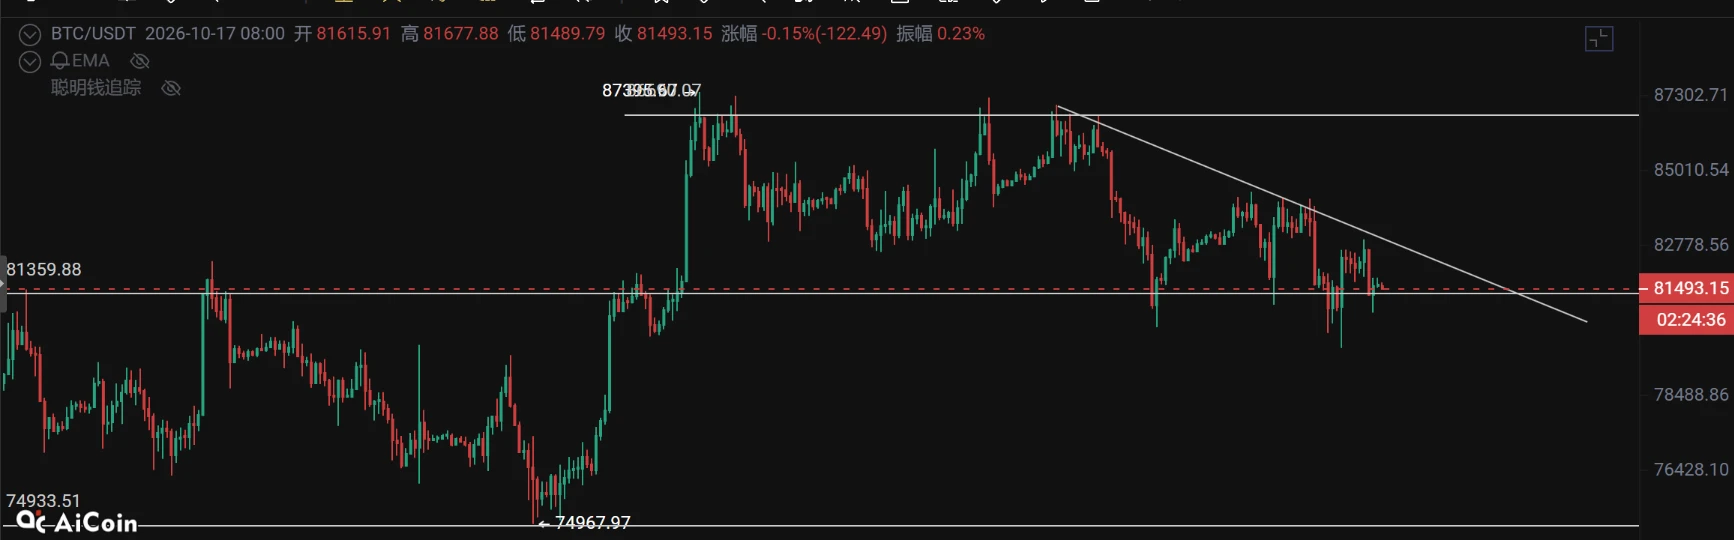
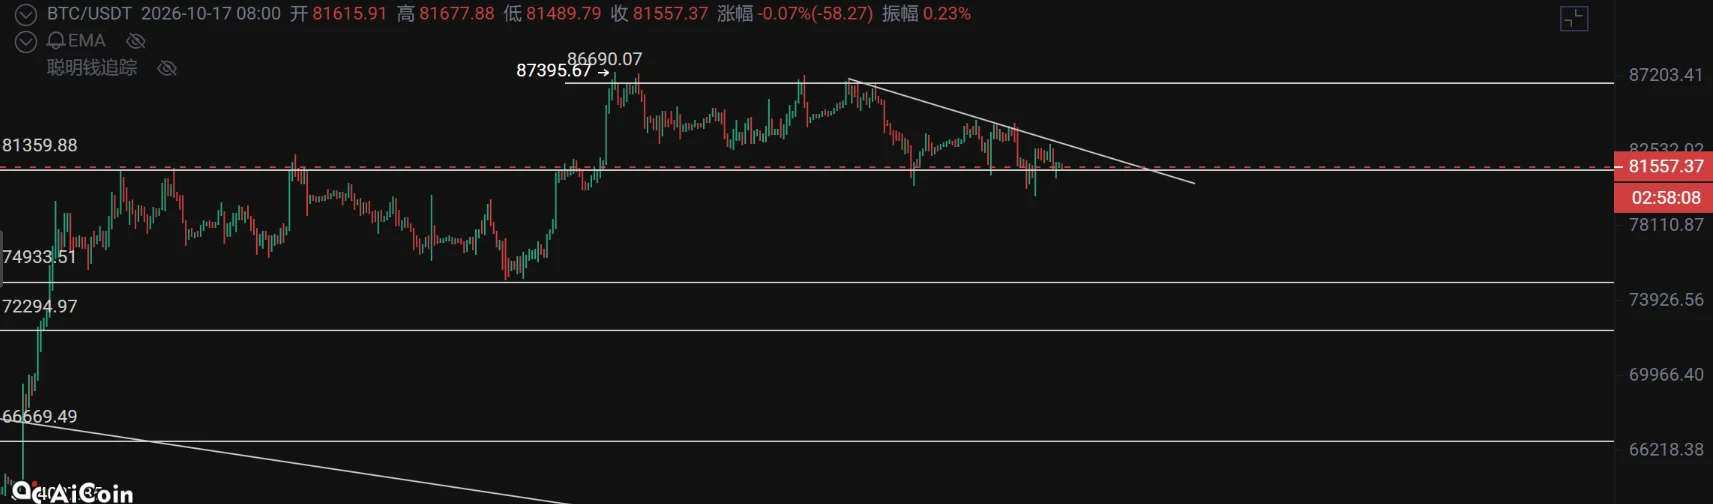
Bitcoin has been ranging in the current 76000 to 82300 zone for half a month. Personally, I believe it is time for the market to make a move from this level.
The weekly MACD is already close to reaching the corresponding resistance. After making a high at this level on the daily chart, it failed to effectively hold above 82300, while the daily chart continues to show divergence and the upward momentum is continuously weakening.
The four-hour chart has been moving around above the moving average, but personally, I believe the risks at this level still out
ETH-0.12%
BTC-1.20%
Last week’s spot ETFs for Bitcoin and Ethereum attracted a combined $1.2 billion. BTC saw about $987 million, while ETH saw about $216 million. The money was clearly skewed toward the leading assets.
The pace was chaotic at first, then synchronized. BTC saw $217 million in inflows on Monday; on Tuesday, it shed $237 million, the only net outflow of the week. On Wednesday, BTC saw $101 million in inflows, while ETH ended its 12-day winning streak with $48 million in outflows. Thursday brought a reversal—BTC posted $731 million in a single day, its largest inflow since mid-January; ETH simultane
ETH-0.12%
BTC-1.20%
This week's Bitcoin and Ethereum spot ETFs: chaotic at first, then aligned, with Thursday delivering the decisive blow.
BTC saw $217 million flow back on Monday, then gave up $237 million on Tuesday; ETH, meanwhile, extended its winning streak to 12 consecutive days. On Wednesday, $101 million flowed back into Bitcoin, while ETH's winning streak ended with $48 million in outflows. Thursday changed everything—BTC attracted $731 million in a single day, its largest inflow since mid-January and the third-largest this year; ETH also saw $141 million in inflows. The two markets combined for approxi
ETH-0.12%
BTC-1.20%
Bitcoin surged sharply last night
Starting from around $77.3k, it reached as high as approximately $82.2k and reclaimed the $81k level, gaining about 5% on the day. This marks the first time since May that it has climbed back above $81k.
The drivers were straightforward: Fed officials signaled support for holding rates steady, cooling rate-hike expectations; spot ETFs saw approximately $100 million in inflows the previous day, and risk appetite rebounded. ETH and SOL also gained around 5%, while the total crypto market capitalization rose in tandem.
It pulled back slightly to around $80.8k thi
ETH-0.12%
BTC-1.20%
View More