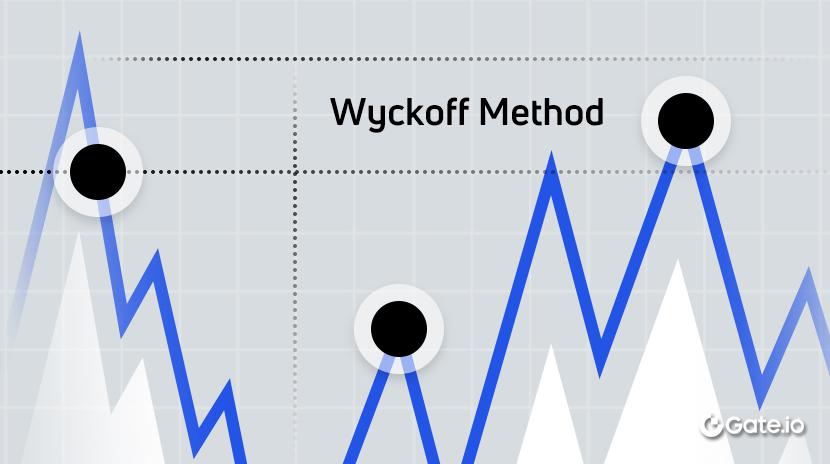
The Wyckoff Method combines price, volume, and market structure to study supply and demand across accumulation, markup, distribution, and markdown. Richard D. Wyckoff developed the framework through stock-market analysis; it helps form and test scenarios but cannot guarantee a trend or trading outcome.
2026-09-15 05:42:58
Traders often react to CPI releases, Federal Reserve decisions, elections, tariffs, regulatory developments, and other major events after the headline hits. But, that's when financial markets may already have priced in.
Prediction markets offer another way to understand what participants expect before an event takes place. Instead of predicting the future price of Bitcoin, a stock, or an index directly, they allow participants to trade contracts tied to specific outcomes, such as whether the Federal Reserve will cut interest rates or whether a piece of legislation will pass.
2026-09-15 02:10:16
Neither Fibonacci Retracement nor Bollinger Bands is universally superior for catching reversals. Fibonacci is a static support and resistance tool based on mathematical ratios. Bollinger Bands are a dynamic volatility indicator that expands and contracts as market volatility changes.
2026-09-14 14:08:07
Pivot Points are usually better for fixed, objective intraday support and resistance levels, while Fibonacci Retracement is better for identifying pullback zones within a broader trend. Neither is universally superior, so the better choice depends on market structure, timeframe, volatility, and whether the trader needs session-based levels or trend-based retracement zones.
2026-09-14 14:07:44
Fractals are generally better for identifying potential reversal points and local swing structure, while Parabolic SAR is more useful for tracking trend direction and managing exits once a market is already moving. Neither confirms a reversal by itself. For traders comparing Fractals vs. Parabolic SAR, the practical choice depends on whether the priority is locating an important price turning point or reacting to changing market momentum.
2026-09-14 14:07:18
For identifying the overall trend direction in real time, a Moving Average is generally more useful. For mapping meaningful swing highs and lows after price has moved far enough to confirm them, the Zig Zag indicator is clearer. The two tools solve different problems: Moving Averages smooth price data continuously, while Zig Zag filters out minor price movements and redraws price action around significant swings.
2026-09-14 14:06:55
Digitalizing U.S. Treasuries fundamentally transforms Actifs ownership and can significantly affect settlement, Collatéral management, and capital allocation. This article explores the operational framework of Tokenized Treasuries, focusing on capital Marché infrastructure, and assesses their potential impact on financial institutions, Trader mechanisms, and the long-term efficiency of capital.
2026-09-14 10:32:41
AI model capabilities cannot be directly equated with enterprise value. This article develops an AI enterprise valuation analysis framework based on factors such as revenue, computational costs, capital expenditures, profit margins, and security investment. It further explores how model capabilities translate into commercial revenue, cash flow, and long-term capital returns.
2026-09-14 10:31:28
Buying Bitcoin on Gate (Global site) generally involves a few simple steps including, create an account, complete identity verification (KYC) where required, choose a payment or funding method, and buy BTC through Quick Buy or the spot market.
2026-09-14 06:50:30
To withdraw crypto to a card or bank account, first convert the crypto into a supported fiat currency through a fiat withdrawal service, P2P marketplace, crypto card, or external exchange. Complete identity verification, check the available currency and withdrawal limits, enter the correct payment details, and confirm that the funds have arrived before closing the transaction. Available methods, fees, and processing times vary by platform and region.
2026-09-14 03:33:42
Crypto trading is the buying and selling of digital assets through an exchange or blockchain protocol in exchange for another asset or fiat currency. Beginners should understand wallets, exchanges, orders, and blockchain transfers before comparing spot, margin, and perpetual futures markets or evaluating fees, liquidity, volatility, and account-security risks.
2026-09-14 03:23:10
Arbitrage trading is an investment strategy that involves taking advantage of price differences of similar currencies or commodities in different markets, and it is common across stocks, bonds, commodities, and crypto.
2026-09-11 11:49:19
Gate CrossEx is Gate's cross-exchange trading platform built around one unified account for multiple exchange markets. It combines shared margin, cross-exchange PnL aggregation, unified risk control, and API-based execution to improve capital efficiency for arbitrage and quantitative trading workflows.
2026-09-11 09:41:19
The true value of AI capital expenditure isn’t found in the investment amount alone—what matters is whether it can eventually drive revenue, productivity, profit margins, and sustained EPS growth.
2026-09-10 10:10:13
The Fractals indicator is a technical analysis tool developed by Bill Williams to mark potential turning points in price action. A standard fractal pattern uses five consecutive price bars: a bullish fractal has the lowest low in the middle, while a bearish fractal has the highest high in the middle. Because two candles must appear after that middle candle, the fractal isn't confirmed until the fifth candle closes.
2026-09-10 09:51:43