Crypto day traders use candle closes, trading volume and retests to distinguish potential continuation from reversal setups. The challenge is avoiding false breakouts when liquidity changes around major session openings.
Key Takeaways
-
Session breakout trading focuses on price movements beyond the Asian, London or New York session range.
-
A genuine breakout becomes more convincing when price closes beyond support or resistance with volume expansion and follow-through.
-
Session rejections occur when price tests or briefly crosses a key level but fails to sustain the move.
-
A breakout retest rejection can indicate continuation when the broken level holds as new support or resistance.
-
Proper risk management requires predefined entry conditions, stop-loss placement and realistic profit targets.
What Is Session Breakout Trading?
Session breakout trading is a price action strategy that targets movements beyond support and resistance levels established during specific trading hours.
Unlike traditional stock markets, cryptocurrency trades continuously. However, trading activity changes as Asian, European and American market participants become active.
These transitions can produce larger price swings, especially when price approaches a previous session high or low.
For example, Bitcoin may trade sideways during the Asian session before breaking above that range during London trading hours.
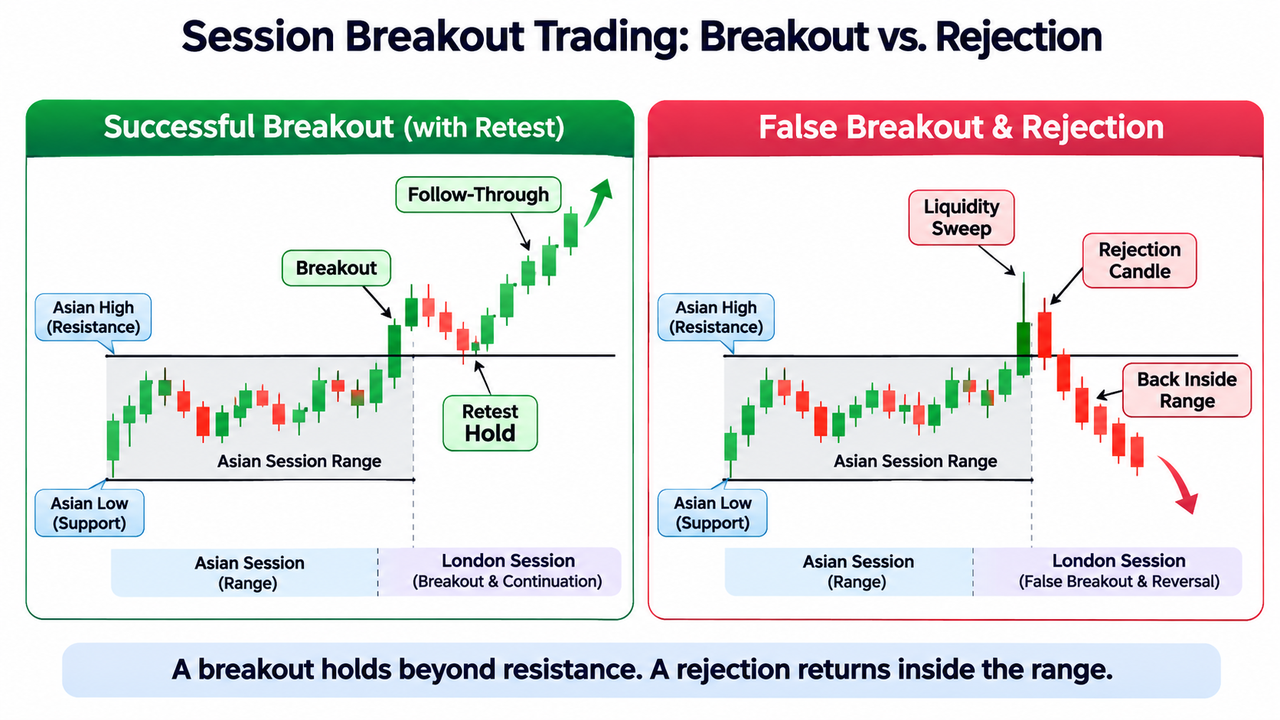
Two outcomes are possible:
-
Successful breakout: Price pushes past resistance, holds above the breakout zone and continues in the same direction.
-
Failed breakout: Price briefly moves beyond resistance but returns inside the previous range, potentially creating a reversal opportunity.
The distinction depends on what happens after the initial break.
The CME Group's explanation of support and resistance describes previous highs, lows and other price zones as reference points where buying or selling interest may influence market direction.
For session trading, those levels provide the setup. Price behavior determines whether the trade is justified.
How the Asian Session, London Session and New York Session Affect Breakouts
Crypto markets operate 24/7, but regional trading hours create recognizable periods of changing participation.
| Trading Session |
Typical Market Behavior |
Trading Focus |
| Asian session |
Ranging or directional activity, depending on liquidity |
Establish session highs and lows |
| London session |
Potential volatility expansion around European activity |
Breakouts and liquidity sweeps |
| New York session |
US market participation and economic announcements |
Continuation, rejection and reversals |
The London session is commonly associated with approximately 8:00 a.m. to 4:30 p.m. UK local time, although exact market hours vary. The UK also observes daylight saving time.
In forex trading, GBP/USD and other currency pairs often attract attention around the London opening. Crypto traders can apply similar timing principles to BTC/USDT and ETH/USDT without assuming that forex volume patterns transfer directly to crypto.
London and New York overlaps may produce stronger activity, but low liquidity windows and unexpected announcements can disrupt familiar patterns.
The best trading hours for crypto depend on whether the objective is a breakout, short-term reversal or broader trend entry.
How to Trade Session Breakouts: A Complete Guide
Step 1: Identify the Session Range
Start by marking the highest and lowest prices recorded during a completed session.
For example, suppose BTC/USDT forms an Asian session range between $70,000 and $70,400.
The upper boundary becomes resistance, while the lower boundary represents defined support.
These prices are hypothetical.
Mark nearby levels from the four-hour or daily chart as well. A session high directly beneath strong daily resistance may offer less room for continuation.
Step 2: Wait for the Breakout Candle
A bullish breakout develops when price pushes past session resistance. A bearish breakout occurs when price moves below key support.
Don't treat every wick beyond the range as a true breakout.
Look for a completed breakout candle closing beyond the level, preferably with above-average volume.
A clean breakout may also show strong candle bodies and limited immediate selling or buying opposition.
The volume and ATR strategy combines trading participation with volatility expansion to assess whether a move has sufficient momentum.
Still, high volume alone cannot guarantee a successful breakout.
Step 3: Confirm the Retest Hold and Follow Through
After breaking resistance, price may return to test the broken level.
If buyers defend that area, former resistance can become new support.
A bullish rejection candle, long lower wick or strong close above the level can indicate that the retest hold is developing.
For bearish setups, previous support may become new resistance.
The breakout confirmation and retest approach favors waiting for evidence that the market can defend the broken level.
A breakout retest rejection signals potentially strong market momentum when price resumes moving in the breakout direction.
But the trade-off is time. Some genuine breakouts move quickly without returning to the original breakout zone.
Step 4: Define Entry, Stop-Loss and Take-Profit Levels
Consider a hypothetical bullish BTC/USDT setup.
| Trading Component |
Example |
| Asian session resistance |
$70,400 |
| Breakout candle close |
$70,500 |
| Retest rejection |
$70,420 |
| Entry |
$70,520 |
| Stop-loss |
$70,320 |
| Take-profit |
$70,920 |
| Planned risk-reward |
1:02 |
The entry follows a confirmed rejection, while the stop-loss sits beyond the support zone.
Here, the planned risk is $200 per BTC, against a $400 potential reward.
A trader using the BTC/USDT spot market on Gate.com can examine live candlesticks and trading volume to identify comparable session structures.
Position sizing must reflect account risk, trading fees and possible slippage.
How to Identify False Breakouts and Session Rejections
False breakouts occur when price crosses a support or resistance level but fails to remain beyond it.
Suppose Bitcoin's Asian session high is $70,400.
During London trading hours, price briefly reaches $70,550 before falling back below $70,400.
That movement may represent a liquidity sweep, especially if stop orders and breakout entries were concentrated around the session high.
However, the wick alone doesn't prove that liquidity was deliberately targeted.
A stronger rejection setup develops when price closes back inside the range, forms a bearish reversal candle and shows further downside movement.
The buying and selling pressure visible through price and volume can help determine whether sellers are gaining control.
False Breakouts vs Genuine Breakouts
| Signal |
Genuine Breakout |
Failed Breakout |
| Candle close |
Beyond the range |
Back inside the range |
| Volume |
Often expands |
May be weak or unusually high |
| Retest |
Broken level holds |
Broken level fails |
| Follow-through |
Sustained movement |
Rapid reversal |
| Price structure |
Continuation develops |
Previous range reclaimed |
Fakeouts happen even during high-volume trading.
That matters because a large breakout candle can represent aggressive buying, stop-loss execution or liquidation activity rather than sustainable demand.
The identification of false breakouts relies on combining candle closes, retests and momentum rather than trusting one signal.
Common Mistakes in Session Breakout Trading
Most trading errors begin when traders assume that a session high or low must produce a predictable reaction.
Common mistakes include:
-
Entering too early: Trading the first price spike before the breakout candle closes.
-
Ignoring higher timeframes: Buying directly beneath a major daily resistance level.
-
Trading low volume: Treating weak participation as confirmation of strong momentum.
-
Chasing price: Entering after an extended move without a reasonable objective or nearby invalidation point.
-
Overtrading: Repeatedly entering after failed attempts or abandoning a daily loss limit.
Fast execution and tight spreads may improve order handling, but neither establishes a trading advantage.
Even experienced traders cannot reliably predict whether the next breakout will succeed.
Risk Management for Breakout and Rejection Trading
Risk management begins before entry.
Define a maximum acceptable loss per position, place the stop-loss beyond the relevant rejection zone and assess whether the available price range supports the intended take-profit.
A daily loss limit can also prevent repeated attempts to recover losses after unsuccessful trades.
The SEC's investor bulletin on stop orders explains that stop prices do not guarantee execution prices during fast markets.
Crypto volatility makes that limitation particularly relevant.
The CFTC's virtual currency trading advisory also warns that margin and leverage can amplify trading losses.
Traders should evaluate slippage, liquidity, position size and transaction costs before attempting to trade quickly around session openings.
Conclusion
Session breakout trading uses session highs and lows to identify potential continuation and reversal opportunities.
The strongest setups combine defined support and resistance, completed candle closes, volume confirmation and meaningful follow-through.
Rejections become useful when price fails to hold beyond a session boundary or successfully defends a broken level during a retest.
Neither pattern guarantees a favorable outcome. Waiting for confirmation, accepting missed trades and controlling losses matter more than predicting every breakout.
FAQ
What is the best session for crypto breakout trading?
London and New York sessions can provide active trading conditions and potential volatility expansion. However, the most suitable session depends on the cryptocurrency, liquidity, market conditions and the trader's strategy.
Why do fakeouts happen during session openings?
Session openings can change liquidity and trading participation. Price may briefly cross established highs or lows, trigger orders and reverse when directional demand fails to continue.
What confirms a successful session breakout?
A completed candle close beyond support or resistance, above-average volume, a successful retest and continued price movement provide stronger confirmation. None guarantees a true breakout.
Can session breakout trading work without indicators?
Yes. Traders can use session highs and lows, candlestick patterns, support and resistance zones, and price action. Volume and volatility indicators can provide additional evidence but are not mandatory.
Is session breakout trading suitable for beginners?
Beginners can study session breakout patterns using historical charts or simulated trades. Live trading requires understanding stop-loss execution, position sizing, false signals and volatility.
Does session breakout trading have a high win rate?
There is no universal win rate. Results depend on the asset, session definition, entry rules, transaction costs and market conditions. Historical testing does not guarantee future performance.
Disclaimer: Cryptocurrency trading involves market volatility, liquidity risks and potential capital losses. Technical patterns and historical performance do not guarantee future results.