For crypto traders using short time frames, this can improve entry and exit timing. The trade-off is greater sensitivity to market noise, which can produce more false signals.
Key Takeaways
-
Low-lag indicators respond to price movements faster than traditional lagging indicators by adjusting weighting, smoothing, or calculation methods.
-
EMA, Hull Moving Average (HMA), and Zero Lag Exponential Moving Average (ZLEMA) use different techniques to reduce signal delay.
-
Faster signals can improve timing during intraday trading but may produce false positives in sideways markets.
-
Combining low-lag indicators with volume, price action, and volatility measures can improve signal evaluation.
-
No technical indicator can eliminate lag completely or predict future price movements consistently.
What Are Low-Lag Indicators in Technical Analysis?
Low-lag indicators are technical analysis tools designed to reduce the time between a market price movement and the corresponding indicator response.
Traditional moving averages calculate values from historical data. They smooth short-term price fluctuations, helping traders identify trends, but often react after the underlying movement has begun.
A 50-period Simple Moving Average (SMA), for example, gives equal weight to the last 50 observations. A sudden price increase influences the average gradually because older prices still contribute equally.
Low-lag calculations place more value on recent observations or compensate for smoothing delays.
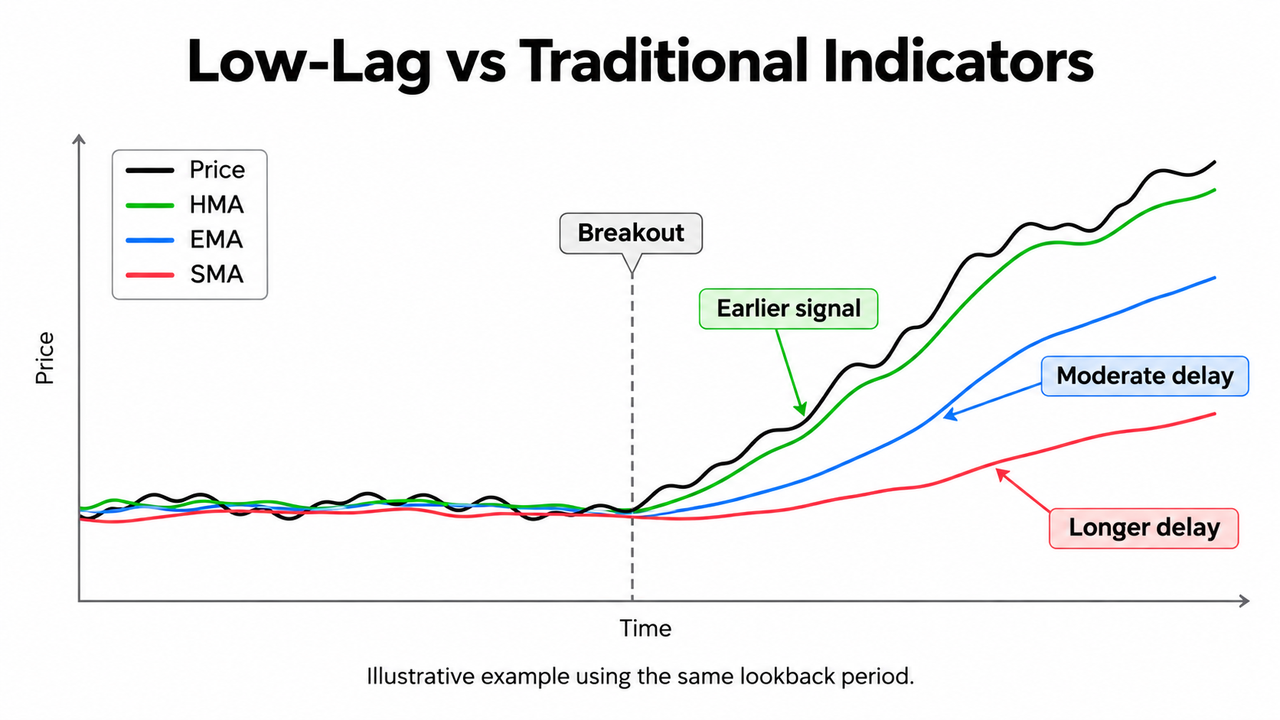
This difference matters in fast-moving markets. During a sharp Bitcoin breakout, an indicator that reacts several candles later may produce a buy signal after much of the initial move has occurred.
Still, low lag doesn't mean zero uncertainty. These indicators use past and current market data, not knowledge of future prices.
How Low-Lag Indicators Reduce Signal Delay
Low-lag indicators mainly improve responsiveness through weighted averaging, shorter calculation periods, and mathematical adjustments.
Weighted Moving Averages Prioritize Recent Price Data
A Weighted Moving Average (WMA) gives higher importance to newer observations.
An Exponential Moving Average (EMA) follows a similar principle, applying exponentially declining weights to older prices.
For a standard EMA, the smoothing multiplier is:
Multiplier = 2 / (Period + 1)
A 10-period EMA uses a multiplier of approximately 18.18%, allowing recent closing prices to influence the indicator more strongly.
This explains why an EMA often responds faster than an SMA with the same period.
The difference between WMA and EMA for scalping also depends on how each weighting method responds to sudden market changes.
Hull Moving Average Reduces Smoothing Delay
The Hull Moving Average combines weighted moving averages with different periods to reduce lag while maintaining a relatively smooth line.
Its calculation is:
HMA(n) = WMA(2 × WMA(n/2) − WMA(n), √n)
The shorter weighted average reacts quickly, while the subtraction compensates for part of the delay associated with longer smoothing periods.
The Hull Moving Average calculation was developed by Alan Hull to improve responsiveness without abandoning smoothing.
Although HMA aims to eliminate lag, it cannot guarantee an immediate or accurate response to every price movement.
The Hull Moving Average strategy commonly interprets changes in line direction alongside the prevailing trend.
Zero Lag Exponential Moving Average Compensates for Delay
The Zero Lag Exponential Moving Average (ZLEMA) adjusts its price input before applying exponential smoothing.
A common calculation uses:
Adjusted Price = Current Price + (Current Price − Price From Lag Periods Ago)
ZLEMA then calculates an EMA using this adjusted series.
The adjustment attempts to compensate for delayed responses, making the resulting line more responsive to recent price action.
Despite its name, ZLEMA remains dependent on historical observations. Sudden reversals can still create misleading signals.
Leading and Lagging Indicators: What's the Difference?
Leading indicators attempt to identify momentum changes before an established trend becomes obvious. Lagging indicators confirm price movements after they develop.
Low-lag indicators sit between these approaches. They reduce delay without necessarily becoming predictive.
| Indicator |
Main Function |
Response |
Main Limitation |
| SMA |
Trend confirmation |
Slower |
Delayed turning points |
| EMA |
Responsive trend tracking |
Faster than comparable SMA |
Sensitive to short-term fluctuations |
| HMA |
Reduced-lag trend tracking |
Generally fast |
False turns during consolidation |
| ZLEMA |
Lag-compensated smoothing |
Highly responsive |
Can exaggerate temporary movements |
| RSI |
Momentum measurement |
Depends on lookback |
Premature reversal signals |
The Relative Strength Index (RSI) measures recent gains against losses. Shortening its lookback period produces quicker readings but can increase false alarms.
Stochastic RSI is even more sensitive because it applies a stochastic calculation to RSI values. It isn't genuinely non-lagging.
Other momentum indicators, including True Strength Index (TSI) and Directional Movement Index (DMI), provide different perspectives on trend strength and direction.
The most useful combination depends on trading style, market conditions, and time frame.
How Traders Use Low-Lag Indicators in Intraday Trading
Consider a hypothetical trader monitoring the BTC/USDT spot market on Gate.com using a five-minute chart.
Bitcoin approaches resistance at $80,000.
A conventional moving average continues rising slowly, while a short-period HMA turns upward more quickly as price accelerates.
The trader can evaluate the setup through four observations:
-
Price action: Bitcoin closes above resistance rather than producing only a temporary spike.
-
Momentum: The HMA turns upward, suggesting improving short-term direction.
-
Volume: Trading activity increases, supporting the breakout.
-
Risk: A nearby structural level defines where the breakout idea becomes invalid.
The HMA provides an earlier indication, but the completed breakout and supporting volume help assess its reliability.
This is particularly relevant to session breakout trading, where sudden volatility can create sharp movements followed by equally rapid reversals.
A trader might also compare the HMA against a slower EMA. If both lines move upward, the setup has support from two different response speeds.
Neither condition guarantees that the strategy works.
Combining Low-Lag Indicators With Volume and Volatility
Faster signals become more useful when traders examine independent evidence.
Volume and order flow: Order flow imbalance helps identify aggressive buying or selling pressure. On-Balance Volume (OBV) accumulates volume according to closing-price direction, while Volume Profile maps trading activity across price levels.
VWAP: Volume Weighted Average Price provides an intraday price benchmark and may act as dynamic support or resistance. A low-lag bullish signal above VWAP can carry a different interpretation from the same signal below it.
ATR: Average True Range measures recent volatility. Traders can use ATR-based stop distances to accommodate changing market conditions instead of applying the same fixed stop across every session.
For example, a low-lag buy signal accompanied by increasing volume and an upward price breakout may warrant closer attention than a signal occurring during thin trading.
Combining trend, momentum, volume, and volatility indicators creates a more balanced decision-making process than stacking several highly responsive moving averages.
Why Low-Lag Indicators Can Produce False Signals
Reducing lag introduces a trade-off between speed and reliability.
A highly responsive indicator tracks short-term price movements closely. During sideways trading, small fluctuations can repeatedly change its direction.
These changes may produce false positives, premature sell signals, and unnecessary transactions.
A strategy that reacts to every crossover between two lines may struggle when the market lacks a sustained trend.
Traders can reduce some false signals by requiring candle-close confirmation, checking multiple timeframes, or comparing signals with dynamic support and resistance.
Each filter introduces its own delay.
Execution costs create another limitation. Spreads, slippage, and trading fees can offset the apparent timing advantage of a faster indicator.
Professional traders using automated strategies must also distinguish indicator lag from execution latency. High-frequency trading firms may use exchange colocation to reduce communication delays, but faster infrastructure doesn't eliminate poor signal quality.
How to Measure Whether Low-Lag Indicators Improve Performance
The most practical comparison uses identical historical periods, trading pairs, and entry rules.
Track these measurements:
| Metric |
What It Measures |
| Signal delay |
Candles between a defined price event and indicator signal |
| False-signal rate |
Signals that fail predefined confirmation criteria |
| Average entry distance |
Price movement between the reference event and entry |
| Trade expectancy |
Average outcome after wins, losses, and costs |
| Drawdown |
Decline from a previous equity peak |
Compare an HMA, EMA, and SMA over the same period rather than selecting only favorable market conditions.
A faster signal isn't automatically better if its false alarms increase trading costs.
The SEC's investor bulletin on performance claims also cautions that backtested performance is hypothetical and cannot establish future results.
Conclusion
Low-lag indicators reduce signal delay by emphasizing recent price movements or compensating for smoothing effects. EMA, HMA, and ZLEMA can help traders identify developing trends earlier than slower moving averages.
Their greatest value lies in improving responsiveness during active markets. The limitation is greater exposure to noise and false signals.
Combining faster indicators with price structure, volume, and volatility controls provides a more disciplined approach than relying on signal speed alone.
FAQ
What is the best low-lag indicator for crypto trading?
There is no universally best low-lag indicator. EMA is straightforward for trend tracking, HMA emphasizes responsiveness with smoothing, and ZLEMA attempts to compensate for delayed reactions. Performance depends on volatility, trading style, and timeframe.
Can low-lag indicators predict price movements?
No. Low-lag indicators react to current and historical market data. They may identify momentum changes earlier than slower indicators, but they cannot reliably predict future prices.
Are low-lag indicators suitable for day trading?
Yes, low-lag indicators can help day traders monitor rapid price changes and emerging trends. Short timeframes also generate more market noise, making volume confirmation and risk management important.
How do traders reduce false signals from low-lag indicators?
Traders can compare indicator signals with candle closes, support and resistance, volume, and higher-timeframe trends. These filters may reduce false positives, although additional confirmation can delay entries.
Is HMA faster than EMA?
HMA is designed to reduce lag through a combination of weighted moving averages and often responds faster than a comparable EMA. Actual behavior depends on the selected periods, calculation implementation, and market conditions.
Do low-lag indicators work in sideways markets?
They can generate frequent direction changes in sideways markets without identifying sustained trends. Traders may use broader trend filters or volatility measures to distinguish meaningful movements from short-term fluctuations.
Disclaimer: Technical indicators and historical performance cannot guarantee future results. Cryptocurrency trading involves market volatility, execution costs, liquidity risks, and potential financial losses. Conduct independent research and evaluate applicable trading restrictions before making decisions.