For intraday traders trying to identify market trends without reacting to every small price move, SuperTrend can provide a cleaner view of trend direction, possible entry and exit points, and trailing stop levels. The catch is that it’s a lagging indicator. It works best in trending markets and can generate false signals when price repeatedly moves back and forth in sideways market conditions.
Key Takeaways
-
SuperTrend combines ATR and a multiplier to create a volatility-adjusted indicator line above or below price.
-
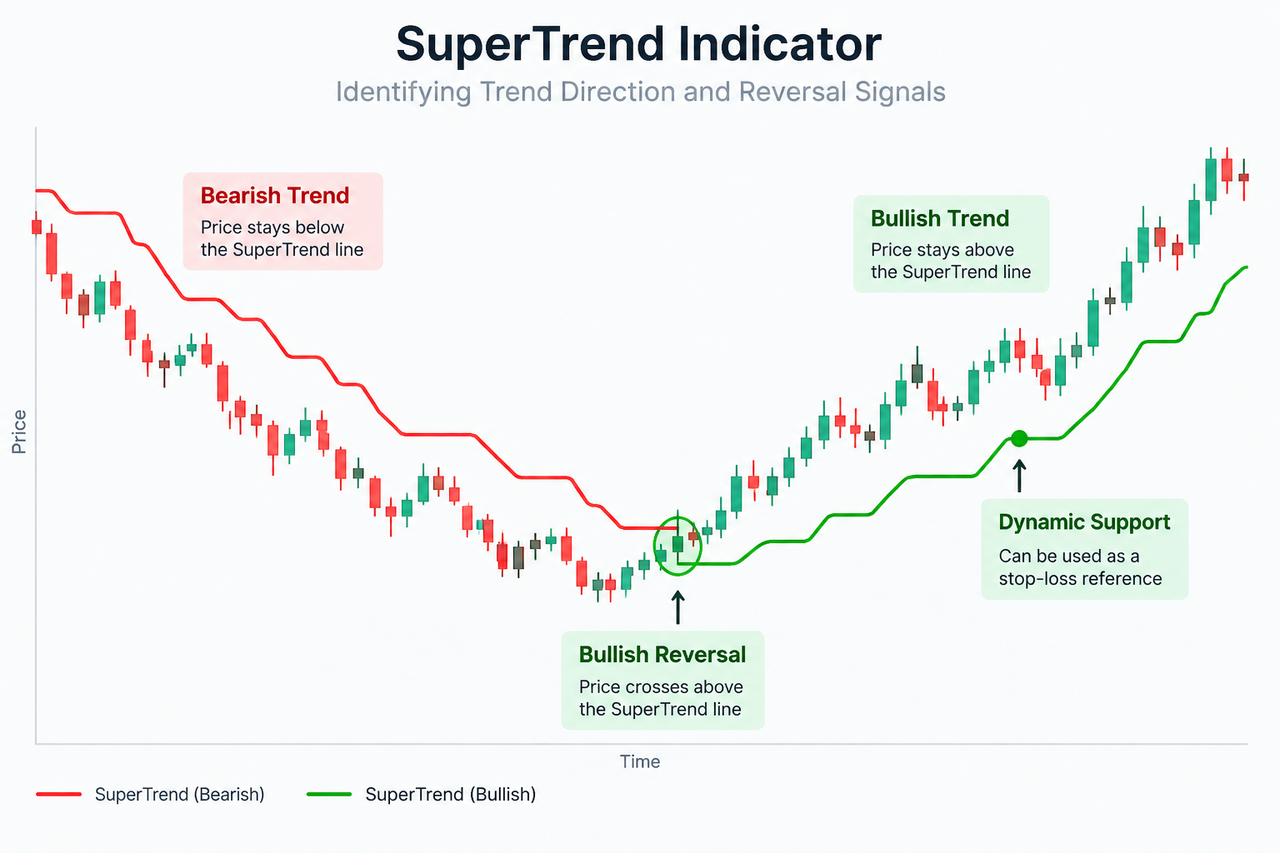
Price above the SuperTrend line generally signals an upward trend, while price below it indicates a downward trend.
-
The indicator can highlight potential trend reversals and act as dynamic support or resistance, including a reference for stop-loss placement.
-
Common default values are an ATR period of 10 and multiplier of 3, although sensitivity and signal frequency change with the settings.
-
SuperTrend works best when a market has directional momentum. RSI, moving averages, volume indicators or other technical analysis tools can help filter false signals.
What Is the SuperTrend Indicator?
SuperTrend is a technical analysis tool overlaid directly on a price chart. Rather than appearing in a separate oscillator window, its indicator line follows price and changes position when market direction changes.
The calculation combines market volatility with trend identification. According to TradingView’s SuperTrend calculation documentation, the indicator uses Average True Range and a multiplier to determine upper and lower bands, then selects the relevant band according to the current trend.
A typical interpretation is straightforward:
| Price Position |
Typical SuperTrend Reading |
| Price above the line |
Bullish trend / buy-side condition |
| Price below the line |
Bearish trend / sell-side condition |
| Price crosses above the red line |
Potential bullish reversal |
| Price crosses below the green line |
Potential bearish reversal |
Chart colors vary by platform, so traders should focus on the price's position relative to the line, not color alone.
SuperTrend belongs to the same broad family of trend-following tools as EMA 20, but their calculations are different. An exponential moving average gives more weight to recent prices, whereas SuperTrend changes its distance from price according to asset volatility.
How Does SuperTrend Work?
The SuperTrend indicator begins with the midpoint of each price bar:
Median price = (High + Low) ÷ 2
The basic bands are then calculated as:
Upper Band = Median Price + (Multiplier × ATR)
Lower Band = Median Price − (Multiplier × ATR)
These upper and lower bands move according to price volatility. If ATR rises because price movements become larger, the bands generally move farther away from price. When volatility contracts, the distance can narrow.
ATR itself is non-directional. TradingView’s Average True Range documentation defines True Range using the greatest of the current high-low range or the absolute differences between the current high or low and the previous closing price. The use of absolute value is important because ATR measures the magnitude of price volatility rather than whether price is rising or falling.
This volatility input is what separates SuperTrend from a simple moving average. The ATR indicator measures how much an asset is moving, while SuperTrend adds direction and turns that information into a trend-following line.
How SuperTrend Generates Buy and Sell Signals
A buy signal is commonly associated with price closing above the SuperTrend line and the indicator switching into its bullish state. On many charts, the indicator turns green and shifts beneath the price.
A sell signal occurs when the closing price moves below the indicator line, typically causing SuperTrend to move above price and turn red. TradingView similarly describes price above its curve as an uptrend and price below it as a downtrend.
Suppose BTC has been trading below SuperTrend during an intraday decline. Price then recovers, closes above the upper threshold and the indicator flips underneath price. That change suggests the previous bearish trend has been invalidated under the indicator’s rules.
It doesn’t mean price must continue higher. A trader might confirm the move using the RSI indicator, volume or broader price structure before treating the SuperTrend signal as an actionable setup.
For a live market example, a trader using Gate.com can compare SuperTrend signals against the BTC/USDT market chart on Gate.com, while remembering that indicator signals don't account for position size, leverage or execution risk.
SuperTrend Settings: ATR Period and Multiplier
Two settings control most SuperTrend behaviour: the ATR period and the multiplier.
A commonly used starting configuration is ATR 10 with a multiplier of 3. Some intraday traders also test settings such as 7/3, but default values aren't automatically the best settings for every asset or timeframe.
| Setting Change |
Typical Effect |
| Shorter ATR period |
Faster reaction, higher signal frequency, more market noise |
| Longer ATR period |
Smoother signals, fewer changes, more lag |
| Lower multiplier |
Line sits closer to price, increasing sensitivity |
| Higher multiplier |
Line sits farther from price, reducing signals but increasing lag |
Incorrect settings can make SuperTrend either too sensitive or too slow. A five-minute crypto chart, for example, may experience much more market noise than an hourly or daily chart.
That's why there is no universal “best technical indicator” setting. Sensitivity should reflect the asset volatility, timeframe and trading strategy rather than a constant value copied across every market.
Using SuperTrend for Intraday Trend Confirmation and Exits
SuperTrend is especially useful when traders want to remain aligned with the current market direction.
If price stays above a rising SuperTrend line, the indicator supports a bullish trend interpretation. Traders can compare that reading with a short-term EMA 9 to see whether more recent price data also points upward.
A declining SuperTrend positioned above price suggests a bearish trend. A trader could then avoid treating every brief upward candle as a reversal until price actually crosses the indicator or another part of the trading strategy changes.
The SuperTrend line can also act as dynamic support or resistance. During an upward trend, the line beneath price may serve as a volatility-adjusted reference for a stop-loss or trailing exit. In a downward trend, the line above price plays the opposite role.
This is similar in purpose, although not calculation, to Parabolic SAR. SuperTrend adjusts through ATR, whereas Parabolic SAR uses an acceleration factor that progressively moves its dots toward price. Their different mechanics can produce different exit signals.
How to Confirm SuperTrend Signals
SuperTrend shouldn’t be used as a standalone tool. Combining indicators only helps, however, when each one adds different information.
A practical combination might use SuperTrend for trend direction, RSI for momentum, and a volume indicator such as On-Balance Volume for participation.
Moving averages can also filter signals. If SuperTrend turns bullish while price is above a rising EMA, both tools are pointing in the same general direction. The SuperTrend vs. EMA relationship matters because SuperTrend adjusts directly to volatility while EMA responds primarily to the weighting of historical closing prices.
For trend strength rather than direction alone, ADX can help distinguish a stronger directional environment from a weak one.
None of these combinations eliminate false signals. They simply require more than one type of evidence before a trading decision is made.
Why SuperTrend Generates False Signals
The main weakness of SuperTrend appears in sideways markets.
Imagine price moving inside a narrow intraday range. A small rally crosses above the SuperTrend line and produces a bullish signal. Price then falls back through it several candles later, triggering a bearish signal. Repeated price crosses can create several buy and sell signals without a meaningful trend ever developing.
Low-volume market conditions can make this problem worse because relatively small orders may produce temporary price moves that lack sustained participation.
Lag creates another tradeoff. SuperTrend waits for price action to cross a volatility-adjusted boundary, so the reversal signal arrives after part of the price move has already occurred. Increasing the multiplier may avoid false signals caused by minor fluctuations, but the wider band also delays the next reversal signal.
That balance between noise and lag is unavoidable in trend-following indicators.
SuperTrend vs Other Trend Indicators
SuperTrend is most useful for trend confirmation and volatility-adjusted exits, rather than trying to identify every precise turning point.
The Ichimoku Cloud provides a broader structure involving trend, momentum and possible support or resistance zones. The Moving Average Ribbon examines the alignment of several moving averages, while Linear Regression estimates the statistical direction of a price trend.
SuperTrend is simpler visually. One line summarizes trend direction while automatically adjusting its distance from price as volatility changes.
Conclusion
The SuperTrend indicator uses ATR and a multiplier to create a volatility-adjusted trend line that can help traders identify market trends, potential trend reversals and possible exit points. Price above the line generally represents a bullish trend, while price below it indicates a bearish trend.
Its strongest use is in directional markets where the SuperTrend line can confirm price direction and provide a dynamic reference for managing risk. Sideways markets are much harder. Repeated crosses can generate false trading signals, and wider settings that reduce noise also increase lag.
SuperTrend is therefore better treated as one part of a trading framework. Price action, moving averages, momentum and volume indicators can provide confirmation that the line alone cannot.
FAQ
What are the default settings for the SuperTrend indicator?
ATR 10 with a multiplier of 3 is a commonly used SuperTrend configuration. These values are starting points rather than universal settings, since different assets and timeframes have different levels of price volatility.
Does SuperTrend give buy and sell signals?
Yes. A buy signal is generally associated with price crossing and closing above the indicator line, while a sell signal is associated with price moving below it. These signals can fail, particularly during sideways or range-bound markets.
Can SuperTrend be used as a stop-loss?
The SuperTrend line can serve as a dynamic reference for stop-loss placement because its distance from price adjusts with ATR. Traders still need separate rules for position sizing, maximum loss and execution because the indicator cannot guarantee the stop price during rapid market movements.
Is SuperTrend good for intraday trading?
SuperTrend can be useful for intraday trading when price develops a clear trend. Shorter settings can increase sensitivity and signal frequency, but they also make the indicator more exposed to market noise and false reversals.
Is SuperTrend a leading or lagging indicator?
SuperTrend is a lagging, trend-following indicator because it is calculated from historical price data and ATR. It confirms a change only after price crosses its calculated boundary, so signals can occur after a reversal has already started.
Can SuperTrend eliminate false signals?
No. No SuperTrend configuration can eliminate false signals. Combining it with market structure, RSI, moving averages, ADX or volume confirmation may help filter weaker setups, but historical indicator signals do not guarantee future trading results.
Disclaimer: This content is for educational purposes only and does not constitute financial or investment advice. Technical indicators are based on historical market data and can produce false or delayed signals. Digital assets are volatile, and traders should independently assess market conditions, execution risk, leverage and position size.







