For traders trying to separate a genuine directional move from short-term price noise, that can provide a clearer view of recent price action. The slope can identify trend direction, while linear regression channels show how far price has moved from its fitted trend. The catch is that the calculation describes historical relationships. It doesn’t guarantee where an asset’s price goes next, particularly when market conditions change abruptly.
Key Takeaways
-
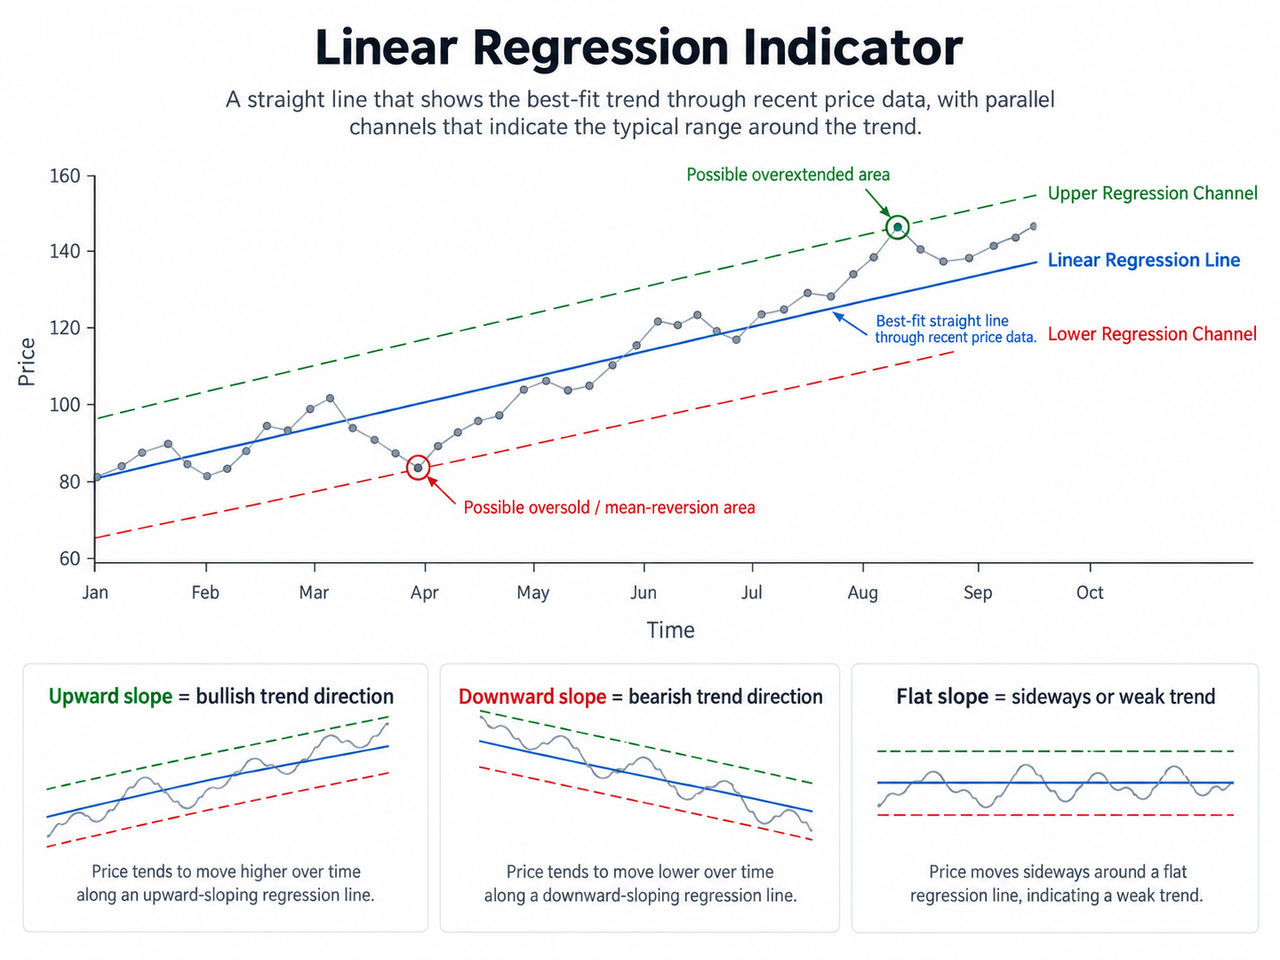
A linear regression line is the statistically best-fitting straight line through a specified period of price data.
-
Its slope indicates the direction and rate of price change: positive is upward, negative is downward, and a near-flat slope suggests consolidation.
-
Regression channels add parallel upper and lower bands, often based on standard deviations from the central regression line.
-
Traders can combine Linear Regression with a moving average, momentum oscillators, volume tools, and price structure for confirmation.
-
Sudden market shifts, outliers, sideways markets, and non-linear price behavior can produce false signals or weaken the model.
What Is the Linear Regression Indicator?
A Linear Regression Indicator applies regression analysis to a price series, usually closing prices, over a specified period. In its simplest trading form, time acts as the independent variable and price as the dependent variable.
The calculation asks a straightforward question: Which straight line best represents these data points?
That makes the indicator different from a manually drawn trend line. Two traders can connect different highs or lows and produce different manual lines. Linear regression uses a defined mathematical method, so the same data and settings produce the same result.
The underlying method is linear least squares regression, which estimates the line that minimizes squared differences between observed values and fitted values. The U.S. National Institute of Standards and Technology describes linear least squares as one of the most widely used regression methods and notes both its efficiency and its sensitivity to outliers.
In technical and quantitative analysis, the result is used less as a formal statistical forecast and more as an objective representation of recent trend direction.
How a Linear Regression Line Identifies Trends
A simple linear regression can be expressed as:
Price = a + b × Time
Here, a is the intercept and b is the slope. The slope is especially useful for market analysis because it measures how quickly the fitted price has been changing over the chosen period.
Suppose a trader applies a 20-period linear regression line. The calculation takes the last 20 closing prices, assigns each observation a position in time, and finds the best-fit line through those values using the least-squares method.
Interpretation is fairly intuitive:
| Regression Line |
Typical Interpretation |
| Rising slope |
Bullish trend direction |
| Falling slope |
Bearish trend direction |
| Near-flat slope |
Sideways or consolidating market |
| Increasing slope magnitude |
Trend is becoming statistically steeper |
| Decreasing slope magnitude |
Directional conviction may be weakening |
A steeper positive slope reflects faster upward price movement; a steeper negative slope reflects faster downward movement. Traders can also watch slope changes to judge whether momentum behind the trend is strengthening or fading.
This differs from a Zig Zag indicator, which filters smaller movements to emphasize significant swing highs and lows. Linear regression instead tries to estimate the statistical direction running through all selected data points.
Linear Regression Channels and Price Deviations
Linear regression channels place parallel bands above and below the central regression line. A common construction uses one or more standard deviations of price around the fitted line.
The middle regression line represents the estimated trend. The upper and lower boundaries show how unusually far price has moved away from that trend.
If price approaches the upper channel, it may be relatively extended above its recent statistical path. A move toward the lower channel indicates the opposite. These areas are sometimes described as potential overbought or oversold conditions, but those labels need context. Strong trends can keep price near an outer band for long periods.
Extreme deviations can also create potential mean-reversion setups. Yet a decisive breakout beyond a regression channel may signal something quite different: acceleration of the existing trend or a change in market behavior.
That is why the channel shouldn't automatically be treated as resistance at the top and support at the bottom. Traders evaluating specific horizontal levels can separately use Pivot Points or Fibonacci retracement levels.
Regression channels also differ from volatility envelopes such as Keltner Channels. Keltner Channels generally build their boundaries around a moving average using Average True Range, whereas regression channels are oriented around a fitted statistical trend.
Linear Regression vs. a Moving Average
Both Linear Regression and a moving average reduce the visual impact of short-term fluctuations, but they answer different questions.
A moving average calculates the average price over a rolling window. The regression line estimates the direction that best fits the relationship between price and time during that window.
That distinction matters after a sharp move. A moving average can continue lagging because earlier observations remain part of its average. Linear regression deliberately fits a slope to all observations in the window, so it can make the direction and rate of movement easier to quantify.
Neither approach is inherently superior. A trader might use Linear Regression to identify the statistical trend and an EMA to check whether recent price action supports it.
Using Linear Regression Under Different Market Conditions
Linear Regression tends to be easiest to interpret when price has a reasonably persistent directional relationship with time. In a smooth uptrend, for example, an upward regression line with price largely contained inside its channel can reinforce the trend interpretation.
Sideways markets are harder. The regression line may repeatedly move from slightly positive to slightly negative without identifying a meaningful trend.
Confirmation helps. A trader might combine the regression slope with RSI, using the momentum oscillator to judge whether price momentum supports the statistical direction. Volume can provide another check: On-Balance Volume tracks cumulative volume according to whether price closes higher or lower.
For example, an upward regression slope, strengthening RSI and rising OBV provide different types of evidence rather than three versions of the same signal.
Multiple timeframes matter too. An upward regression on a 15-minute chart can exist inside a downward daily trend. Comparing short- and higher-timeframe slopes gives broader market context before identifying potential entry or exit points.
For a live example, a trader can inspect the BTC/USDT market on Gate.com and compare different regression periods against actual price movements rather than relying on a static historical chart.
Common Pitfalls of Linear Regression Analysis
Linear regression assumes that the relationship being modeled is adequately represented by a linear form. Financial markets frequently violate that assumption. Prices can accelerate, reverse suddenly, gap, or follow more complex relationships that a straight line cannot capture effectively.
Outliers are another problem. One unusually large price spike or crash can pull the regression line toward itself and distort the slope.
Formal regression analysis also relies on assumptions about its residuals. Classical models generally expect errors to behave independently, with approximately constant variance, and statistical inference may depend on distributional assumptions. NIST discusses residual normality and constant variance as part of standard regression-model diagnostics.
Trading charts don't necessarily satisfy those assumptions. Volatility changes over time, returns can contain extreme observations, and new data may abruptly make the previous relationship irrelevant.
A regression model fitted through a calm 20-period advance, for instance, cannot anticipate an unexpected market shock simply because the previous fit looked strong.
Period selection introduces another tradeoff. Short settings react faster but are more sensitive to noise. Longer periods produce a smoother view of price trends but may respond slowly to turning points. Backtesting different settings across multiple market conditions is more useful than assuming that one period will work for every asset or trading system.
How Traders Can Use Linear Regression More Systematically
The strongest use of Linear Regression is as part of a systematic approach rather than a standalone prediction tool.
Start with the slope to determine the general direction. Check whether price remains inside the regression channel or is making an unusual deviation. Then test the observation against price structure, volume and momentum.
For instance, a downside break from a rising regression channel carries different information if RSI is also weakening and volume confirms selling pressure. Volume Oscillator versus OBV illustrates why volume momentum and cumulative volume can confirm price movements in different ways.
Price action still matters. Statistical lines describe relationships within past data; they don't replace support and resistance, swing structure, volatility analysis or risk controls.
Conclusion
The Linear Regression Indicator turns recent price data into an objective best-fit line, helping traders identify trend direction and quantify how quickly price has been moving. Its regression channels add context by showing how far current prices have deviated from that statistical path.
Its main advantage is consistency: the line comes from data rather than a manually chosen trend line. Its main weakness comes from the same source. A model fitted to historical data can become unreliable when market behavior changes, outliers distort the calculation, or price follows a non-linear path.
Used alongside multiple timeframes, momentum oscillators, volume confirmation and price structure, Linear Regression can provide valuable insight into market direction. It remains a measurement tool, not a guarantee of trading success.
FAQ
Is Linear Regression a technical indicator?
Yes. A Linear Regression Indicator applies a statistical regression method to historical market prices and displays the resulting trend as a line or channel. Traders primarily use it to assess trend direction, slope and deviations from the fitted price path.
What does the slope of a regression line mean in trading?
The slope indicates the rate and direction of price change over the selected period. A positive slope points upward, a negative slope points downward, and a near-zero slope suggests a ranging or weakly directional market.
What is a 20-period Linear Regression Indicator?
A 20-period Linear Regression Indicator calculates the best-fit regression relationship using the latest 20 data points, usually closing prices. As each new period arrives, the oldest observation drops out and the regression is recalculated.
Can regression channels identify overbought and oversold conditions?
They can show when price is unusually far above or below its fitted trend, which traders may interpret as relative overextension. Touching an outer channel isn't automatically a reversal signal because strong trends can remain extended.
Is Linear Regression better than a moving average?
Neither is universally better. A moving average describes the rolling average price, while Linear Regression estimates the statistical direction and slope of the price series. Using both can help traders compare trend direction with a more traditional smoothing tool.
Disclaimer: Technical indicators are based on historical market data and do not guarantee future price movements. Examples are educational rather than personalized financial advice. Traders should consider volatility, liquidity, market conditions and their own risk management before making trading decisions.







