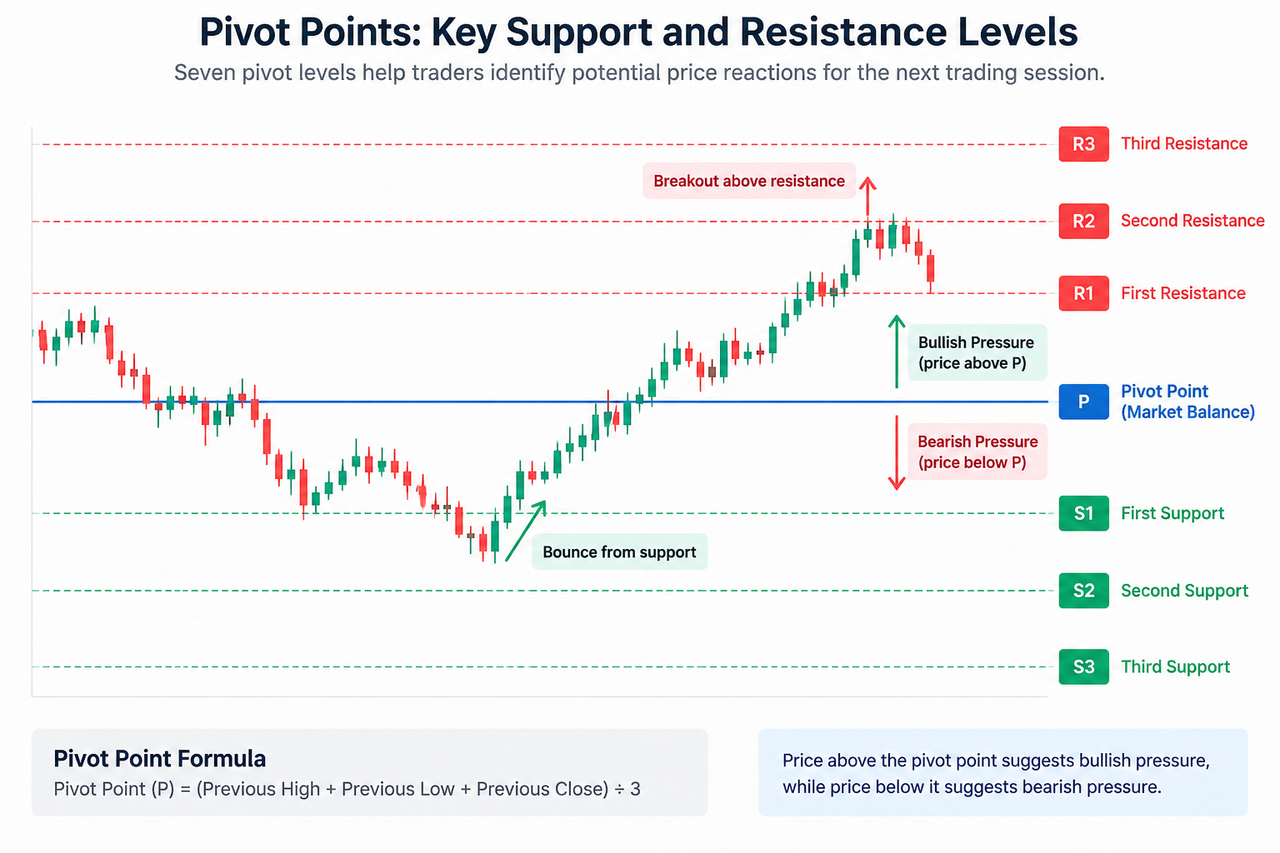
For day traders and futures traders, that creates a practical price map. Instead of deciding subjectively where a price bounce or reversal might occur, they can see predefined levels before the next trading day develops. Price trading above the base pivot point is commonly interpreted as bullish pressure, while price below it suggests bearish sentiment.
The catch is that Pivot Points don't predict future price movements with certainty. They depend on historical data, and sharp volatility, market gaps, or strong trends can push price straight through several pivot levels. They work better as reference points for price action, entries, exits, profit targets, and risk management than as standalone trading signals.
Key Takeaways
-
A Pivot Point is calculated from a prior period's high, low, and close to establish objective support and resistance levels for the next period.
-
Standard Pivot Points commonly create seven pivot levels: the central pivot, three support levels, and three resistance levels.
-
Price above the central pivot generally suggests bullish pressure; price below it generally points to bearish pressure.
-
Standard, Fibonacci, Woodie's, Camarilla, and Demark Pivot Points use different calculations and can produce different key levels.
-
Pivot Points work best when price reactions at the levels are confirmed with price action, moving averages, momentum, or volume indicators rather than treated as guaranteed reversal points.
What Are Pivot Points and How Do They Identify Support and Resistance Levels?
A pivot point is a technical analysis reference price derived from the previous period's trading range. Traditional floor traders used these calculations to establish likely intraday support and resistance before electronic charting made the levels easy to plot automatically.
Unlike traditional support and resistance drawn from visible swing highs, swing lows, or resistance zones, Pivot Points are mathematical. Two traders using the same prior-period data and the same pivot calculation should generally get the same levels.
That objectivity is their main appeal.
Support levels mark areas where buying pressure may become strong enough to slow a decline or produce a price bounce. Resistance levels mark areas where selling pressure may slow an advance. Neither is an impenetrable barrier. Gate Learn's explanation of support and resistance also shows why these areas are better viewed as reference zones than prices that must hold.
Pivot Points simply calculate those references in advance.
Because the levels are available before price reaches them, Pivot Points are sometimes described as leading indicators. That label needs qualification: the levels themselves are forward reference points, but their calculations still depend entirely on past data.
How to Calculate Pivot Points
Standard Pivot Points are the most basic and widely recognized version. The main pivot point formula is:
Pivot Point (P) = (High + Low + Close) / 3
Here, High, Low, and Close refer to the previous period.
Once the base pivot point is known, the first two support and resistance levels can be calculated as:
First Resistance (R1) = (2 × P) − Low
First Support (S1) = (2 × P) − High
Second Resistance (R2) = P + (High − Low)
Second Support (S2) = P − (High − Low)
Standard calculations can extend to a third resistance level and third support level, producing seven levels in total: S3, S2, S1, P, R1, R2, and R3.
A Real Example
Suppose the previous day's high was $105, the low was $95, and the close was $100.
The central pivot becomes:
P = ($105 + $95 + $100) / 3 = $100
The first levels are:
-
R1 = $105
-
S1 = $95
-
R2 = $110
-
S2 = $90
Before the next trading session begins, the trader already has several price levels to monitor.
If price opens at $102 and remains above the $100 middle line, sentiment may initially be interpreted as bullish. A move toward $105 then places price near first resistance. If price breaks that level convincingly, $110 becomes another reference for a potential target or resistance point.
A rejection near $105, however, may send price back toward the central pivot. These are scenarios, not forecasts.
How Traders Interpret Daily Pivot Points
Daily Pivot Points use the previous day's high, low, and close to calculate levels for the current trading day. That makes them particularly useful to day traders looking for intraday support, resistance, and potential price reactions.
The central pivot represents an approximate balance point between bullish and bearish forces.
A common interpretation looks like this:
| Price Behavior |
Common Interpretation |
| Price holds above P |
Bullish intraday bias |
| Price stays below P |
Bearish intraday bias |
| Price approaches S1 or S2 |
Potential support or downside target |
| Price approaches R1 or R2 |
Potential resistance or upside target |
| Price breaks a pivot level |
Watch for continuation or false breakout |
| Price repeatedly rejects a level |
Possible support/resistance zone |
Price breaks deserve particular caution. A candle moving briefly above first resistance doesn't prove that resistance has failed. Price can cross a pivot level and quickly reverse, creating the same type of false breakout seen around manually drawn support and resistance zones.
Traders therefore often examine the close prices of candles around the level rather than reacting to the first touch.
Multiple Pivot Levels and Multiple Timeframes
Pivot calculations aren't restricted to daily charts. Traders can calculate daily, weekly, or monthly Pivot Points depending on the timeframe they want to analyze.
A day trader might use daily pivots for the immediate trading session while also watching weekly pivot levels. If a daily resistance point and a weekly resistance level align near the same price, that area may receive more attention because two independently calculated reference levels converge.
The same logic applies when multiple support levels align with an existing swing low, moving average, or psychologically significant price level.
This is called confluence. It doesn't guarantee that the level will hold, but it gives the price zone more analytical context than a single isolated indicator signal.
Standard, Fibonacci, Woodie's, Camarilla, and Demark Pivot Points
Not every Pivot Point trading strategy uses the standard calculation.
| Pivot Type |
Main Characteristic |
Typical Use |
| Standard Pivot Points |
Uses previous high, low, and close |
General intraday support and resistance |
| Fibonacci Pivot Points |
Applies Fibonacci ratios to the prior trading range |
Layered retracement-style levels |
| Woodie's Pivot Points |
Gives greater weight to the closing price |
Traders emphasizing the latest close |
| Camarilla Pivot Points |
Creates four support and four resistance levels |
Short-term mean-reversion and breakout analysis |
| Demark Pivot Points |
Changes calculation according to the relationship between open and close |
Conditional price-bias analysis |
Fibonacci Pivot Points
Fibonacci Pivot Points begin with a base pivot and then apply ratios such as 38.2%, 61.8%, and 100% to the previous trading range.
They're related conceptually to Fibonacci retracement but aren't identical. A Fibonacci retracement is normally drawn between a selected high and low in a price move. Gate Learn's discussion of Fibonacci tools in cryptocurrency trading shows how retracement ratios can identify possible support and resistance during pullbacks.
Demark Pivot Points
Demark Pivot Points take a different route. Their calculation changes depending on whether the previous period closed above, below, or at its opening price.
As a result, open and close prices affect the calculation more directly than they do in standard pivots.
Combining Pivot Points With Other Indicators
Combining Pivot Points with other indicators can help traders judge whether a mathematically calculated level is also supported by the current market structure.
Moving averages are a straightforward example. A Pivot Point may mark S1 at the same place where a widely watched moving average sits. The EMA 20 reacts more strongly to recent prices, while an SMA weights each observation equally. If price, a pivot support point, and a moving average converge, traders may watch the resulting zone more closely.
Moving averages themselves can behave as dynamic support or resistance, although those levels change as new price data arrives.
Volume can add a different kind of confirmation. A breakout through resistance accompanied by stronger volume may carry more information than a brief price break during thin trading. OBV tracks cumulative volume according to whether price closes higher or lower, while the Volume Oscillator compares short- and longer-term volume trends.
Momentum is useful for another reason. If price reaches a resistance point while the RSI is already showing unusually strong momentum or overbought conditions, the trader has more context for judging the reaction. An overbought reading still doesn't guarantee a price reversal.
Pivot Point Trading Strategy: Entries, Targets, and Risk Management
A basic Pivot Point trading strategy usually falls into one of two categories: trading a bounce or trading a breakout.
In a range-style setup, price may approach S1 and then show rejection through repeated closes above the level. A trader treating S1 as intraday support could use the central pivot as one possible reference for a profit target.
A breakout setup looks different. Suppose price moves through R1 and holds above it rather than immediately falling back. R2 may become the next resistance or target zone.
For a live example, a trader can open the BTC/USDT chart on Gate.com, record the previous day's high, low, and close, calculate the daily pivot levels, and then compare actual price reactions with those predefined levels. The purpose isn't to assume BTC must reverse at R1 or S1, but to see whether price action confirms or rejects the calculated structure.
Risk management remains necessary because price can pass through multiple pivot levels rapidly. Stops based solely on the exact support point can also be vulnerable to ordinary volatility, so some traders treat pivots as zones and incorporate surrounding price structure rather than assuming the same levels will produce identical reactions.
Key Levels, Price Magnets, and Mist Pivots
Some specialized intraday pivot systems use the term Mist Pivot for a pivot level that remained untouched during its original period.
The idea is that an untouched level may later act as a price magnet. This isn't part of the standard seven-level Pivot Point formula, and it shouldn't be treated as a universal rule. It belongs to particular Pivot Point methodologies rather than classic floor-trader calculations.
That distinction matters because traders struggle when concepts from different pivot systems are treated as though they share the same calculation and evidence base.
Limitations of Pivot Points
Pivot Points are simple, objective, and usually pre-calculated by charting platforms, but those advantages don't eliminate their weaknesses.
They rely on past data. The previous period's high, low prices, and close cannot account for unexpected information arriving during the next period.
Volatility can overwhelm the levels. During sharp market moves, price may cut through first resistance, second resistance, and even the third resistance level without producing a meaningful reversal.
False breakouts happen. Price may move above resistance or below support briefly before returning to the prior trading range.
Trending markets can reduce mean-reversion usefulness. Pivot Points often appear especially intuitive in range-bound conditions because price oscillates between nearby support and resistance. A strong directional market may pay little attention to those levels.
Different calculations produce different answers. Standard, Fibonacci, Woodie's, Camarilla, and Demark Pivot Points don't necessarily identify the same support and resistance levels.
This is why pivot point signals are generally stronger as part of a broader technical framework than as isolated buy or sell instructions.
Conclusion
Pivot Points turn the previous period's high, low, and close into predefined support and resistance levels that traders can use to structure the next session. Standard Pivot Points create a central balance level surrounded by multiple support and resistance points, giving traders an objective framework for tracking price direction, potential reversals, breakouts, profit targets, and risk.
Their strongest practical feature is preparation: the key levels are known before price reaches them. Their main weakness comes from the same mechanism. Because pivot calculations use historical prices, they can't know whether new information, volatility, or strong market sentiment will cause price to respect a level or break straight through it.
For that reason, Pivot Points work best alongside price action and other indicators such as moving averages, momentum measures, or volume indicators. They identify where traders may want to pay attention. They don't determine what price must do next.
FAQ
What are the seven Pivot Point levels?
Standard Pivot Points commonly consist of seven levels: the central Pivot Point (P), three resistance levels (R1, R2, R3), and three support levels (S1, S2, S3). They are calculated from the previous period's high, low, and close.
Are Pivot Points support and resistance levels?
Yes. Pivot Points are mathematical reference levels used to estimate possible support and resistance for a future trading period. Unlike manually drawn support and resistance, they follow predefined formulas.
Are Pivot Points good for day traders?
Pivot Points are particularly suited to intraday planning because daily levels can be calculated before a new session begins. Day traders commonly use them to organize potential entries, exits, breakout levels, and profit targets, but they still require confirmation and risk management.
Do Pivot Points work in crypto markets?
They can be applied to cryptocurrencies because the calculation requires only high, low, and close prices. Crypto trades continuously, however, so the definition of a "daily" session depends on the chart or platform's candle boundaries.
What happens when price breaks a Pivot Point?
A break above resistance may indicate increasing buying pressure, while a break below support may indicate increasing selling pressure. Traders generally watch whether price can remain beyond the level because temporary breaks can become whipsaws or false breakouts.
Are Pivot Points better than moving averages?
They answer different questions. Pivot Points establish fixed price levels from the previous period, while moving averages change continuously as new prices enter the calculation. Combining the two can reveal areas where fixed and dynamic support or resistance levels align.
Disclaimer: This content is for educational purposes only and does not constitute financial or investment advice. Technical indicators are based on historical market data and cannot guarantee future price movements or trading results.







