That distinction matters to traders deciding whether a price move has lasting participation behind it or whether trading activity is simply accelerating right now. The Volume Oscillator compares short- and long-term volume moving averages. On-Balance Volume, or OBV, builds a cumulative volume line according to price direction. Used together with price action, they can provide stronger context than either indicator used alone.
Key Takeaways
-
OBV is generally stronger for longer-term trend confirmation. Rising OBV alongside rising price suggests that positive-volume periods continue to support the trend.
-
The Volume Oscillator is more responsive to short-term volume momentum. A move above zero shows that recent trading volume has risen above its longer-term average.
-
Volume Oscillator signals can be useful around breakouts. Expanding volume as price breaks resistance may provide stronger confirmation than a breakout occurring on low volume.
-
OBV is especially useful for divergence. Bullish or bearish divergence between the OBV line and price can warn that an existing price trend is losing volume support.
-
Neither indicator should be treated as a standalone trading signal. Choppy markets, isolated volume spikes, unusual liquidity conditions, and sudden price movements can all generate false signals.
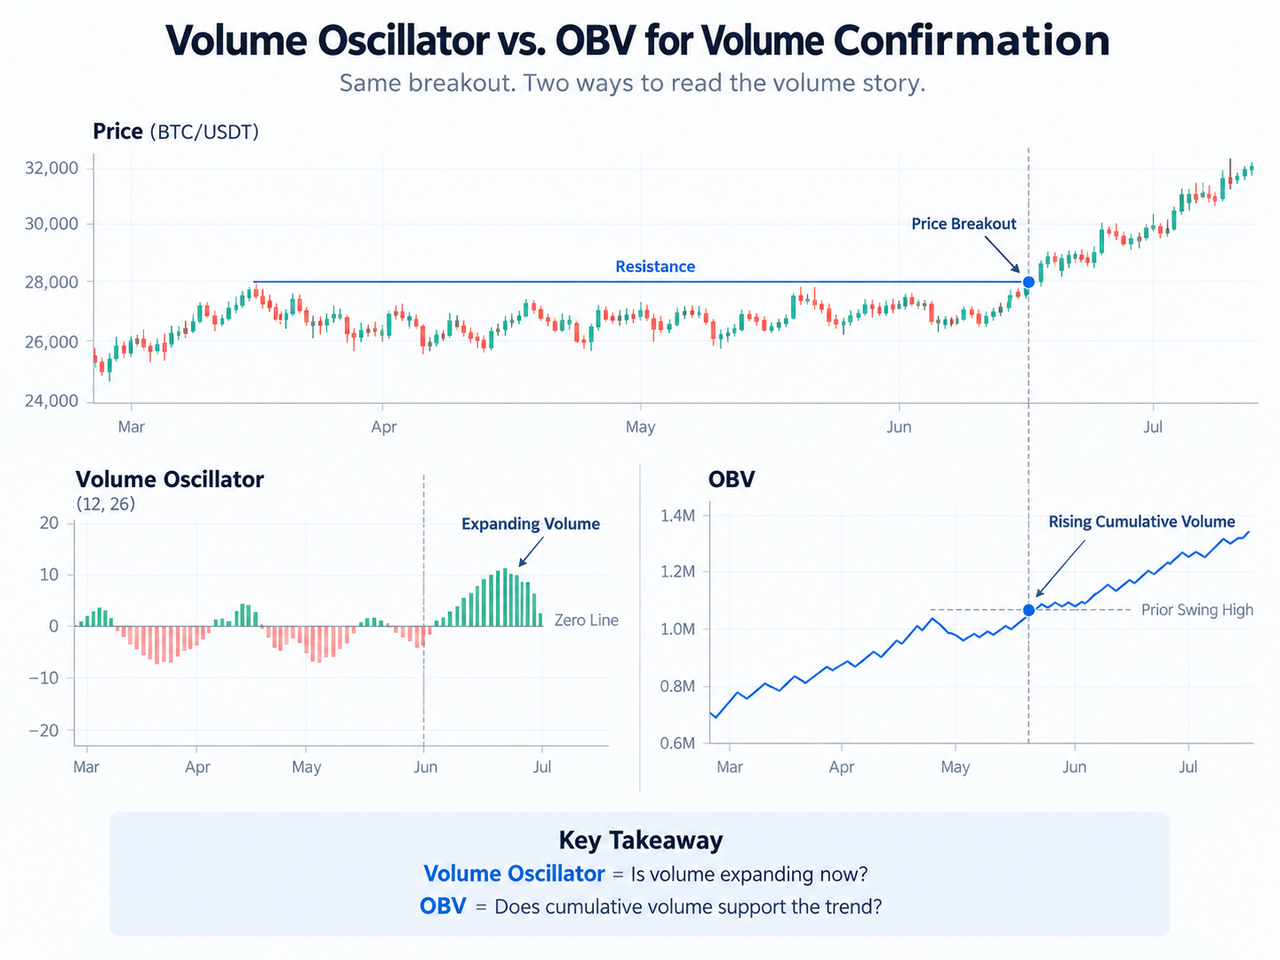
Volume Oscillator vs. OBV: The Main Difference
The simplest comparison is that OBV tracks direction, while the Volume Oscillator tracks acceleration in volume activity.
The Volume Oscillator asks whether short-term volume is greater or smaller than its longer-term baseline. OBV asks whether cumulative volume has predominantly accompanied periods when price closed higher or lower.
| Feature |
Volume Oscillator |
On-Balance Volume (OBV) |
| Main purpose |
Measure volume momentum |
Track cumulative directional volume |
| Calculation |
Short volume MA versus long volume MA |
Adds or subtracts each period's volume |
| Main reference |
Zero line |
Direction and slope of OBV line |
| Best use |
Short-term momentum, breakout validation |
Trend confirmation, divergence |
| Price input |
Usually none directly |
Closing-price direction |
| Volume input |
Moving averages of volume |
Full volume for each period |
| Leading characteristic |
Reacts quickly to volume expansion |
Divergence may precede price change |
| Main weakness |
Noise and repeated crosses |
Cumulative structure can react less clearly to rapid shifts |
| Absolute value |
Relative reading is useful |
Absolute OBV value is generally unimportant |
The indicators can therefore disagree without either being wrong. A Volume Oscillator may rise sharply because recent trading volume has surged, while OBV remains in a broader downtrend because cumulative selling pressure still dominates.
This is also why volume indicators shouldn't be treated as interchangeable. For example, the Money Flow Index combines price and trading volume into a bounded momentum indicator, while Chaikin Money Flow weights volume according to where price closes within each period's range.
How the Volume Oscillator Measures Expanding Volume
The Volume Oscillator measures the difference between a short-term moving average of trading volume and a longer-term moving average.
One common percentage form is:
Volume Oscillator = [(Short-Term Volume MA − Long-Term Volume MA) / Long-Term Volume MA] × 100
Some implementations display the raw difference instead, so traders should check the calculation used by their charting platform. The underlying idea remains the same: compare recent volume with a slower volume baseline.
When the indicator rises above zero, the short-term average is greater than the long-term average. Trading activity is expanding relative to its recent history. When it moves below zero, short-term volume has fallen below the longer-term average.
The important limitation is direction. A positive Volume Oscillator doesn't automatically mean buying pressure.
Suppose a financial asset breaks sharply below support while trading volume surges. The Volume Oscillator may move strongly positive because participation is expanding, even though the price movement is bearish. Price direction must therefore be read separately.
That makes the indicator particularly useful for breakout validation. If price breaks resistance while the Volume Oscillator rises decisively, the breakout is occurring alongside strong volume expansion. Fidelity similarly describes increasing volume as strengthening the technical significance of support or resistance breaks.
The Volume Oscillator is consequently better understood as a volume momentum indicator, not a standalone bullish-or-bearish signal.
How On-Balance Volume and the OBV Indicator Work
On-Balance Volume takes a different approach. Developed by Joseph Granville and described in his 1963 book Granville's New Key to Stock Market Profits, OBV maintains a running total of volume based on whether the closing price rose or fell from the previous period.
The basic calculation is:
If closing price rises: OBV = Previous OBV + Current Volume
If closing price falls: OBV = Previous OBV − Current Volume
If closing price is unchanged: OBV = Previous OBV
Because it is cumulative volume, the absolute value of OBV isn't usually the useful part. Traders focus on the direction of the OBV line, its highs and lows, trendline breaks, and whether it confirms the price chart.
A rising OBV means more volume has accumulated on positive-closing periods than negative-closing periods over the observed sequence. If price rises at the same time, the OBV trend confirmation suggests that trading activity broadly supports the existing price trend.
Likewise, falling price alongside falling OBV supports a bearish interpretation.
The OBV indicator shouldn't be interpreted as a literal measure of how much “smart money” is buying. OBV can't identify who traded, and a high reading doesn't prove institutional buying. It is a directional transformation of reported trading volume.
Why OBV Trend Confirmation Is Usually Better for Existing Trends
For sustained trend confirmation, OBV generally has the edge.
Imagine price has been rising for several weeks. A single volume surge can push the Volume Oscillator higher, but that tells the trader mainly that recent participation has increased. Rising OBV across the same period gives a broader view: positive-closing periods are continuing to accumulate more volume than negative-closing periods.
That persistence is useful when judging existing price trends.
OBV can also be compared with support, resistance, and trendlines in much the same way as price. An OBV trendline break may appear before the equivalent price structure gives way, although such a move is a warning rather than proof that a price reversal will follow.
Other cumulative indicators use different logic. The Accumulation/Distribution indicator, for instance, considers where the closing price occurs within the period's high-low range before accumulating volume. OBV assigns the entire period's volume according only to whether the closing price rose or fell.
That simplicity makes OBV easy to interpret, but it also means one very small positive price change can add the same period volume as a much larger positive price change.
Bullish Divergence and Bearish Divergence With Balance Volume OBV
Divergence is one of OBV's most useful applications.
A bullish divergence develops when price is weakening or making lower lows while OBV begins rising or forms higher lows. It suggests that volume flow is becoming more positive even though price has not yet confirmed the change.
A bearish divergence occurs when price rises or records higher highs while OBV weakens or makes lower highs. Here, higher prices are no longer receiving the same cumulative volume confirmation.
These signals fit Granville's broader idea that changes in volume may precede changes in price. They don't mean OBV can reliably predict future price movements on every occasion. Divergence can persist for a long time, disappear, or produce a false signal before price changes direction.
A trader looking at OBV versus the Money Flow Index will also notice an important difference: MFI incorporates volume into a bounded price-momentum calculation, whereas OBV remains an unbounded cumulative line.
When the Volume Oscillator Is Better for Breakouts
The Volume Oscillator becomes particularly useful when the question changes from “Is this trend supported?” to “Is participation expanding right now?”
Consider price approaching a well-established resistance level.
Scenario A: Price breaks resistance, but the Volume Oscillator remains below zero. Recent trading volume is still weaker than its longer-term average. The price breakout may succeed, but volume confirmation is limited.
Scenario B: Price breaks resistance while the Volume Oscillator moves sharply positive. Short-term volume has expanded above its baseline, showing much stronger participation in the move.
This doesn't automatically confirm bullish momentum because a volume surge only measures activity. Price action supplies the direction. But when price direction, expanding volume, and market structure agree, the signal has more context.
A trader applying this to a live market could use the BTC/USDT market on Gate.com to compare a resistance break with current trading volume rather than judging the breakout from price alone.
The same logic applies to breakdowns. Rising volume as price breaks support can strengthen bearish confirmation.
Why the Volume Oscillator Can Produce False Signals
Fast response comes with a cost.
Because short-term volume moving averages react rapidly to volume spikes, news, liquidations, unusual order flow, or temporary bursts in market activity, the Volume Oscillator can move sharply even when no sustainable trend develops.
Choppy markets are particularly difficult. Short-term volume may repeatedly cross above and below its longer-term average, causing repeated zero-line crosses while price remains range-bound.
Parameter choice matters too. A very short fast average reacts sooner but can produce more noise. Longer moving averages create smoother signals but respond later.
This tradeoff is similar to many tools in technical analysis: responsiveness and stability pull in opposite directions. Comparing the signal with Ease of Movement can add another perspective because EMV focuses on how efficiently price moves relative to volume rather than simply asking whether volume is expanding.
OBV Can Also Give False Signals
OBV isn't immune to noise.
Because the full period's volume is classified according to a simple close-to-close price change, an unusually large volume spike can have a lasting effect on the cumulative line. A tiny positive price change during very high volume adds all that volume to OBV.
Fast markets create another problem. Since OBV accumulates data over time, its broader trend can remain intact even while short-term volume conditions change abruptly. In that situation, the Volume Oscillator may identify the change in market momentum earlier.
OBV divergence also requires context. A bearish divergence doesn't guarantee a trend reversal, just as rising OBV doesn't guarantee that price rises next.
The Ease of Movement vs. OBV comparison illustrates why different volume tools can reach different conclusions: each defines the relationship between price change and volume differently.
Using Volume Oscillator and OBV Together
The strongest approach isn't necessarily choosing one indicator.
Volume Oscillator and OBV can complement each other because one measures short-term volume expansion while the other tracks cumulative directional volume.
Suppose price breaks resistance.
First, check the Volume Oscillator. A strong move above zero indicates that short-term trading volume has expanded relative to the longer-term baseline.
Then examine OBV. If OBV is rising and also breaks above a previous high or resistance area, cumulative volume flow is moving in the same direction as price.
Finally, compare both signals with price structure. A breakout that has strong volume expansion, rising OBV, and a convincing price close above resistance has more supporting evidence than a signal based on any single indicator.
The reverse applies to bearish moves.
This doesn't eliminate false signals. It simply asks two different volume questions before interpreting the price breakout. Traders can broaden the check further with Chaikin Money Flow vs. Money Flow Index, where CMF emphasizes sustained accumulation or distribution and MFI emphasizes volume-weighted price momentum.
Volume Oscillator vs. OBV: Which Should You Choose?
Choose according to the job.
Use the Volume Oscillator when:
-
short-term volume momentum matters;
-
price is approaching support or resistance;
-
you want to see whether a breakout has expanding volume;
-
sudden changes in market participation matter more than the long-term volume trend.
Use OBV when:
-
confirming an existing price trend;
-
comparing cumulative buying and selling pressure over time;
-
looking for bullish divergence or bearish divergence;
-
analyzing OBV trendline breaks;
-
judging whether price and volume flow remain aligned.
For example, someone analyzing the ETH/USDT market on Gate.com could use the Volume Oscillator to check whether volume surges during a breakout, then use OBV to determine whether the broader volume trend also supports the price direction.
Neither replaces price action, support and resistance, volatility analysis, or risk management. Historical indicator behavior also doesn't guarantee future market movements.
Conclusion
For Volume Oscillator vs. OBV, OBV is generally the stronger choice for sustained volume confirmation and divergence analysis, while the Volume Oscillator is better for identifying short-term changes in volume momentum and validating whether participation is expanding around a breakout.
The difference comes from their construction. The Volume Oscillator compares volume moving averages; OBV accumulates positive or negative volume according to closing-price direction.
Using both can therefore be more informative than trying to declare one universally superior. The Volume Oscillator can show that activity is accelerating now, while OBV can show whether that burst fits the broader volume flow. Price action still has the final say.
FAQ
Is the Volume Oscillator better than OBV?
Not universally. The Volume Oscillator is generally better for short-term volume momentum and breakout validation, while OBV is better suited to cumulative trend confirmation and price-volume divergence.
Is OBV a leading or lagging indicator?
OBV is often used as a potentially leading volume indicator because divergence or changes in its direction may occur before price confirms a move. However, its cumulative nature can also make the line slow to reflect some abrupt market changes, so it shouldn't be treated as a reliable predictor of future prices.
What does a positive Volume Oscillator mean?
A positive reading normally means the short-term moving average of trading volume is above the longer-term moving average. It indicates expanding recent participation, not necessarily buying pressure; price action determines whether that volume expansion accompanies a bullish or bearish move.
What does rising OBV mean?
Rising OBV means cumulative volume is increasing because more volume is being added on periods with higher closing prices than is being subtracted on periods with lower closes. When price is also rising, this commonly supports bullish trend confirmation.
Can Volume Oscillator and OBV be used together?
Yes. The Volume Oscillator can show whether short-term volume is expanding, while OBV can reveal whether cumulative volume flow supports the price trend. Agreement between both indicators and price action can provide broader confirmation, though it doesn't eliminate false signals.
Which other volume indicators can complement OBV?
Money Flow Index, Chaikin Money Flow, Accumulation/Distribution, Ease of Movement, and Negative Volume Index examine different aspects of price and volume. The Negative Volume Index, for example, focuses specifically on price behavior during periods when trading volume declines.
Disclaimer
This content is for educational purposes only and does not constitute financial or investment advice. Technical indicators can produce false signals, and historical price or volume patterns do not guarantee future performance. Traders should consider broader market context and manage risk appropriately.







