A weighted moving average strategy uses recent price data to identify market trends, confirm entry points, and manage exits in crypto trading. Unlike a simple moving average, the WMA gives greater importance to recent prices. For day traders and swing traders, that helps track changing market direction, although rapid price fluctuations can still produce false signals.
Key Takeaways
-
A weighted moving average (WMA) prioritizes recent closing prices, making it more responsive than a simple moving average.
-
Traders commonly use 9, 20, and 50-period WMAs depending on their timeframe and trading style.
-
Bullish and bearish WMA crossovers indicate possible trend changes but need confirmation from price action.
-
Volume, RSI, and support and resistance levels can help filter weak trading signals.
-
Stop-loss placement, position sizing, and backtesting remain essential because WMA signals cannot predict future price movements.
What Is a Weighted Moving Average in Technical Analysis?
A weighted moving average (WMA) is a moving average indicator that calculates the average price over a selected time period while assigning more weight to recent data points.
Traditional moving averages smooth price fluctuations to make the underlying trend easier to identify. The difference comes from how each data point contributes to the calculation.
A simple moving average (SMA) treats data points equally. A weighted moving average WMA assigns progressively higher weights to the most recent prices, reducing lag compared with an SMA of the same length.
The WMA formula is:
WMA = Σ (Closing Price × Weight Factor) ÷ Σ Weight Factors
Calculating WMA involves multiplying each closing price by its assigned weight factor, adding those results, and dividing by the total weights.
Consider five hypothetical closing prices:
| losing Price ($) |
Weight |
| 100 |
1 |
| 102 |
2 |
| 104 |
3 |
| 106 |
4 |
| 110 |
5 |
The WMA equals $106, while the SMA equals $104.40.
The difference shows how recent price changes influence the weighted average more strongly.
TradingView's moving average documentation explains how these indicators smooth historical price data. They remain lagging indicators, not predictive analytics tools.
Choosing WMA Settings for Cryptocurrency Trading
Standard WMA lengths depend on trading style, chart timeframe, and market volatility. There isn't one setting that works across every cryptocurrency market.
| Trading Style |
Common WMA Lengths |
Primary Use |
| Scalping |
9 or 20 periods |
Identifying short-term price changes |
| Day trading |
20 or 50 periods |
Tracking intraday trend direction |
| Swing trading |
20 or 50 periods |
Confirming multi-session trends |
| Longer-term analysis |
50 or 200 periods |
Assessing broader market direction |
Scalpers may prefer a 9-period WMA because it reacts quickly to recent price changes. The tradeoff? More sensitivity to market noise.
Day traders frequently use 20-period and 50-period averages to separate short-term fluctuations from sustained trends. Swing traders can use a 50-period WMA to assess broader directional shifts, although its meaning depends on whether the chart uses hourly, four-hour, or daily candles.
A 50-period WMA on a four-hour chart represents 200 hours of price data. On a daily chart, it covers 50 trading days.
That difference matters when selecting moving average settings for different timeframes.
How to Use a Weighted Moving Average Strategy for Crypto Trading
A practical WMA trading strategy combines trend direction, crossover confirmation, price structure, and predetermined risk controls.
Step 1: Identify the Market Trend
Start by applying a 20-period WMA and 50-period WMA to the price chart.
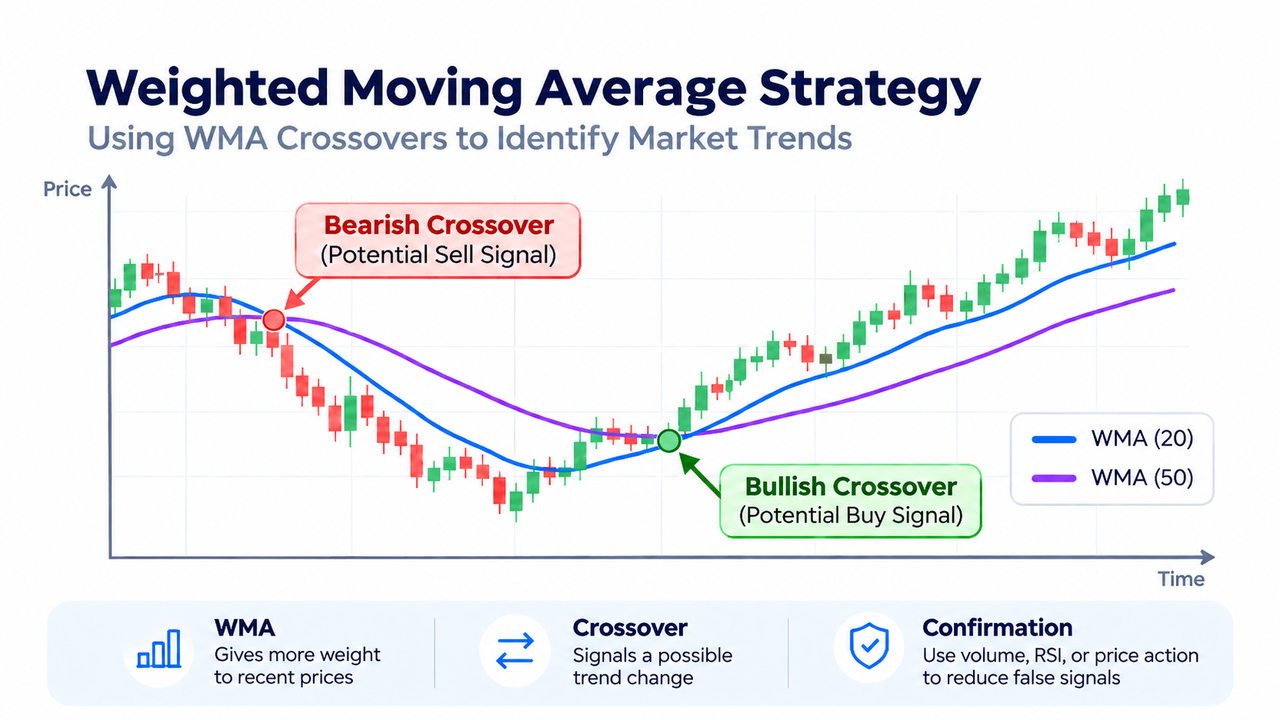
A rising 20-WMA above a rising 50-WMA generally indicates bullish short-term momentum. A falling 20-WMA below a falling 50-WMA suggests a bearish trend.
The slope matters as much as the crossover. Two nearly horizontal averages often indicate sideways markets where direction remains uncertain.
A multiple-timeframe trading approach helps determine whether the shorter chart agrees with the dominant trend.
For example, a bullish signal on the 15-minute chart may carry less weight when the four-hour trend remains strongly bearish.
Step 2: Identify Bullish and Bearish WMA Crossovers
Moving average crossovers generate potential buy and sell signals when fast and slow averages exchange positions.
Bullish WMA crossover: The fast WMA crosses above the slow WMA, suggesting strengthening upward momentum.
Bearish WMA crossover: The fast WMA crosses below the slow WMA, indicating weakening momentum or increasing selling pressure.
The traditional golden cross occurs when the 50-day moving average crosses above the 200-day moving average. It is a broader bullish trend signal, not the same as a short-term 9/20 WMA crossover.
But a crossover alone isn't enough. During sideways markets, repeated crossings can produce several losing trades without establishing a meaningful trend.
Step 3: Confirm Signals With Technical Indicators
WMA crossovers become more useful when other technical indicators support the same market direction.
An RSI reading above 50 may support bullish momentum, while stronger trading volume suggests greater market participation.
Price closing above a previously established resistance level adds another layer of confirmation.
A volume and ATR strategy can assess whether a breakout is supported by participation and expanding volatility.
Traders can also confirm trend strength using price, volume, and momentum rather than depending entirely on moving average crossovers.
Step 4: Plan Entry and Exit Points
Consider a hypothetical BTC/USDT setup:
-
The 20-period WMA crosses above the 50-period WMA.
-
Bitcoin closes above nearby resistance at $70,000.
-
Trading volume increases during the breakout.
-
A pullback holds above the previous resistance level.
A potential long entry might be considered after the successful retest, subject to acceptable risk.
On the BTC/USDT spot market at Gate.com, traders can inspect live price action and volume while checking whether their charting interface supports the required WMA settings.
For a long trade, a stop-loss can sit below the recent swing low, allowing some room for ordinary price fluctuations.
Suppose entry occurs at $70,200 with a stop-loss at $69,700. The initial risk is $500 per BTC.
A hypothetical take-profit target at $71,200 provides $1,000 of potential upside, producing a 1:2 risk-to-reward ratio before trading costs.
That ratio is a planning benchmark, not a guarantee or universal minimum. Fees, slippage, and execution conditions can change the actual result.
Step 5: Manage Exits and Trend Reversals
A WMA moving against an existing position can signal weakening momentum, but exiting on every minor crossover may produce unnecessary trading.
Some traders wait for a candle close below the fast WMA, a bearish crossover, or a break of established support.
The use of indicators to time trade exits becomes more useful when exit rules are defined before entering.
Moving averages can also act as dynamic support and resistance levels in trending markets. Their apparent influence is conditional, however; price can cross them repeatedly without reacting.
Weighted Moving Average vs Simple and Exponential Moving Average
All three moving averages help identify trends, but their calculations create different responses to market changes.
| Indicator |
Weighting Method |
Main Characteristic |
| SMA |
Equal weight to every included price |
Smoother, generally slower response |
| WMA |
Linearly increasing weight toward recent prices |
Greater emphasis on recent movements |
| EMA |
Exponentially declining weight on older prices |
Responsive, with older data retaining influence |
An exponential moving average (EMA) also prioritizes recent data. Unlike a conventional finite-period WMA, its calculation retains a diminishing influence from earlier observations.
Neither WMA nor EMA is universally faster or more accurate. Their relative behavior depends on settings and the price sequence.
That distinction becomes relevant when comparing WMA and EMA for crypto scalping.
WMA Strategy Risks During Crypto Market Volatility
The biggest weakness of a weighted moving average strategy is its sensitivity to rapid price changes.
A sudden candle can move the WMA sharply before the market returns to its previous range. These false signals become particularly common in volatile markets with inconsistent liquidity.
Another limitation is delayed confirmation. Even responsive moving averages calculate historical prices, so an emerging trend reversal may already be underway before the signal appears.
Risk controls should account for:
-
Whipsaws: Repeated crossovers during sideways markets.
-
Slippage: Stop orders executing away from expected prices during rapid moves.
-
Overfitting: WMA parameters performing well historically but failing under different market conditions.
-
Trading costs: Frequent entries reducing net profitability.
The CFTC's virtual currency risk advisory identifies volatility and market-related losses as significant concerns.
Backtesting several WMA combinations across trending and sideways periods can help assess consistency. Include transaction costs and out-of-sample data. The SEC's investor bulletin on performance claims also cautions that hypothetical backtested results cannot establish future profitability.
Conclusion
A weighted moving average strategy helps traders identify trend direction, potential entry points, and exit conditions by giving recent prices greater influence.
Its strongest practical use is trend confirmation alongside price action, volume, and risk management. During sideways or unpredictable crypto market conditions, however, that same responsiveness can generate misleading signals.
The WMA works best as one component of a trading process, not as a standalone buy-or-sell instruction.
Frequently Asked Questions
What Is the Best WMA Setting for Crypto Trading?
There is no universally best WMA setting. Scalpers commonly test 9 or 20 periods, day traders often consider 20 or 50, and swing traders may use 50-period averages for broader trends. Settings should be evaluated against the trading timeframe and historical performance.
Is WMA Better Than EMA for Cryptocurrency Trading?
Neither indicator is consistently superior. Both prioritize recent prices, but their weighting formulas differ. WMA uses linear weights across a fixed window, while EMA applies exponentially declining weights to historical observations.
Can a Weighted Moving Average Predict Trend Reversals?
No. A WMA measures historical price behavior and cannot predict future price movements. Crossovers and slope changes may indicate a developing reversal, but confirmation from market structure and momentum remains necessary.
How Do You Add WMA to TradingView?
Open a cryptocurrency chart on TradingView, select Indicators, search for Weighted Moving Average, and add it to the chart. Adjust the length, price source, and visual settings according to the strategy being examined.
Can WMA Be Used for Long-Term Crypto Trading?
Yes. Longer WMA lengths, including 50 or 200 periods on daily charts, can help assess broader trends. However, longer averages react more slowly and may identify trend changes only after substantial price movement has occurred.
Why Does a WMA Strategy Generate False Signals?
False signals commonly occur when price moves sideways or reverses quickly after a crossover. Because WMA emphasizes recent data, short-term volatility can influence the indicator without producing a sustained trend.
Disclaimer: Cryptocurrency trading involves volatility, liquidity risk, and potential losses. Technical indicators and historical performance do not guarantee future results. Product availability and trading restrictions may vary by jurisdiction.