For day traders and swing traders, combining these signals with a predefined exit strategy can protect gains and limit risk exposure. The challenge is distinguishing a temporary pullback from a genuine reversal before exiting too early or too late.
Key Takeaways
-
Entry and exit indicators identify potential trading opportunities, but exit signals need confirmation from price action.
-
RSI, MACD and the Stochastic Oscillator can reveal weakening momentum before a trend reverses.
-
Moving averages, Bollinger Bands and Parabolic SAR help identify price-based exit points.
-
Average True Range (ATR) supports volatility-adjusted stop-loss and trailing-stop placement.
-
Effective exit strategies combine indicator signals, support and resistance, risk-reward ratios and predefined risk limits.
What Are Entry and Exit Indicators?
Entry and exit indicators are technical analysis tools that help traders identify potential entry points and determine when to close positions.
An entry signal might appear when price rebounds from support, where historical buying pressure has emerged. Resistance levels, where selling pressure previously increased, may provide potential entry points for short trades.
Exit indicators focus on different questions: Is momentum weakening? Has the trend changed? Is price approaching resistance or a predefined profit target?
Common categories include:
| Indicator Type |
Examples |
Primary Exit Use |
| Momentum |
RSI, MACD, Stochastic |
Identify fading momentum |
| Trend |
EMA, SMA, Parabolic SAR |
Detect trend changes |
| Volatility |
ATR, Bollinger Bands |
Set dynamic exits |
| Price structure |
Support, resistance |
Locate exit levels |
| Volume |
OBV, trading volume |
Confirm selling pressure |
The best exit indicators depend on trading style and market conditions. No single indicator consistently identifies the highest price before a reversal.
How to Use Exit Indicators to Read Price Movements
Relative Strength Index: Identifying Potential Exit Points
The Relative Strength Index (RSI) is a momentum indicator measuring recent price gains against losses on a scale from 0 to 100.
Readings above 70 traditionally indicate overbought conditions, while readings below 30 suggest oversold conditions.
For a long position, traders may watch for:
-
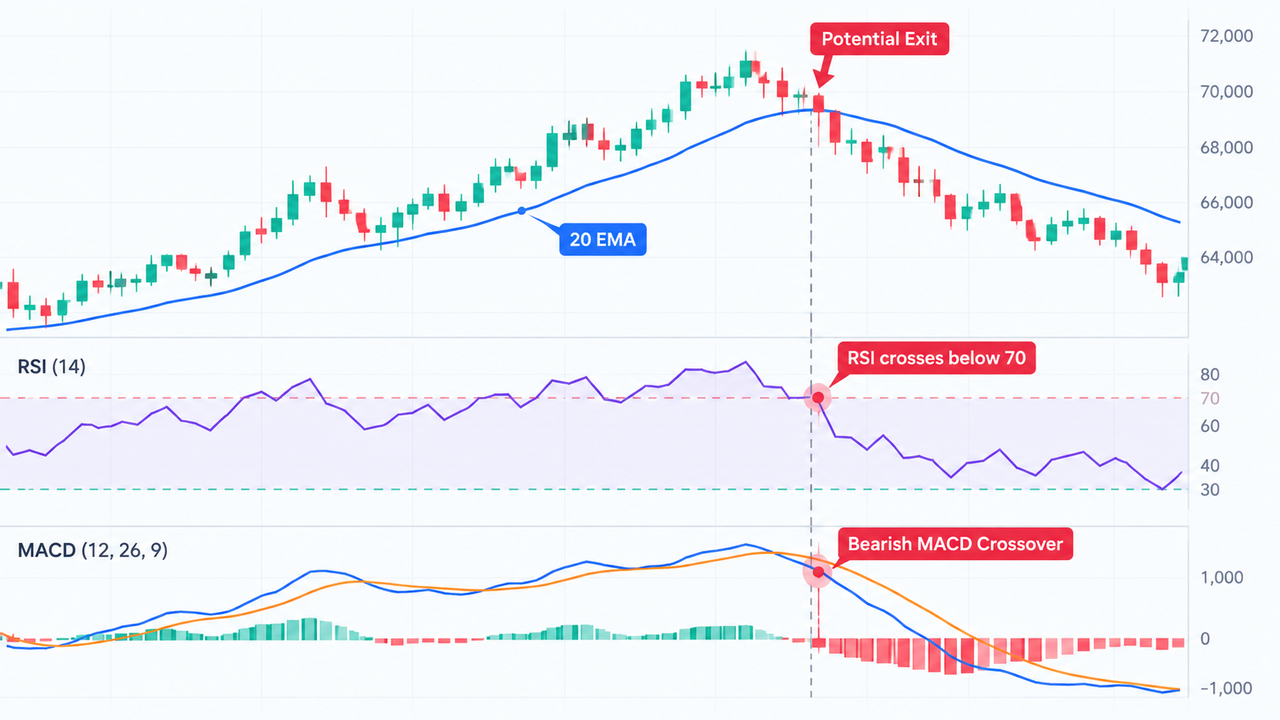
RSI rising above 70 and subsequently falling below it.
-
Bearish divergence, where price makes a higher high but RSI makes a lower high.
-
RSI crossing below 50 alongside weakening price structure.
These signals help identify potential reversals, but an overbought reading alone doesn't mean price must decline. Strong trends can keep RSI elevated.
The RSI settings used for day trading and swing trading also affect signal speed and sensitivity.
Moving Average Convergence Divergence: Reading Exit Signals
Moving Average Convergence Divergence (MACD) tracks the relationship between two exponential moving averages, commonly the 12-period and 26-period EMAs.
The MACD line is compared with a signal line, commonly its nine-period EMA.
For potential long-position exits:
-
A bearish crossover occurs when the MACD line falls below the signal line.
-
Shrinking positive histogram bars indicate weakening upward momentum.
-
A MACD move below zero suggests bearish momentum has become dominant over the measured periods.
A bearish crossover can occur before price clearly reverses, but repeated crossovers during sideways trading generate false signals.
Combining RSI and MACD signals can help traders compare momentum changes rather than relying on either indicator independently.
Stochastic Oscillator: Detecting Momentum Reversals
The Stochastic Oscillator compares a recent closing price with its high-low trading range, producing two lines commonly called %K and %D.
Readings above 80 suggest overbought conditions; readings below 20 suggest oversold conditions.
A potential exit signal appears when the faster %K line crosses below %D in an elevated zone.
However, stochastic crosses may occur repeatedly during sustained trends. Price closing below nearby support provides stronger confirmation than an oscillator crossover alone.
Using Moving Averages and Price Action for an Exit Strategy
A Simple Moving Average (SMA) calculates an equally weighted average price. An Exponential Moving Average (EMA) gives more weight to recent prices, generally responding faster to price fluctuations.
Traders often monitor the 9, 20 and 50-period moving averages.
For example, if a long position remains above a rising 20 EMA, the trend may still be intact. A price close below that average, followed by a failed recovery, can indicate weakening trend strength.
A moving average crossover provides another exit signal, although its delayed response can sacrifice some gains.
Price action matters equally. A break below the latest higher low may reveal a structural reversal before slower indicators respond.
The Parabolic SAR indicator provides another trend-following approach. When its dots flip from below price to above price, traders may interpret the change as a potential long-position exit.
Bollinger Bands and ATR: Exit Indicators for Market Volatility
Bollinger Bands typically use a 20-period simple moving average with upper and lower bands positioned two standard deviations away.
Price touching the lower band can indicate a potential mean-reversion entry, while price touching the upper band may suggest profit-taking opportunities.
Yet upper-band contact during a strong uptrend can indicate sustained momentum rather than an immediate reversal.
ATR measures market volatility using price ranges, including gaps. Unlike directional indicators, it doesn't predict whether price will rise or fall.
Traders can use Average True Range to adjust exit distances as volatility changes.
For example, suppose:
An illustrative trailing-stop level would be $104, based on the current reference price. A properly configured trailing stop can subsequently move upward as favorable prices establish new highs.
A wider stop may tolerate ordinary volatility but increases the distance exposed to adverse price movements.
How Day Traders Can Combine Entry and Exit Indicators
Consider a hypothetical trader holding BTC/USDT after a breakout.
On the BTC/USDT spot market at Gate.com, the trader can examine price movements, trading volume and available chart indicators.
A structured exit process might look like this:
-
Identify the entry: Price breaks resistance and retests the level as support.
-
Set risk boundaries: Establish a stop loss below structural support and a target using a predefined risk-reward ratio.
-
Monitor momentum: RSI crosses below 70 while positive MACD histogram bars shrink.
-
Confirm weakness: Price closes below the 20 EMA and selling volume increases.
-
Execute the planned exit: Reduce or close the position according to predefined rules rather than waiting for another indicator.
A 1:2 risk-reward target, for instance, means the planned potential gain is twice the initial risk before costs. It doesn't imply a two-thirds or any other probability of success.
Volume spikes can strengthen a bearish interpretation, especially when accompanied by broken support.
Common Mistakes When Timing Exit Points
Exiting on one indicator: RSI overbought readings, Bollinger Band touches and MACD crossovers can appear while a trend remains strong.
Ignoring market volatility: Tight stops are particularly vulnerable to ordinary intraday price fluctuations.
Using identical settings everywhere: A five-minute forex pair chart and a daily cryptocurrency chart involve different volatility, speed and market behavior.
Changing exit rules after entry: Moving a stop loss farther away to avoid realizing a loss increases risk beyond the original trading plan.
The SEC's explanation of trailing and stop orders also highlights that a stop price isn't a guaranteed execution price.
For forex trading, the CFTC warns about leveraged currency transactions, where rapid price movements can magnify financial losses.
Conclusion
The most useful entry and exit indicators combine momentum oscillators, trend-following signals and volatility measurements.
RSI and MACD help identify weakening momentum, moving averages and price action confirm structural changes, and ATR supports dynamic risk management.
A reliable trading process defines exit conditions before entering the position. Technical indicators can improve decision consistency, but they cannot predict reversals with certainty or replace disciplined risk management.
Frequently Asked Questions
Which indicators are best for timing trade exits?
RSI, MACD, moving averages, ATR and Parabolic SAR are commonly used exit indicators. Momentum oscillators can identify early weakness, while trend indicators help confirm whether price direction has changed.
RSI above 70 indicates strong recent upward momentum and traditionally suggests overbought conditions. It isn't an automatic sell signal because RSI can remain elevated during sustained uptrends.
Is MACD better than RSI for exit signals?
Neither is universally better. MACD emphasizes momentum changes between moving averages, while RSI measures the strength of recent gains and losses on a bounded scale.
How do traders use ATR for trailing stops?
Traders can set trailing-stop distances as a multiple of ATR. For example, two ATR units below a favorable reference price creates a volatility-adjusted threshold, although the appropriate multiple depends on trading conditions.
Should day traders use multiple exit indicators?
Combining two or three complementary tools can reduce dependence on individual false signals. Price structure, momentum and volatility generally provide more independent information than several closely related oscillators.
Disclaimer
Technical indicators rely on historical market data and cannot guarantee future performance. Cryptocurrency and leveraged trading involve substantial risks, including losses exceeding initial margin in certain products. Trading availability, order types and regulatory protections vary by platform and jurisdiction.