For day traders and swing traders, combining these indicators helps distinguish promising breakouts from weak moves that may reverse. The catch is that neither indicator guarantees follow-through. Price structure, market liquidity, and risk management still matter.
Key Takeaways
-
A volume ATR strategy combines trading volume and volatility expansion to evaluate breakout strength.
-
A breakout closing beyond resistance or support with above-average volume generally carries stronger confirmation.
-
Rising ATR indicates expanding price volatility, but doesn't identify trend direction.
-
Relative volume (RVOL), ATR-based stops, and candle closes help filter false signals.
-
Low liquidity, sudden volatility spikes, and weak follow-through can undermine otherwise convincing setups.
How Volume and Average True Range Confirm Crypto Breakouts
A price breakout occurs when an asset moves beyond an established resistance or support level. Resistance breakouts may indicate buying pressure, while bearish breakouts below support may indicate selling pressure.
Volume and ATR examine different parts of that movement.
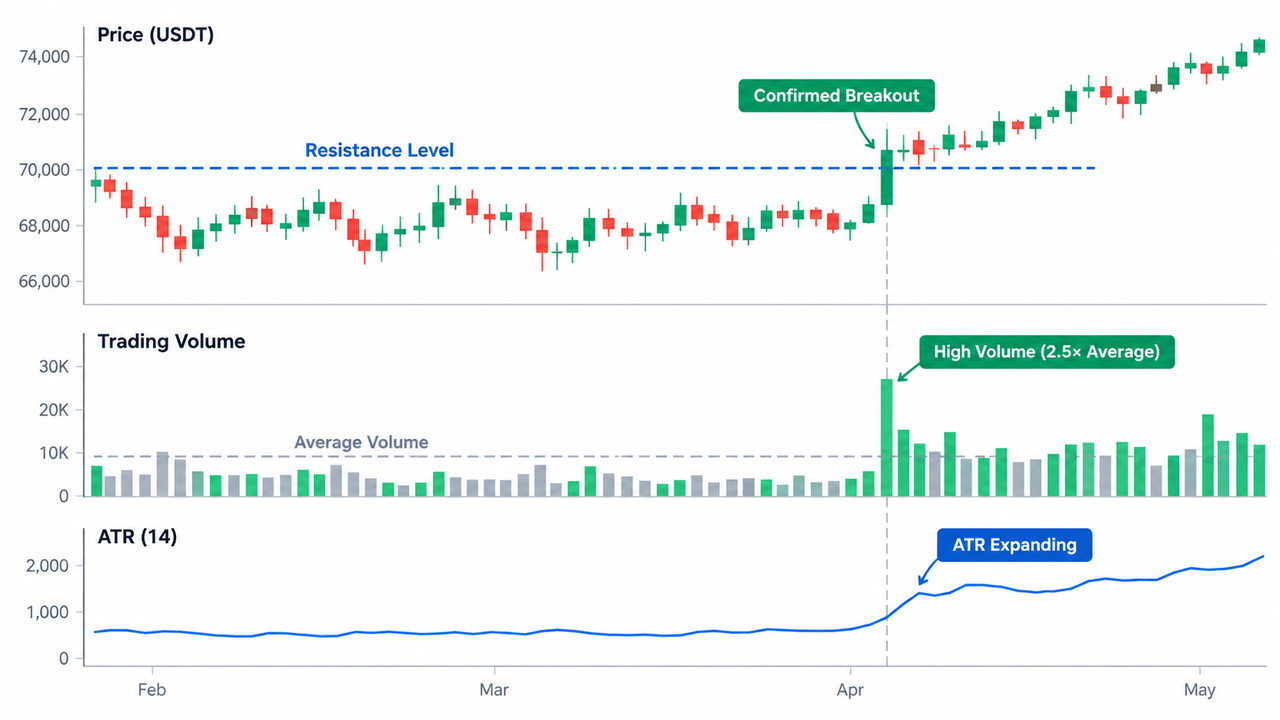
Trading volume measures participation. When volume increases during a breakout, more trading activity supports the price move. A breakout on weak volume may indicate limited participation.
Average True Range measures volatility. The ATR indicator uses historical price data to estimate the average trading range over a specified period.
A rising ATR indicates expanding volatility, whether prices move upward or downward.
| Indicator |
What It Measures |
Breakout Interpretation |
| Trading volume |
Transaction activity |
Higher volume suggests stronger participation |
| Relative volume (RVOL) |
Current volume versus historical average |
RVOL above 1 indicates above-average activity |
| ATR |
Average price range |
Rising ATR suggests volatility expansion |
| Price action |
Candle closes and market structure |
Confirms whether support or resistance was crossed |
These indicators complement breakout indicators used in crypto trading, particularly when markets transition from consolidation into trending conditions.
How to Use a Volume ATR Strategy Step by Step
Step 1: Identify Consolidation and Resistance Levels
Start by identifying a narrow trading range where prices have repeatedly failed to break above resistance or below support.
Extended periods of low volatility often precede larger price movements, although they cannot predict when a breakout will occur.
Mark the range boundaries using recent swing highs and lows or support and resistance indicators.
The breakout candle should close firmly beyond the identified level. A brief wick outside the range isn't enough.
Step 2: Confirm the Breakout With Volume Analysis
Compare breakout volume against the historical average for equivalent candle periods.
Relative Volume provides a straightforward calculation:
RVOL = Current Volume ÷ Average Volume
For example, if average hourly trading volume is 1,000 BTC and the breakout candle records 2,500 BTC, RVOL equals 2.5.
That's 150% above average.
Some traders screen for volume 100%–200% above average, equivalent to RVOL of 2–3. However, these are illustrative thresholds, not requirements for every valid breakout.
Volume indicators for trend confirmation can provide additional context, especially when activity increases during consolidation.
Compare completed candles with equivalent periods to avoid misleading intraday volume readings.
Step 3: Check ATR Values for Volatility Expansion
Once volume confirms participation, examine the current ATR against previous ATR readings.
A rising ATR indicates that price ranges are expanding. When combined with a confirmed breakout, this may support the case for continued movement.
For example, suppose Bitcoin's 14-period ATR is $400 before a breakout, while the breakout candle's true range reaches $800.
The candle's range is twice the previous ATR, suggesting an unusually large movement.
Some traders look for breakout candle ranges of 1.5–3 times ATR. However, a candle range of 2× ATR does not mean the ATR indicator itself doubled.
ATR responds gradually because it averages historical data.
A prolonged period of low ATR can signal volatility compression. Still, volatility indicators cannot determine breakout direction independently.
Step 4: Verify Price Action Before Entry
Strong volume and rising ATR become more useful when price closes beyond the breakout level.
An example bullish setup includes:
-
Bitcoin consolidates below $70,000.
-
A completed candle closes at $70,300.
-
Breakout volume reaches 2.2 times its historical average.
-
ATR begins rising from its consolidation level.
-
Price subsequently holds above the former resistance.
These hypothetical conditions provide multiple forms of confirmation.
A trader examining the BTC/USDT market on Gate.com can compare price candles, trading activity, and indicator readings before making trading decisions.
Waiting for a retest may improve confirmation, but it can also result in a missed entry when price continues without pulling back.
Calculating ATR: How the Average True Range Indicator Works
ATR calculates market volatility using each candle's True Range (TR).
True Range is the greatest of:
-
Current high minus current low
-
Absolute value of current high minus previous close
-
Absolute value of current low minus previous close
The standard ATR calculation typically uses 14 periods.
For Wilder's smoothing method:
Current ATR = [(Previous ATR × 13) + Current TR] ÷ 14
On a daily chart, this uses 14 daily candles. On an hourly chart, it uses 14 hourly candles.
ATR is a lagging technical analysis indicator because it relies on historical prices.
According to Fidelity's technical indicator documentation, an expanding ATR reflects increasing volatility rather than a bullish or bearish signal.
This distinction prevents traders from interpreting every volatility spike as trend confirmation.
Risk Management: ATR Stop-Loss and Take-Profit Levels
ATR helps traders adapt stop-loss distances to prevailing market volatility.
A common approach places stops approximately 1–3 ATR from the entry price, although market structure should determine the final placement.
Consider a hypothetical bullish breakout:
| Trading Variable |
Example |
Breakout Interpretation |
| Entry price |
$70,300 |
Higher volume suggests stronger participation |
| Current ATR |
$400 |
RVOL above 1 indicates above-average activity |
| Stop at 1× ATR |
$69,900 |
Rising ATR suggests volatility expansion |
| Stop at 2× ATR |
$69,500 |
Confirms whether support or resistance was crossed |
| Stop at 3× ATR |
$69,100 |
|
| Illustrative take-profit at 2R |
$71,900, using the 2× ATR stop |
|
A stop at 1 ATR may be vulnerable to normal fluctuations. A wider 2–3 ATR stop allows more room but increases potential loss per unit.
Position sizing should adjust accordingly.
For trailing stops, traders can reference an ATR multiple below the highest price reached after entry, updating the stop only when that reference moves favorably.
The FINRA guidance on stop orders highlights that stop prices aren't guaranteed execution prices during volatile conditions.
Crypto traders must also account for slippage and liquidation risks when using leverage.
How to Filter False Signals Using Volume, ATR, and Technical Analysis
False breakouts frequently occur when price crosses resistance without meaningful buying pressure or fails to maintain momentum.
| Market Condition |
Interpretation |
| Strong volume + rising ATR |
Potentially stronger breakout |
| Weak volume + flat ATR |
Greater risk of weak follow-through |
| Strong volume + falling ATR |
Participation without sustained range expansion |
| Rising ATR + low volume |
Possible liquidity-driven price spike |
| Breakout followed by range re-entry |
Potential failed breakout |
High-volume breakouts can still reverse, particularly around news events or during low-liquidity trading periods.
Avoid treating unusual volume as proof of genuine demand.
For additional trend confirmation, ADX and SuperTrend evaluate trend strength and direction. The Relative Strength Index (RSI) examines momentum, while moving averages can help identify broader market direction.
Multiple timeframes also matter. A bullish breakout on a 15-minute chart may conflict with resistance visible on the daily chart.
Conclusion
A volume ATR strategy combines market participation with volatility analysis to assess crypto breakouts.
The strongest setups generally feature a completed price breakout, above-average volume, expanding ATR, and subsequent price follow-through.
Volume helps assess participation. ATR reveals volatility expansion and helps establish risk limits.
Neither eliminates false signals. Market structure, liquidity, position sizing, and disciplined exits remain essential.
Frequently Asked Questions
What ATR Setting Works Best for Crypto Breakouts?
The default 14-period ATR is a common starting point. Shorter settings react faster but produce more noise, while longer settings smooth volatility changes. The appropriate setting depends on timeframe and trading style.
Is Volume More Important Than ATR for Breakout Confirmation?
Volume measures trading participation, while ATR measures volatility expansion. Neither is universally more important. Using both alongside price structure provides a broader assessment than either indicator alone.
Can Low ATR Predict a Crypto Breakout?
No. Sustained low ATR can identify volatility compression, but it cannot predict timing or price direction. Traders generally wait for a confirmed price break and stronger market participation.
Should a Stop-Loss Always Be at Least 1 ATR Away?
No. A 1 ATR distance is a commonly used reference, not a universal rule. Stops should account for nearby support or resistance, volatility, position size, and acceptable loss.
Can Volume and ATR Confirm Bearish Breakouts?
Yes. A close below support with increased selling activity and rising ATR can support bearish breakout confirmation. ATR measures volatility regardless of price direction.
Disclaimer
This content is for educational purposes only and does not constitute financial or investment advice. Crypto trading involves volatility, liquidity risk, and potential financial losses. Technical indicators rely on historical market data and cannot guarantee future outcomes.