That distinction matters on lower timeframes. A few candles can determine whether a scalp catches a short-term trend or becomes a whipsaw. Traders comparing WMA vs. EMA therefore need to understand how each moving average is calculated, how quickly it responds, and what happens when market conditions become noisy or sideways.
Key Takeaways
-
EMA gives recent price data exponentially greater influence and usually responds faster to sudden price changes.
-
WMA uses linearly declining weights and strictly limits its calculation to the selected period.
-
WMA is faster than a simple moving average but can overreact to individual candles in volatile markets.
-
Both EMA and WMA can generate false signals when price moves sideways around the average.
-
Scalpers can improve context by combining a fast moving average with price structure, volume, VWAP, or a slower trend filter rather than treating one crossover as a complete trading strategy.
WMA vs. EMA: Which Is Better for Scalping?
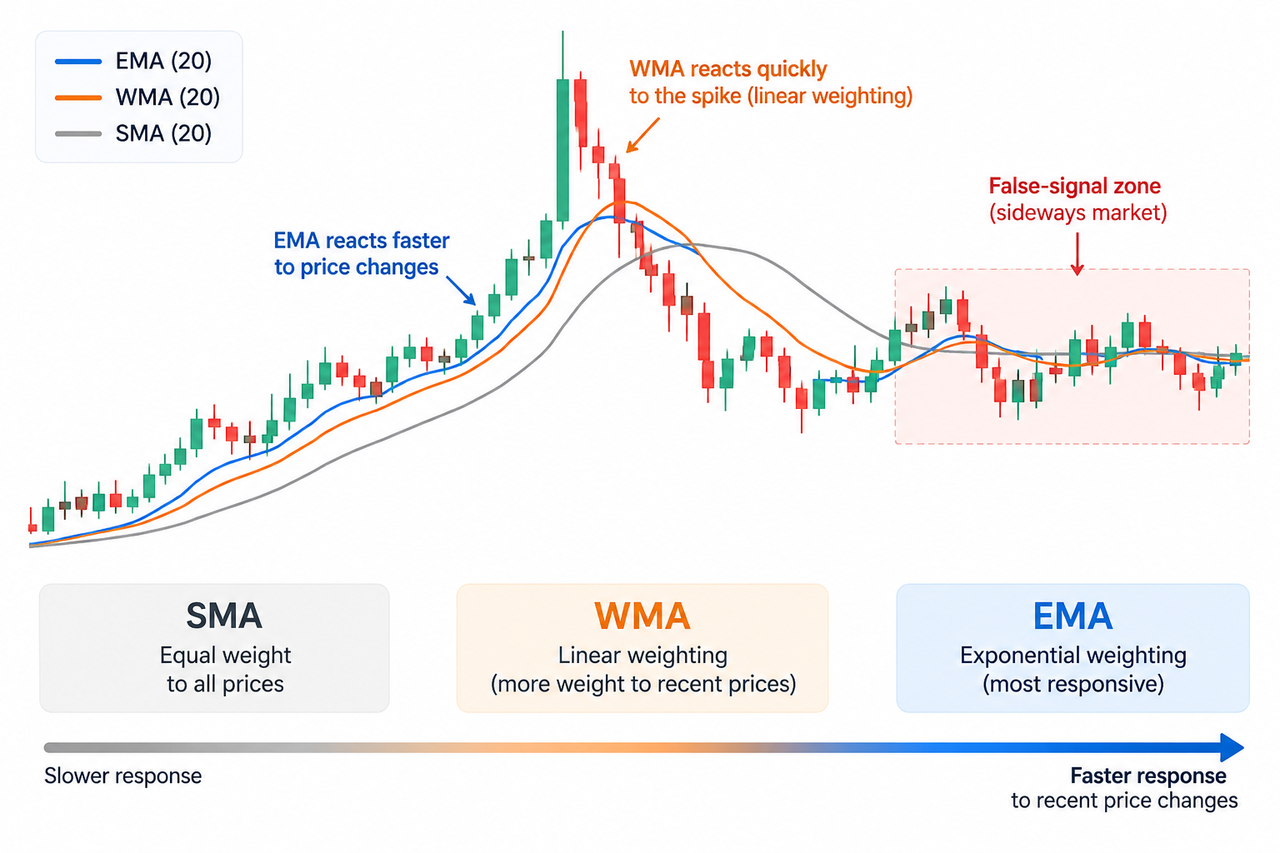
EMA will often be the first choice when a scalper needs the moving average to react quickly to short-term price changes. Because the exponential moving average continually gives more importance to recent observations, a fast EMA can stay close to price action and reveal changes in momentum quickly.
That responsiveness has a cost. A fast EMA can react to market noise as readily as it reacts to a genuine trend change. Scalpers using a 9-period EMA, for example, may see repeated price crosses during consolidation even though the broader trend direction hasn't changed.
WMA takes a different approach. A weighted moving average also emphasizes recent prices, but the weights fall in a straight, linear sequence. For a five-period WMA, the newest closing price might receive a weight of five, followed by four, three, two and one for progressively older data points.
The practical trade-off is subtle: both are fast moving averages, but EMA normally puts stronger continuing emphasis on new information, while WMA provides a clearly defined weighting window.
How Is Each Moving Average Calculated?
A standard simple moving average gives every price in the selected period equal weight. A 20-period SMA, for instance, sums the last 20 closing prices and divides the result by 20. That's why the simple moving average is usually slower to react than weighted alternatives.
WMA instead calculates a weighted average:
WMA = Σ(Price × Weight) ÷ Σ(Weights)
For a five-period WMA, recent data receives progressively greater importance:
5P₁ + 4P₂ + 3P₃ + 2P₄ + 1P₅
divided by:
5 + 4 + 3 + 2 + 1
The oldest price disappears completely once it falls outside the chosen period.
EMA works recursively. According to CME Group's explanation of moving-average calculations, its commonly used smoothing multiplier is:
Multiplier = 2 ÷ (Periods + 1)
The new EMA is then derived from the latest closing price and the previous EMA value. Older historical data therefore doesn't disappear abruptly; its influence decays exponentially over time. The CMT Association's discussion of exponential and weighted averages similarly notes that weighted averages give more importance to recent data to reduce lag.
This difference explains much of the behavior scalpers see on the same chart.
| Feature |
WMA |
EMA |
| Weighting |
Linear |
Exponential |
| Recent prices |
High importance |
Very high importance |
| Oldest data |
Removed after chosen period |
Influence gradually decays |
| Responsiveness |
Fast |
Usually faster |
| Noise sensitivity |
High |
High |
| Common role |
Short-term trend and confirmation |
Momentum, entries and trend timing |
| Main weakness |
Spike sensitivity and whipsaws |
Frequent reactions to short-term noise |
Why the Exponential Moving Average EMA Is Popular for Scalping
Scalping depends on recent price action, so responsiveness matters. An EMA can detect an acceleration or loss of short-term momentum earlier than a traditional moving average using equal weight.
The EMA 9 is commonly used as a fast momentum line, while the EMA 20 can provide a smoother short-term trend filter. A trader can also compare EMA 9, EMA 20 and EMA 50 when separating immediate momentum from the broader intraday trend.
EMA's popularity creates another practical consideration. Standard EMA settings are widely watched by market participants. When many traders monitor similar moving average settings, reactions around those areas can sometimes reinforce their importance as dynamic support or resistance. That doesn't make an EMA level inherently predictive, however.
CME Group's support and resistance material notes that traders commonly use moving averages with different lengths to identify possible dynamic support and resistance areas.
Where WMA Can Help Short-Term Traders
WMA can be useful when a trader wants recent price changes to matter substantially but prefers a fixed calculation window.
Consider a 10-period WMA. The newest candle receives the largest weight, while each preceding candle receives progressively less. Once a data point becomes the eleventh-oldest observation, it disappears from the calculation entirely.
That makes WMA transparent and relatively easy to interpret. The catch is that an unusually large candle may receive the highest weighting just as it appears. WMA can therefore overreact to single-candle spikes, particularly in volatile crypto markets.
If the spike quickly reverses, the moving average may move sharply and then change direction again. That behavior makes WMA prone to whipsaws in noisy lower-timeframe conditions.
A trader who wants another low-lag approach may compare both with the Hull Moving Average, which combines weighted moving average calculations to reduce lag while retaining smoothing.
Moving Average Crossovers and False Signals
Moving average crossovers are simple to recognize. A short-term MA crossing above a longer-term MA is commonly interpreted as a bullish signal, while a cross below may indicate bearish momentum.
On higher timeframes, famous examples include the golden cross and death cross. A 50-day moving average crossing below a 200-day moving average is commonly called a death cross. Those long-term signals serve a very different purpose from the short-term MA crosses used in scalping.
A scalper might instead monitor a fast EMA or WMA against a 20-period moving average. Yet faster settings create more signals, not necessarily better ones.
During sideways consolidation, price may cross both averages repeatedly. EMA reacts rapidly to recent price movements; WMA can jump after a large candle. Either behavior can produce false signals without a genuine trend change.
Using another market dimension can help. Open interest shows whether derivatives positioning is expanding or contracting, while Net Volume provides another view of buying and selling pressure.
Dynamic Support, Resistance and Market Conditions
Moving averages don't create guaranteed support and resistance levels. They identify average price areas around which market participants may react.
Suppose price remains above a rising EMA 20 and repeatedly pulls back toward it before continuing higher. A short-term trader may interpret the EMA as dynamic support. If price then breaks below the EMA and begins forming lower highs, the earlier trend structure may be weakening.
The same principle applies to WMA. The difference is how quickly the line adjusts.
Market conditions matter more than the choice of formula. In a clean directional trend, both indicators can filter trend direction effectively. During volatile consolidation, both can flip repeatedly.
The daily high and low and session high and low can provide fixed price structure alongside the moving average. A fast MA signal occurring directly beneath session resistance, for example, carries different context from the same signal after price has broken that level.
WMA vs. EMA in a Practical Scalping Setup
A useful approach is to separate trend context from entry timing.
Imagine BTC is trading above an upward-sloping 20 EMA on a five-minute chart. Price pulls back toward that average while a 9-period EMA begins turning upward again. The trader now has short-term momentum aligned with the broader intraday trend.
The setup becomes more informative if price is also above session support or VWAP.
WMA can replace the fast EMA in the same structure. Because WMA responds strongly to recent candles, a trader may watch whether the WMA turns back in the trend direction after the pullback.
For a live chart rather than a static example, the BTC/USDT spot market on Gate.com can be used to compare moving average behavior with current price action. The point isn't to trade every MA cross. It's to see how the same settings behave during trends, spikes and consolidation.
WMA, EMA and Long-Term Trends
Neither WMA nor a fast EMA should be confused with a long-term trend indicator simply because both are moving averages.
Longer periods smooth more short-term price fluctuations. A 50- or 200-period SMA is therefore often used when identifying long-term trends, while fast EMA and WMA settings are better suited to lower-timeframe trend changes.
This also explains why the answer changes with trading style. Scalpers usually value speed. Swing traders may accept more lag to reduce market noise, and investors using higher timeframes may prioritize smoother averages.
The best moving average setting is therefore tied to the timeframe and purpose, not just the formula.
Risk Management When Using WMA or EMA
All moving averages are lagging indicators because they are calculated from historical data. Faster weighting can reduce lag, but it can't remove it.
A strong candle can pull WMA sharply toward price. EMA can react to every new price movement and generate repeated crosses when conditions become choppy. Neither behavior confirms that a breakout or reversal will continue.
Position sizing, stop placement, liquidity and price structure still matter. Traders can also use volume or VWAP for intraday value as independent confirmation rather than stacking several moving averages that all process essentially the same price data.
Historical indicator signals don't guarantee future trading results.
Conclusion
For WMA vs. EMA scalping, EMA generally suits traders who want the fastest reaction to short-term momentum and a moving average widely followed by other market participants. WMA remains useful when a trader wants recent prices emphasized through a fixed, transparent weighting structure.
The trade-off is speed against noise. EMA can respond very quickly, while WMA can react strongly to individual price spikes. In sideways markets, both can produce repeated false signals.
Neither should be treated as a standalone entry system. Moving averages become more useful when their direction, slope and crossovers agree with price structure, support and resistance, volume, and disciplined risk management.
FAQ
Is WMA better than EMA for scalping?
Not universally. WMA can suit traders who prefer linear weighting and a fixed lookback, while EMA generally reacts faster to recent price changes. Market conditions and the selected period often matter more than the formula alone.
Is EMA more responsive than WMA?
Under commonly used formulas, EMA is generally considered more responsive to recent price movements than WMA and SMA. WMA is still substantially more responsive than an equal-weight SMA because recent prices receive larger weights.
Which moving average period is best for scalping?
There is no universal setting. Periods such as 9 and 20 are commonly used for short-term trading, but a setting that behaves well during a strong trend may generate many false signals during consolidation.
Why does WMA produce whipsaws?
WMA gives the newest candle its largest linear weighting. A sudden price spike can therefore move the WMA substantially, and a quick reversal may make the indicator change direction again before a sustained trend develops.
Can WMA and EMA be used together?
Yes. A trader can use one fast moving average for immediate momentum and another, slower average as a trend filter. Using several very similar fast averages may add clutter without providing genuinely independent confirmation.
Are EMA and WMA leading indicators?
No. Both are lagging indicators calculated from past price data. Their weighting methods reduce the delay relative to a slower SMA, but neither predicts future prices.
Disclaimer: Technical indicators can generate false signals, and historical price behavior does not guarantee future results.







