For crypto traders dealing with sudden Bitcoin price swings or unpredictable altcoin movements, choosing the right indicator can make position sizing, stop-loss placement, and breakout analysis more systematic.
The ten indicators below serve different purposes, from measuring actual price movement to assessing market sentiment and expected future volatility. None can reliably predict price direction on its own.
Key Takeaways
-
ATR and Bollinger Bands are among the most practical volatility indicators for measuring price movements and identifying market expansion.
-
Keltner Channels and Donchian Channels help identify breakout points, trading ranges, and potential trend continuations.
-
Historical volatility and Standard Deviation measure past price fluctuations, while implied volatility reflects market expectations.
-
High volatility creates larger potential price movements but also increases the risk of substantial trading losses.
-
Combining volatility indicators with trend indicators, volume analysis, and position sizing improves the context behind trading decisions.
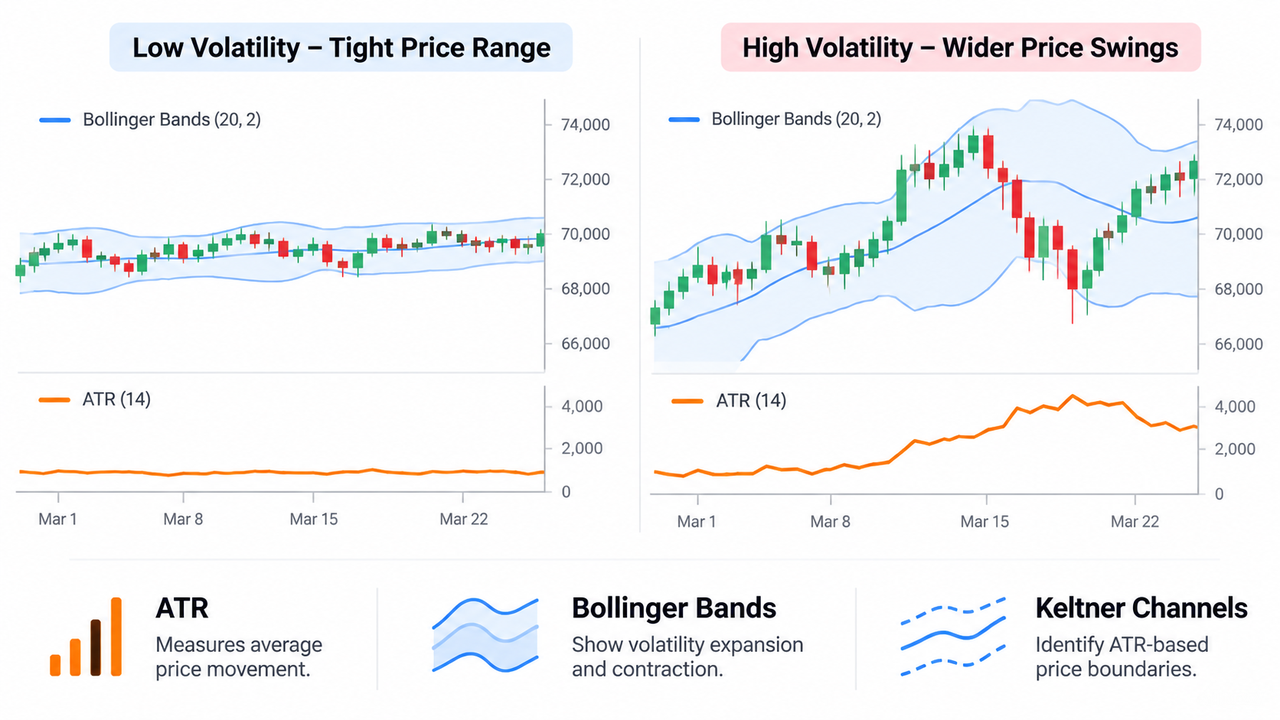
What Are Volatility Indicators in Crypto Trading?
Volatility indicators are technical analysis tools that measure how much an asset's price changes over a specific period.
Unlike trend indicators, which primarily assess market direction, volatility measures focus on the magnitude, dispersion, or expected size of price movements.
High volatility indicates wider price swings, while low volatility suggests relatively stable trading conditions.
Periods of low volatility sometimes precede stronger market movements, although compression alone cannot establish when a breakout will occur.
10 Best Volatility Indicators for Crypto Trading
| Volatility Indicator |
Primary Function |
Best Use |
| Average True Range (ATR) |
Measures average true range |
Stop-loss placement |
| Bollinger Bands |
Tracks price dispersion |
Volatility squeezes |
| Keltner Channels |
Uses EMA and ATR bands |
Trend breakouts |
| Standard Deviation |
Measures price dispersion |
Volatility changes |
| Historical Volatility |
Measures realized fluctuations |
Risk assessment |
| Chaikin Volatility |
Tracks high-low range changes |
Volatility acceleration |
| Relative Volatility Index |
Measures volatility-weighted direction |
Trend confirmation |
| Donchian Channels |
Tracks recent highs and lows |
Breakout levels |
| Bollinger Band Width |
Measures relative band expansion |
Volatility compression |
| Implied Volatility Index |
Measures options-implied expectations |
Market sentiment |
-
Average True Range (ATR): Best for Risk Management
Average True Range measures the average range of price movement across selected periods, typically 14 candles.
ATR incorporates each candle's high, low, and previous closing price to calculate the true range.
Higher ATR values indicate larger price swings, while lower values suggest calmer market conditions.
For example, if Bitcoin trades at $70,000 with a daily ATR of $2,000, its recent average true range is approximately $2,000. That doesn't establish whether the next movement will be upward or downward.
Traders commonly use ATR multiples to calculate volatility-adjusted stop-loss distances. However, wider stops require corresponding position-size adjustments.
-
Bollinger Bands: Best for Volatility Squeezes
Bollinger Bands consist of three lines: a middle simple moving average (SMA), an upper band, and a lower band.
The standard configuration uses a 20-period SMA with outer bands positioned two standard deviations away.
Bands expand during high volatility and contract when price fluctuations decrease.
A Bollinger Bands squeeze occurs when the bands narrow significantly, potentially preceding a stronger price move.
Prices near the upper band may be relatively elevated, while prices near the lower band may appear relatively depressed. Neither automatically establishes overbought or oversold conditions.
The distinction between Bollinger Band Width and ATR matters because one measures relative dispersion while the other measures trading ranges.
-
Keltner Channels: Best for Market Trend Breakouts
Keltner Channels combine an exponential moving average (EMA) with upper and lower bands calculated using ATR.
Unlike Bollinger Bands, which rely on Standard Deviation, modern Keltner Channels use average trading ranges.
A sustained movement beyond the upper channel may indicate strong bullish momentum. A breakdown below the lower channel can suggest bearish pressure.
However, prices may quickly return inside the channel during sideways market conditions.
The Keltner Channels and Bollinger Bands approach produces different indicator signals because their volatility calculations differ.
-
Standard Deviation: Best for Measuring Price Fluctuations
Standard Deviation measures how far an asset's prices deviate from their average value.
Higher readings indicate greater price dispersion, while lower values suggest tighter price clustering.
For example, Bitcoin moving repeatedly between $68,000 and $72,000 generally produces greater price dispersion than movement confined between $69,500 and $70,500, assuming comparable observation periods.
Standard Deviation is particularly useful when comparing current volatility with an asset's historical trading behavior.
Its main limitation is that it measures dispersion, not market direction.
-
Historical Volatility (HV): Best for Assessing Market Conditions
Historical Volatility measures the variability of past price returns over a selected period, commonly expressed as an annualized percentage.
High Historical Volatility indicates larger realized price fluctuations, while lower readings suggest relatively calmer trading.
Crypto traders can compare historical volatility across Bitcoin, Ethereum, and altcoins to understand differences in market risk.
Unlike ATR, which uses price units, annualized HV can support cross-asset comparisons when calculated consistently.
However, past volatility doesn't guarantee similar future movements.
-
Chaikin Volatility Indicator: Best for Tracking Volatility Acceleration
The Chaikin Volatility Indicator measures the rate of change in the smoothed difference between high and low prices.
A common configuration compares a nine-period exponential moving average of the high-low range with its value nine periods earlier.
Rising Chaikin Volatility suggests expanding trading ranges, while declining readings indicate contraction.
Sudden increases sometimes accompany strong market movements or potential reversal points.
The catch is that Chaikin Volatility doesn't independently establish whether buyers or sellers control the market.
-
Relative Volatility Index (RVI): Best for Directional Confirmation
The Relative Volatility Index measures the directional balance of volatility using the standard deviation of price changes.
Common implementations produce readings between 0 and 100, with values above 50 generally suggesting stronger upward volatility-weighted pressure.
Unlike ATR, RVI incorporates directional information.
Crypto traders may combine RVI with the Relative Strength Index (RSI) to examine whether momentum and volatility-weighted pressure support the same market trend.
Still, extreme RSI readings during high volatility can reflect trend exhaustion or sustained momentum. Neither guarantees reversal.
-
Donchian Channels: Best for Identifying Breakout Points
Donchian Channels identify the highest high and lowest low over a selected lookback period, commonly 20 candles.
The upper and lower boundaries establish recent resistance and support levels.
A close above the previous Donchian upper boundary may indicate a bullish breakout, while a close below the previous lower boundary suggests bearish pressure.
Unlike statistical volatility measures, Donchian Channels primarily track price boundaries.
Combining Donchian Channels with Keltner Channels helps distinguish historical breakout levels from ATR-based channel boundaries.
-
Bollinger Band Width: Best for Low-Volatility Conditions
Bollinger Band Width measures the relative distance between the upper and lower Bollinger Bands.
Formula:
Bollinger Band Width = (Upper Band − Lower Band) ÷ Middle Band
Some charting platforms multiply the result by 100.
Very low values indicate compressed market volatility. Rising readings suggest the bands are expanding.
For example, a trader may monitor falling Band Width before checking whether trading volume increases during a breakout.
Combining volatility indicators with other TradingView indicators can provide additional directional context.
-
Implied Volatility Index: Best for Market Sentiment
Implied volatility reflects expected future price fluctuations derived from options prices.
The Chicago Board Options Exchange's VIX Index, often called the fear gauge or fear index, estimates expected 30-day volatility in the S&P 500.
VIX measures US equity-market expectations, not cryptocurrency volatility directly.
For crypto-specific analysis, Deribit DVOL represents an annualized, options-implied 30-day volatility expectation for supported cryptocurrencies.
Higher implied volatility generally indicates greater market uncertainty, but doesn't predict price direction.
How to Use Volatility Indicators in Crypto Trading
A practical strategy combines volatility measurement, directional analysis, and risk management.
Consider a trader evaluating the BTC/USDT perpetual market on Gate.com.
First, Bollinger Band Width identifies whether volatility is compressed. Next, ATR estimates typical price movements, helping determine stop-loss distance.
The trader then examines trend indicators and trading volume to assess market direction and participation.
For example, expanding bands, rising ATR, and increasing volume accompanying a price breakout provide more context than any single indicator.
Position size should reflect the proposed stop distance, available capital, and acceptable risk. High volatility may require smaller positions.
Shorter timeframes also tend to generate more market noise and false signals than daily charts.
Limitations of Volatility Indicators
Volatility indicators cannot consistently forecast future prices or guarantee profitable trading strategies.
ATR and historical volatility rely on past movements. Bollinger Bands can produce false breakouts, while options-based volatility indices reflect market expectations that may prove inaccurate.
Market liquidity, leverage, slippage, and unexpected news can amplify losses beyond what historical indicator readings suggest.
Conclusion: Which Volatility Indicators Are Best?
ATR is particularly useful for risk management, Bollinger Bands and Band Width for volatility compression, and Keltner or Donchian Channels for identifying breakout conditions.
Historical and implied volatility offer broader perspectives on realized fluctuations and market expectations.
The most useful approach combines volatility indicators with price structure, market direction, and volume confirmation rather than relying on a single technical signal.
FAQs
What is the best volatility indicator for crypto trading?
ATR and Bollinger Bands are widely used volatility indicators. ATR measures trading ranges for risk management, while Bollinger Bands help identify volatility expansion and compression. The better choice depends on the trader's strategy.
Does high volatility mean crypto prices will increase?
No. High volatility indicates larger price fluctuations, which may occur during rallies or declines. Volatility indicators generally cannot predict price direction independently.
What is the difference between ATR and Standard Deviation?
ATR calculates average true ranges using high, low, and previous closing prices. Standard Deviation measures price dispersion around an average. ATR is useful for estimating trading ranges, while Standard Deviation supports statistical volatility analysis.
Can Bollinger Bands predict crypto breakouts?
Bollinger Bands can identify compressed volatility that sometimes precedes significant price movement. They cannot reliably predict breakout timing or direction, and false signals remain possible.
Is the VIX a reliable indicator for Bitcoin volatility?
VIX measures expected volatility in the S&P 500, not Bitcoin. Bitcoin-specific implied volatility measures, such as DVOL, provide more direct information about expectations embedded in crypto options markets.
Disclaimer
This content is for educational purposes only and does not constitute financial or investment advice. Cryptocurrency markets carry substantial risks, including sudden price movements, liquidity shortages, and leveraged trading losses. Technical indicators and historical performance do not guarantee future results. Product availability and trading rules may differ by jurisdiction.







