For crypto day traders and swing traders, a common approach uses a 14-period ADX above 25 alongside a SuperTrend configured with a 10-period Average True Range (ATR) and a multiplier of 3.
This combination can help avoid unnecessary trades in sideways markets. However, both indicators rely on historical price data, so confirmation may arrive after a substantial move has already occurred.
Key Takeaways
-
SuperTrend identifies direction, displaying bullish or bearish conditions using ATR-based price bands.
-
ADX confirms trend strength, with readings above 25 commonly indicating an established trend.
-
A basic strategy accepts SuperTrend entry signals only when ADX is above the selected threshold.
-
Standard settings are SuperTrend 10/3 and ADX 14, although shorter timeframes may require different parameters.
-
Combining both indicators can reduce weak-trend entries, but it cannot eliminate false signals or losing trades.
How the ADX Indicator and SuperTrend Indicator Work Together
The strategy works because its two technical indicators answer different questions.
ADX Indicator: Measuring Trend Strength
The Average Directional Index, developed by J. Welles Wilder, measures trend strength on a scale from 0 to 100. It doesn't independently indicate whether prices are rising or falling.
ADX belongs to the Directional Movement Index (DMI) system, which contains three lines:
-
ADX: Measures overall trend strength.
-
+DI: Measures positive directional movement.
-
-DI: Measures negative directional movement.
When +DI exceeds -DI, upward directional pressure dominates. The opposite suggests downward pressure.
According to StockCharts' ADX interpretation, readings above 25 generally indicate strong trends, while readings below 20 suggest little or no established trend.
The ADX indicator is particularly useful when market noise makes price direction difficult to assess.
SuperTrend Indicator: Identifying Trading Direction
The SuperTrend indicator combines price movement with Average True Range to track market direction and volatility.
Its basic calculation uses:
Basic Upper Band = (High + Low) / 2 + (Multiplier × ATR)
Basic Lower Band = (High + Low) / 2 − (Multiplier × ATR)
These basic upper and lower bands feed into adjusted trailing bands that determine the displayed SuperTrend line.
As described in TradingView's SuperTrend documentation, the indicator switches between bullish and bearish conditions when price crosses the relevant band.
-
Green SuperTrend: Bullish regime, with the line below price.
-
Red SuperTrend: Bearish regime, with the line above price.
Colors may vary across platforms.
The SuperTrend indicator can also function as dynamic support or resistance and provide a reference for trailing stops.
ADX SuperTrend Strategy Principles and Trading Logic
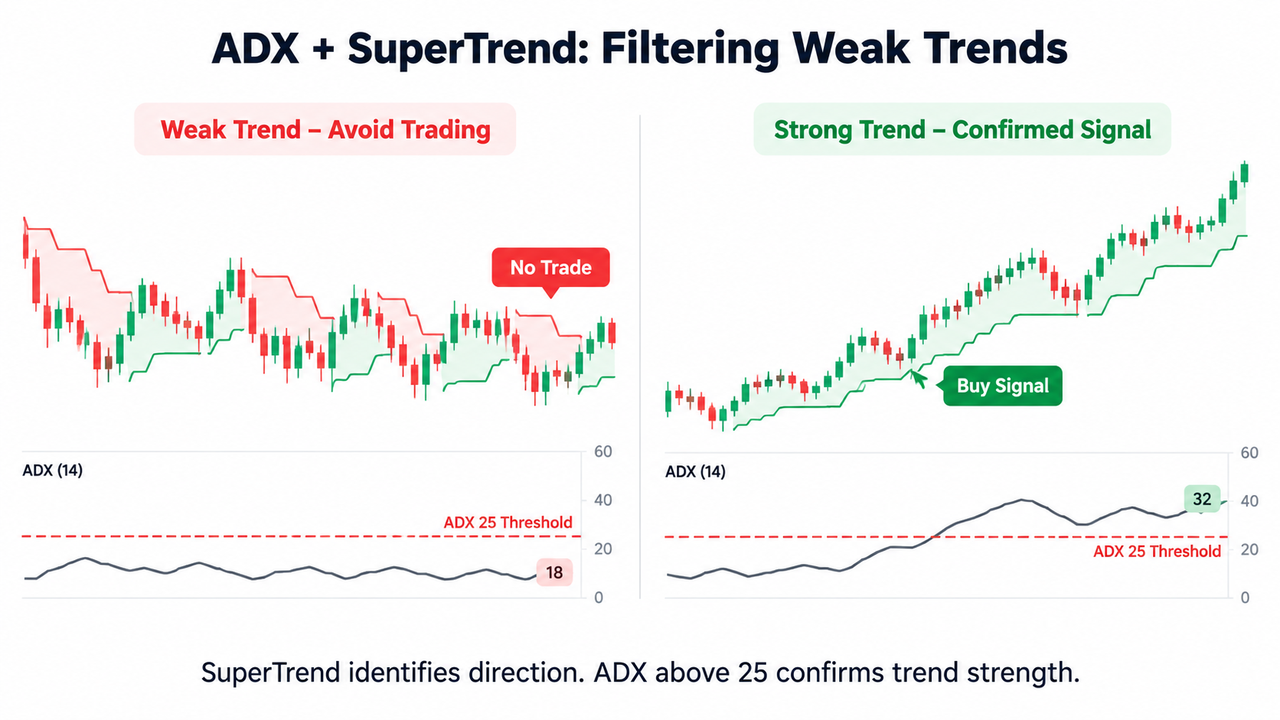
The central trading logic is straightforward: SuperTrend determines direction, and ADX determines whether a new trend-following trade is permitted.
| ADX Value |
Market Interpretation |
Strategy Action |
| Below 20 |
Weak or range-bound market |
Avoid new trend-following entries |
| 20–25 |
Developing or uncertain trend |
Wait for stronger confirmation |
| Above 25 |
Established trend strength |
Consider qualifying SuperTrend signals |
| Above 40 |
Very strong trend |
Watch for extended price movement and exhaustion |
An ADX filter doesn't guarantee trading accuracy. It simply removes signals that fail the chosen trend-strength condition.
For example, a bullish SuperTrend flip during a consolidation phase may look promising. If ADX remains at 17, the strategy rejects the entry.
That discipline matters because sideways market indicators often behave differently from trend-following tools.
How to Use an ADX SuperTrend Strategy Step by Step
Step 1: Apply the SuperTrend Settings
Start with a standard SuperTrend configuration:
-
ATR Period: 10
-
ATR Multiplier: 3
-
ADX Length: 14
-
ADX Threshold: 25
These strategy parameters provide a starting point for testing, not universally optimal settings.
A trader examining the BTC/USDT spot market on Gate.com can compare SuperTrend direction with ADX readings on the same chart and timeframe, where the chart supports these indicators.
Step 2: Apply the ADX Filter
Set the strategy to permit new trend-following trades only when ADX exceeds 25.
For a bullish setup, confirm that SuperTrend is green and ADX is above the threshold.
For a bearish setup, confirm that SuperTrend is red and ADX exceeds 25.
The +DI and -DI lines provide optional directional confirmation. A bullish setup is better aligned when +DI exceeds -DI.
Step 3: Wait for Candle Closure
A price crossing the SuperTrend line during an unfinished candle can reverse before that candle closes.
Waiting for candle closure reduces premature entries, although it introduces additional lag risk.
Step 4: Define Entry and Exit Signals
A basic rules-based setup uses:
Buy signal: SuperTrend turns bullish, the candle closes, and ADX exceeds 25.
Sell signal: SuperTrend turns bearish, the candle closes, and ADX exceeds 25.
For spot traders, a bearish signal may indicate reducing or exiting an existing position rather than opening a short.
The SuperTrend line can help determine a trailing exit, although an ATR-based stop doesn't guarantee execution at the displayed level.
Step 5: Apply Risk Management
Set a stop-loss, calculate position size, and establish a maximum acceptable loss before executing trades.
A strict daily maximum-loss rule can prevent repeated entries after several unsuccessful signals.
If ADX begins declining, monitor potential trend exhaustion. Falling ADX indicates weakening trend strength, not necessarily an immediate reversal.
Best SuperTrend Settings and ADX Filter by Timeframe
Different market environments and trading instruments may require parameter adjustments.
| Trading Style |
ATR Period |
Multiplier |
ADX Length |
ADX Filter |
| Scalping |
7 |
2 |
14 |
Above 25 |
| Day Trading |
10 |
3 |
14 |
Above 25 |
| Swing Trading |
10 |
3 |
14 |
Above 25 |
A lower multiplier places the SuperTrend bands closer to price, increasing sensitivity but potentially producing more false signals.
Some traders test a multiplier of 2 during high-volatility news events. However, this tighter configuration can increase whipsaws rather than improve trading accuracy. A wider multiplier or avoiding the event entirely may be more appropriate.
Dynamic parameter adjustment should be evaluated against historical data. Charles Schwab's ADX analysis also highlights that thresholds between 20 and 25 can carry useful information about developing trends.
Multi-Timeframe ADX SuperTrend Strategy
Multi-timeframe analysis helps traders distinguish temporary price movements from broader trends.
For example, a trader might:
-
Check the 4-hour SuperTrend to identify the broader direction.
-
Confirm that the 4-hour ADX exceeds 25.
-
Look for a matching SuperTrend signal on the 15-minute chart.
-
Check local support and resistance before entering.
This approach avoids taking every short-term signal against a stronger higher-timeframe trend.
The same principle appears in trend continuation trading, where price structure and indicator confirmation work together.
ADX SuperTrend Strategy Advantages and Limitations
The primary strategy advantage is its ability to separate directional signals from trend-strength confirmation.
SuperTrend adapts its distance from price according to ATR, while ADX helps identify potentially unsuitable market conditions.
However, several limitations remain.
Lag risk: Both indicators use smoothed historical data. Strong trends may already be underway before both agree.
Parameter sensitivity: Shorter ATR periods and smaller multipliers increase responsiveness but can create frequent SuperTrend flips.
Market volatility: Sudden news events, liquidity gaps, and sharp reversals may invalidate signals before planned exits execute.
False confidence: An ADX value above 25 doesn't establish that the current trend will continue.
Combining multiple technical indicators may improve signal selection, but it doesn't automatically improve win rate or profitability. The use of indicator combinations to reduce false signals still requires validation across different market environments.
Conclusion
An ADX SuperTrend strategy uses SuperTrend to identify market direction and ADX to filter weak trends. A 14-period ADX above 25 and SuperTrend settings of 10/3 provide a practical starting framework.
The approach is generally more suitable for established trending markets than consolidation phases. Yet combining two lagging indicators cannot remove execution risk, false breakouts, or late entries.
Consistent position sizing, tested strategy parameters, and awareness of market conditions remain essential.
Frequently Asked Questions
What Is the Best ADX Setting for a SuperTrend Strategy?
A 14-period ADX with a threshold above 25 is a common starting point. Traders may test thresholds between 20 and 25 depending on their trading instruments, timeframe, and acceptable signal frequency.
Can ADX and SuperTrend Reduce False Trading Signals?
Combining ADX and SuperTrend can filter some false signals by rejecting entries when trend strength is insufficient. It cannot eliminate false signals, particularly during sudden volatility spikes or trend reversals.
What Happens When SuperTrend Turns Green but ADX Is Below 25?
Under a strict ADX SuperTrend strategy, no new trade is taken. The bullish SuperTrend signal remains unconfirmed until ADX exceeds the selected threshold, although price may continue rising before confirmation arrives.
Is ADX SuperTrend Better for Scalping or Swing Trading?
Both are possible. Scalping often uses faster SuperTrend settings, such as ATR 7 with a multiplier of 2, while swing trading commonly starts with ATR 10 and a multiplier of 3. Performance depends on the market, costs, timeframe, and risk controls.
Can the SuperTrend Line Be Used as a Stop-Loss?
Yes. Traders sometimes use the ATR-based SuperTrend line as a dynamic trailing stop-loss reference. However, the line can sit too close or too far from price for a particular position, and stop orders may experience slippage.
Disclaimer
This content is for educational purposes only and does not constitute financial or investment advice. Technical indicators and historical strategy performance do not guarantee future results. Cryptocurrency trading involves substantial risk, including potential capital loss. Trading products, leverage availability, and applicable restrictions may differ by jurisdiction.