For scalpers and short-term traders, these signals help assess liquidity, potential price movements, and whether a breakout has genuine support. But an imbalance alone cannot predict where price will move next.
Key Takeaways
-
Order flow imbalance measures short-term differences between buying and selling activity, including changes in available liquidity.
-
Order book imbalance compares resting buy and sell orders, while cumulative volume delta tracks aggressive executed trades.
-
Significant imbalances may precede price movements, particularly when market depth is thin.
-
Footprint charts, liquidity heatmaps, and volume profiles help identify absorption, aggressive trading, and potential breakout levels.
-
Order flow signals work best alongside price structure, trading volume, and risk management rather than as standalone entry signals.
What Is Order Flow Imbalance in Crypto Trading?
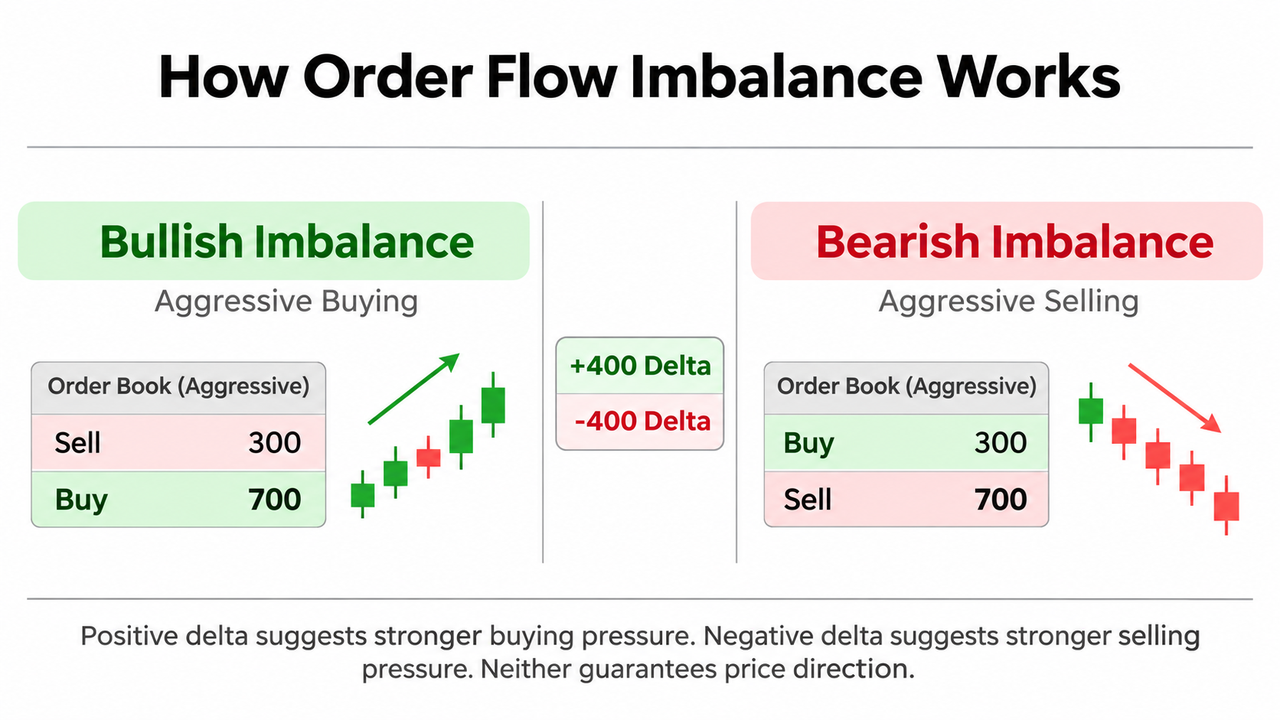
Order flow imbalance describes the difference between buying and selling pressure in a market over a given period.
In simple terms, it helps answer a question: are buyers or sellers creating more pressure on available liquidity?
A positive imbalance generally suggests stronger buying-side pressure. A negative imbalance points toward stronger selling-side pressure.
The distinction becomes clearer when examining how cryptocurrency orders interact.
Market buy orders execute against resting sell limit orders. Market sell orders execute against resting buy limit orders. These transactions change available liquidity, potentially moving the best bid price or best ask price.
However, order flow imbalance has several definitions.
In academic market microstructure research, Order Flow Imbalance (OFI) measures changes in supply and demand at the best bid and ask, including new limit orders, executions, and cancellations.
In trading software, the term may also describe differences between buyer-initiated and seller-initiated executed volume.
These measures are related but not interchangeable.
Research published in the Journal of Financial Econometrics, titled The Price Impact of Order Book Events, found a relationship between short-term price changes and order flow imbalance in U.S. equity markets. Its findings also showed that price impact tends to increase as market depth decreases.
Crypto traders can apply the same analytical framework, although fragmented exchange liquidity and different market conditions affect actual results.
How Order Flow Trading Works
Order flow trading studies how market participants submit, execute, modify, and cancel orders.
Traditional technical analysis primarily interprets historical price movements. Order flow analysis adds information about trading activity occurring behind those movements.
Three components matter.
Market Orders and Aggressive Trading
Market orders seek immediate execution against available liquidity.
Aggressive buying occurs when market buy orders consume resting sell orders at the ask price. Aggressive selling occurs when market sell orders consume resting bids.
For example, suppose Bitcoin trades near $80,000 and market participants submit large market buy orders.
If those orders consume available sell liquidity at successive price levels, the price may move upward.
But if large passive limit orders absorb the buying, price might remain almost unchanged.
The same buying pressure can produce different outcomes depending on available liquidity.
Limit Orders and Passive Liquidity
Limit orders specify the maximum purchase price or minimum selling price.
Resting buy limit orders appear on the bid side of the order book. Resting sell limit orders appear on the ask side.
Market makers commonly place orders on both sides, seeking to provide liquidity while managing inventory and transaction costs.
Large passive limit orders can absorb incoming market orders without allowing price to move significantly.
Institutions may also use iceberg orders, displaying only part of a larger intended quantity. Consequently, visible market depth doesn't always reveal the full amount available for execution.
Cancellations and Liquidity Changes
Order book liquidity changes even when no trade occurs.
If traders cancel substantial buy orders near the best bid, available support may weaken. Conversely, removing sell orders can reduce resistance to upward price movements.
That is why measuring only completed transactions misses part of the order flow picture.
How to Calculate Order Book Imbalance and OFI
An order book imbalance compares resting buy and sell quantities within a specified number of price levels or distance from the current price.
One common measure is Normalized Order Book Imbalance (OBI):
OBI = (Bid Volume − Ask Volume) / (Bid Volume + Ask Volume)
The result ranges from −1 to +1 when both volumes are nonnegative and their total is positive.
Consider a hypothetical BTC/USDT order book:
| Measurement |
Volume |
| Resting buy orders |
120 BTC |
| Resting sell orders |
80 BTC |
| Total displayed volume |
200 BTC |
| Normalized OBI |
0.2 |
| Bid-to-ask ratio |
1.5 |
Here, buyers account for 60% of displayed depth, compared with 40% on the sell side.
An OBI of +0.20 suggests more resting bid liquidity than ask liquidity across the measured levels.
It does not establish that more market buys have executed.
A substantial positive OBI can indicate potential upward support, while a strongly negative reading may suggest greater resting sell liquidity.
There is no universally reliable imbalance threshold. A reading considered significant in a thin altcoin book may be normal in a highly liquid Bitcoin market.
Order Flow Index and Price Impact
Event-based OFI goes further by measuring changes at the best bid and ask between order book updates.
It incorporates:
-
New liquidity appearing at the best available prices.
-
Existing liquidity disappearing through executions or cancellations.
-
Changes in the best bid and ask prices.
An Order Flow Index or OFI indicator may aggregate these signed changes over a selected time period.
A simplified empirical relationship is:
Price Change ≈ Price Impact Coefficient × OFI
The price impact coefficient estimates how strongly changes in order flow correspond to price changes in a given market.
It is estimated from observed data rather than being a universal constant.
High liquidity generally reduces price sensitivity to a given imbalance. A thin book can produce larger price moves from relatively small orders.
Reading Market Depth and Order Book Imbalances
Market depth shows the quantity of resting limit orders available at different price levels.
Most crypto order books display bids on one side and asks on the other, although their layout differs by platform.
The best bid is the highest available buying price. The best ask is the lowest available selling price.
Consider three situations:
| Order Book Condition |
Possible Interpretation |
| Large bids near the current price |
Potential buying support |
| Large asks above the current price |
Potential selling resistance |
| Thin liquidity across nearby levels |
Greater potential price impact |
Suppose price approaches $80,200, where substantial sell orders are displayed.
If aggressive buyers repeatedly consume those sell orders and price continues higher, buying pressure may be overcoming resistance.
If buying volume increases but price cannot advance, passive sellers may be absorbing demand.
And if the sell wall disappears before execution, the apparent resistance was less durable than it initially looked.
Order book analysis becomes more useful when traders observe how liquidity changes rather than treating a single snapshot as permanent.
On the Gate.com BTC/USDT spot market, the order book, recent transactions, and price chart can be viewed together to compare displayed liquidity against actual trading activity.
Using Cumulative Volume Delta to Confirm Flow Imbalances
Cumulative Volume Delta (CVD) measures the running net difference between aggressive buying and selling volume.
The calculation begins with volume delta:
Volume Delta = Buyer-Initiated Volume − Seller-Initiated Volume
CVD = Previous CVD + Current Volume Delta
Suppose a trading period records 500 BTC of buyer-initiated trades and 350 BTC of seller-initiated trades.
Volume delta equals +150 BTC.
If the previous CVD was +200 BTC, the new reading becomes +350 BTC.
A rising CVD suggests buyers are executing more aggressively than sellers. A falling CVD indicates stronger aggressive selling.
This differs from ordinary trading volume, which counts activity without indicating the initiating side.
The distinction between net volume and volume delta matters when interpreting market participation.
When CVD and Price Disagree
CVD becomes particularly interesting when its direction differs from price.
For example:
-
Price rises and CVD rises: aggressive buyers are supporting the move.
-
Price falls and CVD falls: aggressive selling accompanies the decline.
-
Price rises while CVD falls: passive buyers, liquidity changes, or differences in trading venues may be influencing price.
-
CVD rises while price stays flat: passive sellers may be absorbing aggressive buying.
A divergence identifies a condition worth investigating, not an automatic reversal.
Combining CVD with buying and selling pressure analysis helps distinguish market participation from actual price progress.
How Footprint Charts Reveal Order Flow Imbalance
Footprint charts display executed buying and selling volume at individual price levels within each candle.
Unlike conventional candlestick charts, they show where aggressive activity occurred.
Many footprint layouts place seller-initiated volume on the left side and buyer-initiated volume on the right side.
Some platforms compare diagonally adjacent bid and ask volumes to identify imbalances.
For example, a hypothetical footprint might show 300 units of aggressive buying against 100 units of aggressive selling under a specified comparison method.
That represents a 3:1 buying ratio.
A platform might highlight such a reading as bullish, depending on its configured threshold.
Repeated buying imbalances across adjacent price levels are sometimes called stacked imbalances.
These may indicate sustained aggressive demand, particularly when price breaks through resistance.
However, a large buy imbalance near a candle's high can also appear before an unsuccessful breakout.
Traders should examine whether price actually holds above the contested level.
Footprint Charts vs. Volume Profile
A volume profile aggregates completed trading volume into a horizontal histogram by price level.
High-volume nodes show where substantial transactions occurred. Low-volume nodes indicate price areas with comparatively little historical trading activity.
Footprint charts reveal the direction of aggressive transactions at those levels. Volume profile reveals where activity was concentrated.
Combined, they help evaluate whether a significant imbalance is developing near an established trading area or in a relatively thin price zone.
Liquidity Heatmaps and Absorption Trading
Order book heatmaps visualize displayed liquidity over time, often using color intensity.
Brighter regions commonly represent larger concentrations of resting orders, although color schemes vary by software.
Unlike a static order book, a heatmap shows whether liquidity persists, moves, or disappears.
Consider Bitcoin approaching a large sell wall.
Aggressive buying increases, but price repeatedly fails to break through.
That behavior may indicate absorption: passive sellers are executing against incoming buy orders while defending the price level.
The reverse occurs when large passive buyers absorb aggressive selling near support.
Absorption trading focuses on the relationship between executed orders and price response.
A useful question is whether substantial aggressive volume produces meaningful price progress.
If it doesn't, the opposing liquidity may be stronger than the market initially suggests.
However, visible order book depth can mislead. Large orders may be canceled, replaced, or distributed across venues.
The U.S. Commodity Futures Trading Commission has documented spoofing activity involving orders intended to be canceled before execution.
Traders should avoid assuming every large order wall represents genuine long-term buying or selling interest.
A Practical Order Flow Trading Strategy
Order flow imbalance works best as a confirmation tool within an existing trading strategy.
A practical workflow combines market structure, aggressive volume, and liquidity behavior.
Step 1: Identify a Relevant Price Level
Begin with an established support or resistance level, previous trading day high, or session boundary.
For instance, price may be approaching a resistance level that rejected several earlier advances.
Using validated support and resistance levels reduces the temptation to react to every brief imbalance.
Step 2: Check the Order Book
Observe whether resting sell liquidity increases or decreases as price approaches resistance.
A thinning ask side can make an upward move easier, but only if aggressive buyers continue participating.
Large walls that repeatedly disappear deserve skepticism.
Step 3: Confirm Executed Buying or Selling
Compare footprint imbalances with CVD.
For a potential bullish breakout, look for aggressive buying, positive delta, and actual price progress.
If CVD rises but price repeatedly rejects the same level, absorption may be preventing the breakout.
Step 4: Watch the Breakout and Retest
A price break supported by aggressive buying becomes more convincing if the market subsequently holds the broken resistance as support.
The breakout confirmation and retest approach helps distinguish continued acceptance above a level from a temporary liquidity-driven spike.
Conversely, aggressive buying followed by immediate rejection may indicate a false breakout.
Step 5: Define Risk Before Entering
Position size should reflect the distance to invalidation and the amount of capital at risk.
Avoid placing a stop solely because an imbalance appeared.
The protective level should correspond to the market structure that would invalidate the trade idea.
Transaction costs, spread, slippage, and fees also matter, especially for scalping strategies with small expected price movements.
Order Flow Imbalance in Futures Trading and High-Frequency Markets
Futures trading adds leveraged positioning and liquidation dynamics to ordinary order flow.
A futures contract allows traders to gain exposure to an underlying asset without necessarily owning it.
Order flow identifies aggressive transactions, while open interest and volume provide different information about outstanding contracts and participation.
For example, rising open interest alongside aggressive buying may indicate expanding futures positioning. It does not establish that every buyer is opening a new long position.
During October 10–11, 2025, the crypto market experienced a liquidation cascade involving more than $19 billion in leveraged positions, according to market data cited by Reuters. Thin liquidity contributed to unusually sharp price movements.
The episode illustrated how forced market orders can interact with depleted liquidity during severe market stress.
High-frequency trading introduces another challenge.
Algorithms may submit, modify, and cancel limit orders many times within a second. This makes order book information highly time-sensitive.
Professional high-frequency finance systems use tick data, synchronized timestamps, and specialized software to reconstruct these changes.
Academic examples involving E-mini futures and equity order books demonstrate similar microstructure principles, but crypto markets differ in venue fragmentation and continuous trading hours.
The CME Group's futures trading reference explains how market orders, limit orders, and displayed depth interact in centralized futures markets.
Common Limitations of Order Flow Analysis
Order flow provides detailed information about immediate market activity. Its reliability still depends on data quality and context.
Fragmented liquidity: An imbalance on one exchange may not represent the wider crypto market. Different venues can display different depth and executed volume.
Hidden liquidity: Iceberg orders and other execution methods can conceal substantial passive interest.
False signals: Aggressive buying may produce little upward movement when large passive sellers absorb the orders.
High-frequency noise: Small changes can reverse quickly, especially during volatile periods.
Historical limitations: Past performance, backtested signals, and previous price responses do not guarantee future results.
Market conditions also change throughout the trading day. High-liquidity periods generally behave differently from quiet sessions.
The Asia, London, and New York trading sessions can have different participation patterns, even though cryptocurrency trading operates continuously.
Effective order flow analysis requires reliable order book data and, for detailed reconstruction, timestamped trade and depth updates. Traders should confirm how their software calculates each indicator before interpreting the readings.
Conclusion
Reading order flow imbalances in crypto trading means examining how aggressive orders interact with available liquidity.
Order book imbalance identifies differences in resting depth. CVD measures aggressive executed buying and selling. Footprint charts reveal where transactions occur, while liquidity heatmaps help show how passive orders respond.
Together, these tools can reveal potential buying pressure, selling pressure, absorption, and breakout weakness.
But significant imbalances don't guarantee future price direction. Their strongest practical use is confirming price behavior at meaningful levels while accounting for liquidity, transaction costs, and trading risk.
Frequently Asked Questions
What is a significant order flow imbalance in crypto trading?
A significant order flow imbalance occurs when buying-side or selling-side activity becomes unusually dominant relative to the market's normal conditions. Its importance depends on liquidity, volatility, timeframe, and the measurement method. There is no universal threshold that reliably predicts price movements.
Is order book imbalance the same as volume delta?
No. Order book imbalance compares resting buy and sell liquidity, while volume delta compares buyer-initiated and seller-initiated executed volume. A market may display more buying liquidity while aggressive sellers dominate completed transactions.
Can order flow imbalance predict the next price movement?
Order flow imbalance can help identify short-term supply and demand pressure, but it cannot reliably predict every price movement. Market orders, cancellations, hidden liquidity, and unexpected events can quickly change conditions. Confirmation from actual price behavior remains necessary.
What is the difference between CVD and footprint charts?
CVD accumulates the net difference between aggressive buying and selling over time. Footprint charts display executed buying and selling volume at individual price levels. CVD highlights directional participation, while footprint charts reveal where that activity occurred.
Does order flow trading work for beginners?
Beginners can use basic order books and recent trade data to understand buying and selling pressure. Advanced footprint charts and event-based OFI calculations require more knowledge of market microstructure. Starting with price structure and volume before adding detailed order flow indicators is generally easier.
Is order flow imbalance useful for scalping?
Order flow imbalance can be useful for scalping because it captures short-term liquidity changes and aggressive transactions. However, rapidly changing order books, transaction costs, slippage, and delayed data can make apparent signals difficult to execute profitably.
Disclaimer: Trading cryptocurrencies and leveraged futures involves substantial risk, including potential loss of capital. Past performance does not guarantee future results. Traders should conduct their own research and assess applicable market rules and jurisdictional restrictions before making decisions.