Traders can identify potential fakeouts by checking candle closes, trading volume, momentum, and retest behavior. For crypto day traders and swing traders, these checks help reduce premature entries, although no confirmation method eliminates risk.
Key Takeaways
-
A false breakout occurs when price crosses a key level but quickly returns inside the previous range.
-
Weak volume, long candle wicks, and fading momentum can warn that a breakout lacks support.
-
A candle closing beyond resistance followed by another closing below it indicates a failed upside break.
-
Waiting for a retest and checking higher timeframes can help distinguish a genuine breakout from a fakeout.
-
Combining price action, volume, and risk controls is more reliable than depending on one indicator.
What Is a False Breakout in Trading?
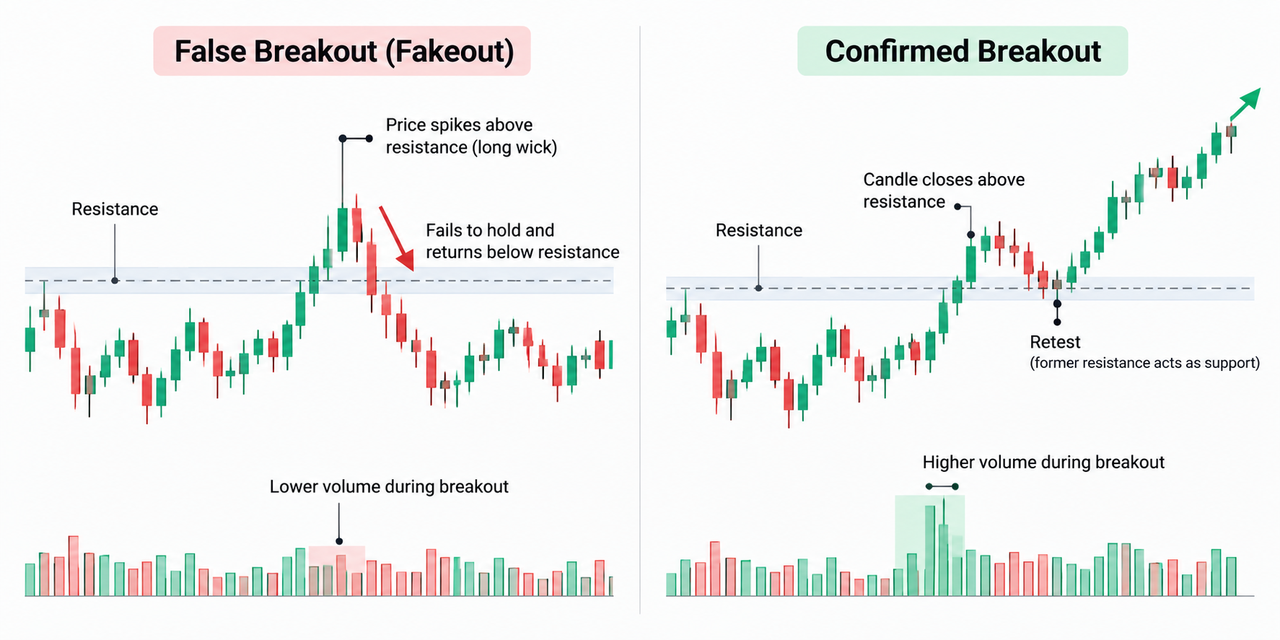
A false breakout, also called a fake breakout, happens when price temporarily moves above resistance or below support without establishing a sustained trend outside that level.
Imagine Bitcoin trading between $80,000 support and $82,000 resistance. Price rises to $82,300, attracting buyers who expect an upside breakout. Instead, the next candle closes at $81,800.
The attempted breakout has failed because price returned below resistance.
The opposite can happen at support. A failed downside break occurs when price falls below support, then recovers into the trading range.
These movements frequently appear around significant support and resistance levels, previous highs and lows, and areas where stop orders may be concentrated.
A brief move beyond a level isn't automatically false. Sometimes the market pauses before continuing. The return inside the range provides stronger evidence of failure.
Why Fake Breakouts Trap Traders
Many retail traders enter breakout trading setups as soon as price crosses a visible chart level. They hope to capture the next significant price movement before other market participants.
That urgency can create problems.
When traders chase a breakout candle, their buy orders may arrive just as earlier buyers take profit. If buying pressure weakens, price can reverse in the opposite direction.
Stop orders also matter. A liquidity sweep happens when price briefly moves beyond an established high or low, encounters available orders, and then reverses.
Large participants, sometimes described as smart money, may trade around these liquidity concentrations. However, a fakeout alone doesn't prove that a bank, institution, or market maker deliberately manipulated prices.
Low-liquidity periods can make sudden movements more pronounced. Crypto trades continuously, including weekends, while stock markets have different regular and extended trading hours.
Herd mentality can amplify these moves when traders follow momentum without waiting for confirmation.
How to Identify False Breakouts Before Entering a Trade
-
Check Whether the Breakout Candle Holds
The first warning appears in the candle structure.
A strong breakout typically closes clearly beyond the breakout level. A candle that briefly crosses resistance but closes below it shows rejection.
Watch for:
-
Long upper wicks after upside breaks
-
Long lower wicks following downside breaks
-
Small, indecisive candles after the initial move
-
A breakout candle followed by a close back inside the range
A completed close above resistance followed by a close below it is a useful definition of a failed upside breakout.
Still, don't assume every long wick guarantees a reversal. The next bar may recover and resume the trend.
-
Compare Breakout Volume With Previous Activity
Volume helps establish whether significant trading activity accompanies price movement.
A genuine breakout often attracts stronger volume than the preceding consolidation. Muted volume suggests participation may be insufficient to sustain the move.
For example, price crossing resistance while volume remains below its recent average deserves caution.
Volume divergence also matters. If price makes a higher high while volume falls, participation may be weakening.
A high-volume breakout can still fail because volume includes both buying and selling. Combining price structure with volume and ATR confirmation provides additional context.
-
Wait for the Break-and-Retest Pattern
A common market rhythm involves a breakout followed by a pullback toward the broken level.
In a bullish setup, former resistance should ideally behave as support.
A weak retest can reveal trouble:
-
Price returns below the breakout level.
-
Buyers fail to reclaim resistance.
-
Subsequent candles close inside the old range.
If the market repeatedly rejects the former support zone, the breakout may have failed.
A successful retest doesn't require a perfect touch. Support and resistance are often zones rather than exact prices.
-
Look for Momentum Weakness
Momentum indicators can reveal whether buying or selling pressure supports the breakout.
The Relative Strength Index (RSI) measures recent price momentum. If price makes a new high while RSI forms a lower high, bearish divergence may indicate weakening momentum.
MACD can provide another perspective through changes in momentum and signal-line behavior.
Using an RSI and MACD confirmation strategy helps traders compare indicator signals with actual price action.
Divergence is only a warning. Strong trends can continue despite temporary momentum weakness.
-
Confirm the Higher-Timeframe Direction
A breakout that looks significant on a five-minute chart might represent a minor price fluctuation on the daily chart.
For swing trading, checking daily resistance levels can prevent overreacting to short-term noise.
Traders can also assess trend strength using ADX and SuperTrend. Weak trend conditions make sustained directional movement less convincing.
Higher-timeframe confirmation adds context but may delay entries.
False Breakout vs Real Breakout: Key Differences
| Signal |
Potential False Breakout |
Potential Real Breakout |
| Candle close |
Returns inside range |
Holds beyond key level |
| Volume |
Muted or fading |
Expands relative to baseline |
| Retest |
Broken level fails to hold |
Former resistance or support holds |
| Momentum |
Weakening or diverging |
Supports price direction |
| Follow-through |
Small candles or reversal |
Continued directional movement |
No individual signal provides a guarantee. Technical analysis works best when several independent observations support the same interpretation.
Example: Spotting a Fake Breakout on BTC/USDT
Consider a hypothetical BTC/USDT trading range between $80,000 and $82,000.
Price rises above resistance to $82,400. The breakout candle closes at $82,150, but volume is lower than during earlier buying activity.
The next candle closes at $81,900. Price then approaches $82,000 from below but cannot reclaim it.
Three observations now point toward a failed breakout: a close back inside the range, weak volume, and an unsuccessful retest.
A trader monitoring the BTC/USDT spot chart on Gate.com can use these observations to evaluate whether the original bullish setup remains valid.
The trader might simply wait instead of entering. Missing an eventual successful breakout is preferable to assuming every price spike represents an opportunity.
Can Traders Trade Fakeouts?
Some experienced traders use failed breakouts as reversal setups.
For example, after a failed upside break, they may watch for a confirmed rejection of former resistance before considering a short position.
For a failed downside break, recovering support can suggest a potential upward reversal.
Before testing such setups, traders should define entry timing, invalidation levels, and possible exits.
A commonly used risk-budgeting example limits planned loss to 1% of account equity per trade. That's a convention, not a universal recommendation or guaranteed maximum loss.
Slippage, fees, sudden volatility, and leverage can increase actual losses.
Risks and Limitations of False Breakout Strategies
False breakout signals sometimes appear during genuine trend continuation. Waiting for multiple confirmations reduces some premature entries but can also mean entering later or missing profitable moves.
Order book activity may help assess visible liquidity, although displayed orders can change or disappear before execution.
The U.S. Securities and Exchange Commission's stop-order guidance explains that stop prices aren't guaranteed execution prices.
Traders should also account for transaction costs, sharp price gaps, and news-driven volatility. A technically convincing setup can fail without warning.
Conclusion
Identifying a false breakout before entering a trade requires observing what happens after price crosses support or resistance.
A return inside the trading range, fading volume, weak momentum, and unsuccessful retests suggest that the move may lack follow-through.
The strongest practical approach is to combine several confirmation signals while keeping risk predefined. Even then, breakout trading involves uncertainty, and no pattern consistently predicts the market's next direction.
FAQ
What is the strongest sign of a false breakout?
A candle closing back inside the previous trading range after crossing support or resistance is a strong warning. Weak volume and an unsuccessful retest increase the evidence of failure.
Can a false breakout happen with high volume?
Yes. High volume can accompany stop-order execution, liquidations, or aggressive trading in both directions. Volume alone cannot establish whether a breakout will succeed.
How long should traders wait to confirm a fake breakout?
There is no universal waiting period. Some traders evaluate the next completed candle, while others require a retest or several closes. The appropriate timeframe depends on the setup and trading strategy.
Are false breakouts common in sideways markets?
False breakouts can occur frequently when price repeatedly tests the boundaries of a trading range without sustained momentum. Low liquidity and sudden volatility may increase the difficulty of distinguishing genuine breaks from temporary moves.
Is a liquidity sweep the same as a false breakout?
Not exactly. A liquidity sweep describes price moving through an area containing potential resting orders or stop orders. A false breakout describes failure to remain beyond a technical level. The two can overlap, but neither proves deliberate manipulation.
Disclaimer
Technical indicators, chart patterns, and historical performance do not guarantee future trading results. Cryptocurrency trading involves substantial risk, including potential losses from volatility, leverage, and liquidity conditions.