For newcomers to technical analysis, choosing complementary tools matters more than filling a chart with signals that may contradict each other.
Key Takeaways
-
Beginners can start with two or three complementary indicators covering trend, momentum, and volume.
-
Moving averages identify trend direction, while RSI and MACD help assess momentum shifts.
-
Volume indicators help confirm trends and evaluate whether breakouts have sufficient participation.
-
Bollinger Bands and ATR measure volatility but cannot predict future price movements.
-
Indicators work best alongside price action, market context, and risk management.
How to Choose Crypto Trading Indicators for Beginners
Technical indicators are calculations based on historical price and volume data. They help traders assess market conditions, identify trading opportunities, and interpret price movements.
Most indicators belong to four categories:
| Indicator category |
Main purpose |
Beginner examples |
| Trend |
Identify market direction |
SMA, EMA |
| Momentum |
Measure movement strength |
RSI, MACD |
| Volume |
Assess market participation |
Volume, OBV |
| Volatility |
Measure price fluctuations |
ATR, Bollinger Bands |
A trend indicator shows trend direction, while momentum indicators measure how quickly prices change. Volume indicators assess participation, and volatility indicators show how widely prices fluctuate.
Beginners don't need every category on their charts. Start with the questions relevant to a trading strategy and select indicators that answer different questions.
Moving Averages: Finding Crypto Trading Trends
Moving averages smooth historical prices to make trend direction easier to recognize.
A Simple Moving Average (SMA) gives equal weight to prices within a selected period. An Exponential Moving Average (EMA) emphasizes recent prices, responding faster to changes.
Price consistently above a rising moving average generally indicates a bullish trend. Sustained trading below a declining average suggests a bearish trend.
For example, a trader examining the BTC/USDT spot market on Gate.com could compare price against the 20-period and 50-period EMAs.
If price remains above both, the current price trend may be bullish. A pullback toward an EMA can identify a potential entry area, but support and price confirmation still matter.
Moving averages become less reliable in sideways markets because repeated crossovers can produce false signals.
RSI and MACD: How to Identify Overbought Conditions
The Relative Strength Index (RSI) and Moving Average Convergence Divergence (MACD) measure momentum differently.
Relative Strength Index (RSI)
The Relative Strength Index (RSI) measures the speed and magnitude of recent price changes on a scale from 0 to 100.
Common interpretations include:
-
Above 70: Potentially overbought conditions.
-
Below 30: Potentially oversold conditions.
-
Around 50: A reference for directional momentum.
An RSI above 70 may warn traders against chasing price rises near a potential market top. Below 30 can indicate stretched selling pressure.
Neither reading guarantees trend reversals. During a strong trend, RSI may remain overbought or oversold for extended periods.
Moving Average Convergence Divergence (MACD)
The Moving Average Convergence Divergence (MACD) indicator tracks the difference between two exponential moving averages, commonly the 12-period and 26-period EMAs.
Its main components are the MACD line, a nine-period EMA signal line, and a histogram.
When the MACD line crosses above the signal line, traders commonly interpret it as bullish momentum. A downward crossover can indicate a bearish signal.
The histogram displays the gap between the two lines, making momentum shifts easier to recognize.
Unlike RSI, MACD isn't bounded between zero and 100. Its crosses can lag price changes and generate conflicting signals during consolidation.
For practical confirmation, an RSI and MACD strategy can compare momentum behavior with actual price structure.
Volume Indicators: Confirming Price Movements
Volume data helps determine whether trading activity supports a move.
A breakout above resistance accompanied by increased trading volume generally carries more evidence of participation than a low-volume breakout. However, heavy volume can also accompany exhaustion or a reversal.
On-Balance Volume (OBV) adds volume when price closes higher and subtracts it when price closes lower. Rising OBV alongside rising prices suggests participation supports the move.
When price makes new highs but OBV fails to follow, the divergence can warn of weakening buying pressure.
Volume Profile takes another approach, showing trading activity at different price levels rather than across time.
Beginners can compare buying and selling pressure using price and volume before interpreting a volume spike as breakout confirmation.
Average True Range and Bollinger Bands in Crypto Markets
Volatility indicators measure the size and variability of price movements.
Average True Range (ATR) estimates average price movement over a chosen period. Rising ATR indicates expanding volatility, regardless of whether price rises or falls.
Bollinger Bands consist of a middle moving average and two outer bands based on standard deviation.
When the bands squeeze together, volatility is relatively low. Expansion indicates increasing volatility, although it doesn't establish breakout direction.
Another momentum tool, the Stochastic Oscillator, commonly uses readings above 80 for overbought conditions and below 20 for oversold conditions. These thresholds are warnings, not automatic trading instructions.
The ATR indicator can help estimate movement ranges when planning stops and profit targets.
How to Combine Indicators for Entry and Exit Points
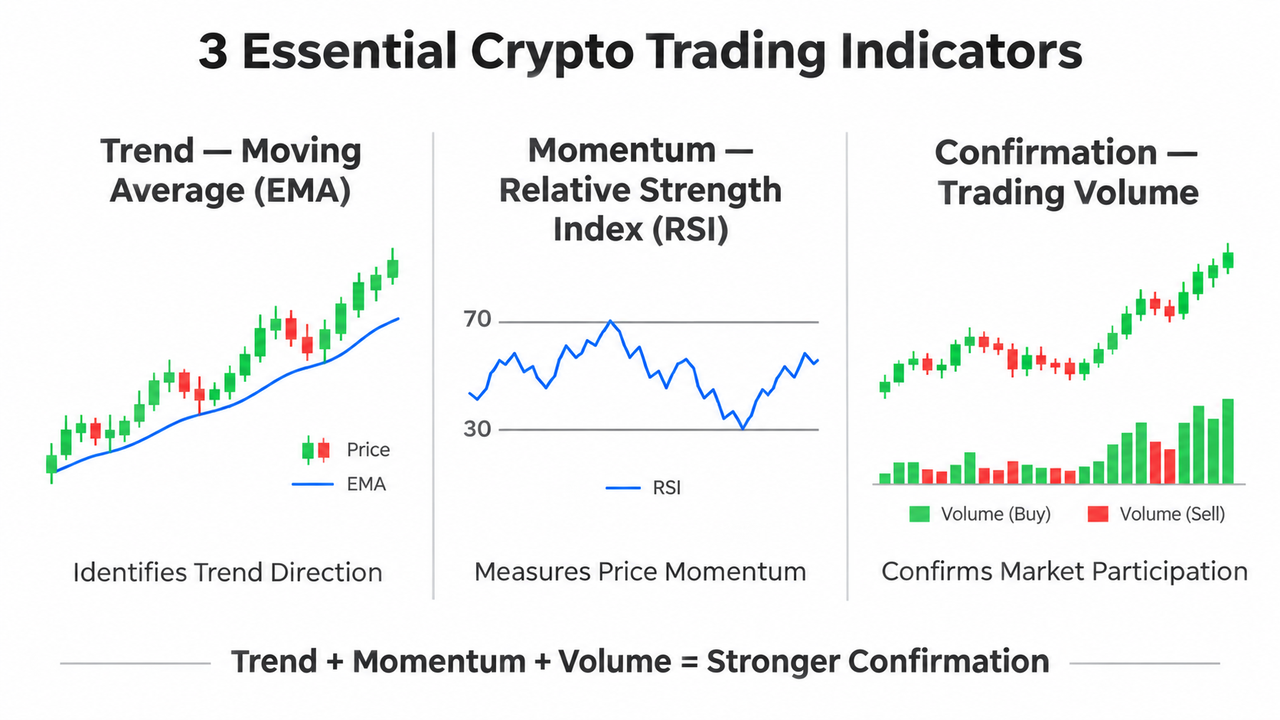
A practical beginner setup uses one trend indicator, one momentum indicator, and one volume indicator.
Consider a hypothetical BTC chart:
-
Trend: Price holds above a rising 50-period EMA.
-
Momentum: RSI moves above 50 following a pullback.
-
Volume: Trading volume increases as price breaks resistance.
-
Price confirmation: A candle closes above the resistance level.
Together, these conditions suggest confluence, meaning independent observations support the same interpretation.
A trader can then identify an invalidation level below nearby support and assess whether the distance to a realistic profit target justifies the risk.
The same approach can fail when a breakout reverses despite confirmation. A breakout retest may provide additional price evidence, although waiting can mean missing an opportunity.
Test combinations on historical charts and longer timeframes before considering live execution. Results should account for fees, slippage, and different market conditions.
Common Indicator Mistakes and Risk Management
Using multiple indicators doesn't automatically produce more informed trading decisions.
Three moving averages may repeat similar information, creating apparent confirmation without adding independent evidence. Too many signals can cause analysis paralysis.
Other common mistakes include interpreting RSI extremes as guaranteed reversals, ignoring chart patterns, and applying trend-following tools during a sideways trend.
Indicators also react to historical data. They cannot reliably forecast unexpected news, liquidity shocks, or sudden changes in market psychology.
The CFTC's virtual currency trading advisory warns that volatility and leveraged trading can magnify losses. FINRA's discussion of frequent intraday trading also highlights trading costs and margin-related risks.
Risk management requires position sizing, defined invalidation levels, and realistic expectations. No indicator can replace those decisions.
Conclusion
Choosing crypto trading indicators for beginners is easier when each tool has a clear purpose. Moving averages establish direction, RSI or MACD evaluates momentum, and volume helps confirm participation.
Start with a small combination, observe its behavior across market conditions, and use indicators to support price action rather than override it. Historical signals cannot guarantee future trading outcomes.
FAQs
Which crypto trading indicators are best for beginners?
Moving averages, RSI, and basic volume indicators are practical starting choices. They cover trend direction, momentum, and trading participation without requiring complicated calculations.
Can beginners trade using only one or two indicators?
Yes. An EMA combined with RSI can provide useful trend and momentum information. Price structure, volume, and risk controls remain necessary considerations.
Is MACD better than RSI for crypto trading?
Neither is universally better. MACD emphasizes changes in trend momentum, while RSI highlights the strength of recent price movements and potential overbought or oversold conditions.
How do indicators help avoid false trading signals?
Combining indicators from different categories can provide additional confirmation. However, signals remain vulnerable to sudden volatility, thin liquidity, and changing market conditions.
Do crypto indicators work in sideways markets?
Some oscillators can help identify range extremes, but moving-average crossovers often become unreliable. Support and resistance levels may provide more useful context during consolidation.
Disclaimer
Technical indicators use historical information and cannot guarantee future results. Cryptocurrency trading involves substantial risk. Conduct your own research and consider your financial circumstances and applicable regulations before making trading decisions.