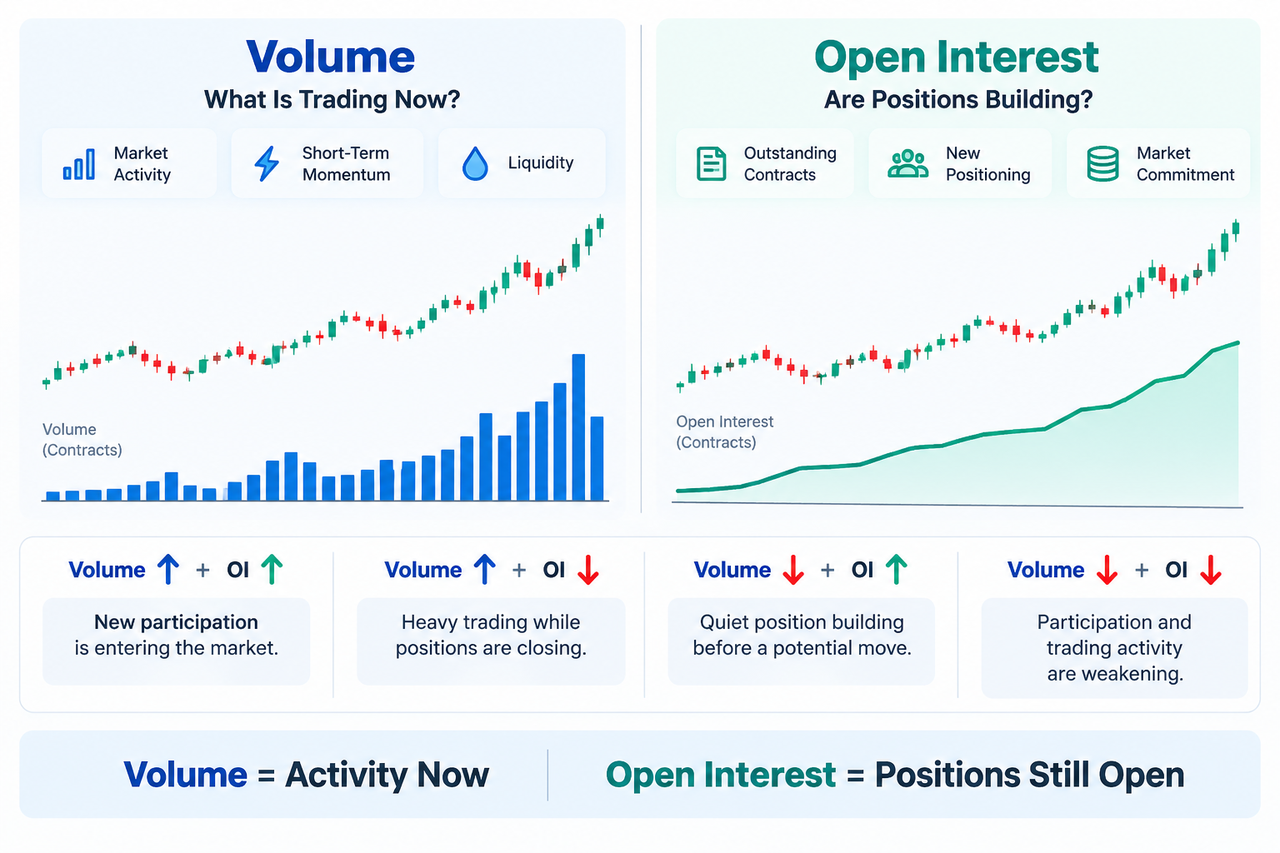
That distinction matters when price starts moving quickly. High volume may show urgency, liquidity and short-term momentum, but it doesn't tell you whether traders are creating new positions. Open interest helps fill that gap by tracking outstanding contracts that haven't yet been closed or settled.
Key Takeaways
-
Trading volume measures activity: it counts contracts traded during a particular period and is especially useful for short-term momentum and liquidity analysis.
-
Open interest measures positioning: it represents outstanding contracts that remain open, helping traders judge whether participation is expanding or contracting.
-
Rising price, rising volume and rising open interest can indicate that fresh participation is supporting a move, but none of these metrics establishes direction on its own.
-
High volume with falling open interest can occur when existing positions are being closed, including during profit-taking, liquidations or short-covering.
-
For order flow analysis, volume is usually stronger for intraday activity while open interest adds context about market commitment and trend structure.
Open Interest vs. Volume: Which Is Better for Order Flow Analysis?
For immediate order flow, trading volume usually has the edge. Volume measures the number of contracts traded over a specific period, so a sudden increase can reveal where market activity and urgency are expanding.
Open interest answers a different question: Are traders adding positions or removing them?
CME Group defines open interest as futures contracts held by market participants that remain outstanding, while volume counts contracts that have traded. CME also notes that only one side of an open contract is counted toward open interest even though every contract has both a buyer and seller.
Unlike volume, open interest accumulates as new contracts are created and declines as existing positions are offset or otherwise closed. Volume, meanwhile, keeps recording transactions throughout the trading period.
| Metric |
Trading Volume |
Open Interest |
| Measures |
Contracts traded |
Outstanding contracts |
| Main purpose |
Market activity and liquidity |
Positioning and participation |
| Best suited to |
Short-term order flow |
Trend and positioning analysis |
| Rises when |
More contracts trade |
New positions increase net open contracts |
| Falls when |
Trading activity slows |
Existing positions are closed |
| Resets/period |
Measured for a defined interval |
Carries forward until contracts close |
| Directional by itself? |
No |
No |
This is why treating high open interest as automatically bullish is a mistake. Every futures contract has both a long position and a short position. Rising open interest tells you participation is increasing, not which side will ultimately win.
How Trading Volume Shows Short-Term Market Activity
Volume captures transactions. If one trader buys 10 contracts while another sells those contracts, 10 contracts of volume are recorded.
High volume often accompanies strong price moves because many market participants are transacting at once. It can also improve tradability. Active markets commonly support deeper order books and narrower bid-ask spreads, although high volume alone doesn't guarantee low slippage.
That makes volume particularly useful to intraday traders. A breakout above a price level with increasing volume usually deserves more attention than the same price move occurring on thin activity.
The principle also appears in indicators built around participation. Net Volume focuses on buying and selling pressure, while On-Balance Volume tracks cumulative volume alongside price. These tools process volume differently, but all start from the idea that market activity can help evaluate a price move.
For perspective, SIFMA reported U.S. options average daily volume of 47.2 million contracts in October 2024, compared with a 2024 year-to-date average of about 46.4 million at that point. The scale illustrates why options volume is closely watched when evaluating liquidity and participation.
How Open Interest Reveals Market Commitment
Open interest measures positioning and market participation rather than transaction frequency.
Suppose total open interest in a particular contract is 100,000 contracts. New buyers and sellers establish 5,000 additional contracts without offsetting existing ones. Open interest can rise to 105,000.
If holders instead close 5,000 existing contracts, open interest declines.
That distinction helps traders judge whether a price move is attracting new positions. CME Group describes increasing open interest as commonly used to confirm trend strength, while declining open interest can indicate that participation behind a trend is weakening. It remains an interpretation rather than a predictive rule.
A crypto trader can apply the same logic using Gate.com futures data. For example, the Gate futures market statistics place open interest and volume alongside funding rates, long-short ratios, taker activity and liquidation data, allowing a price move to be examined from several angles rather than from OI alone. Gate's public futures API also exposes fields for total open interest and long/short taker volume.
Reading Volume and Open Interest Together
The combination is more informative than either metric by itself.
| Volume |
Open Interest |
Common Interpretation |
| Rising |
Rising |
Fresh participation is entering while activity expands |
| Rising |
Falling |
Heavy trading is occurring while positions are being closed |
| Falling |
Rising |
Positions are accumulating despite quieter trading |
| Falling |
Falling |
Participation and trading activity are both contracting |
Rising volume with rising open interest is one of the clearest signs that new positions are being created alongside strong market activity. If price is also trending, traders often treat this as stronger participation behind the move.
High volume with falling open interest tells a different story. Existing positions may be unwinding through closing trades, profit-taking, short-covering or liquidation. The volume can look impressive even while market commitment is shrinking.
Falling volume with rising open interest can indicate quieter position accumulation before a larger move, but it isn't proof that a breakout is coming. Direction still depends on price structure and which participants are taking risk.
Price levels add another layer. A trader might combine OI and volume with daily high and low levels or session highs and lows to see whether participation changes as price approaches support, resistance or breakout zones.
Open Interest, Options Volume and the Put-Call Ratio
Options make the distinction even more granular because traders can inspect volume and open interest at a specific expiration and strike price.
A call option might record high daily options volume but relatively low current open interest. That could mean traders are actively exchanging the contract without building a comparably large stock of outstanding positions.
High open interest at certain price levels, meanwhile, shows where a large number of options contracts remain active. Upcoming expiration can make shifts around those strikes more relevant, but open interest alone doesn't prove that the underlying stock or crypto asset will move toward or away from a strike.
The put-call ratio adds another perspective by comparing put activity with call activity. It can be calculated using options volume or open interest, so traders should check which version they're viewing before drawing conclusions.
Limits of Volume and Open Interest
Neither metric reveals trader intent with certainty.
A rise in open interest doesn't tell you whether new positions are primarily speculative, hedged or part of a multi-leg strategy. Likewise, high volume may come from new traders, existing positions changing hands, algorithmic activity or rapid closing and reopening of exposure.
Data timing matters too. CME publishes preliminary daily volume and open-interest reports after the trading day and official figures afterward. The CFTC's Commitments of Traders, by contrast, provides a weekly breakdown of reportable futures and options positioning based on Tuesday open interest; it is not a daily OI feed.
Crypto perpetual markets can update much faster, but methodology can differ across exchanges. Comparisons should therefore use consistent contracts, timestamps and units.
Which Is Better: Volume or Open Interest?
Volume is generally better for immediate order flow, liquidity and short-term momentum. Open interest is better for understanding whether market participation and outstanding positioning are expanding or contracting.
For a day trader evaluating a fast breakout, volume may matter first. For someone deciding whether that breakout has attracted sustained participation, changes in open interest add useful context.
The strongest approach isn't choosing one metric and ignoring the other. Price shows what happened, volume shows how actively it happened, and open interest helps reveal whether the market built or removed positions along the way.
None of them guarantees what happens next.
FAQ
Does high open interest mean a bullish signal?
No. High open interest means a large number of outstanding contracts remain active. Because every futures contract involves both a long and a short side, direction must be assessed using price, volume and other positioning data.
Is volume better than open interest for day trading?
Volume is usually more immediately useful for intraday analysis because it responds directly to current trading activity. Open interest can still help show whether a move is accompanied by position building or position reduction.
What does rising price with rising open interest mean?
It commonly indicates that the rising market is attracting additional positions. Traders may interpret this as stronger participation behind the trend, but rising open interest doesn't guarantee that the price increase will continue.
What does high volume with falling open interest mean?
It suggests substantial trading activity is occurring while outstanding positions are being reduced. Profit-taking, position closures, short-covering or liquidations can all contribute to this combination.
Does volume reset while open interest carries forward?
Volume is measured over a defined period, such as a trading day, candle or session. Open interest represents contracts that remain outstanding and therefore persists until positions are offset, exercised, delivered or otherwise settled.
Can open interest predict a breakout?
Open interest can't predict a breakout by itself. Rising OI around a developing price move can indicate growing participation, but traders still need price structure, volume, liquidity and risk controls because positioning can unwind just as quickly as it builds.
Disclaimer: Volume, open interest and other technical or derivatives-market indicators can produce ambiguous or false signals, and historical market behavior does not guarantee future results.







